Severity: Notice
Message: Undefined variable: content_category
Filename: user/transcript.php
Line Number: 106
Severity: Warning
Message: Invalid argument supplied for foreach()
Filename: user/transcript.php
Line Number: 106


1) MANAGER SELECTION THE SEARCH FOR ALPHA
2) PAGE 1 The careful pairing of skilled managers within an asset class is one of two requirements to achieve excess returns. The other is patience. There is a powerful argument for passive investment strategies. Perhaps the most obvious is that the average return achieved by all market participants is by definition the return of the market (less fees, of course). It’s a zero sum game, with winners balanced by losers. To the degree that an investor believes manager returns reflect a “random walk down Wall Street” and/or that they don’t have the ability to identify and utilize managers who can really outperform over time, a passive strategy is a way to simply “win by not losing”. Going passive is easy. While there are some nuances to passive management (such as which index to use, market cap vs. fundamentally weighted indices, etc), there’s little to do beyond buying a group of ETF’s or index funds in a manner that tracks the desired asset allocation. Assuming the investor prudently rebalances over time, they will assure themselves of portfolio performance that tracks the weighted indices (less some amount due to fees and tracking error of the investments versus the actual indices). The investor will almost certainly never outperform the markets, but neither should he underperform by any significant amount. But let’s say an investor both believes in active management AND has the ability to do the due diligence needed to identify managers who can beat their indices over time. To outperform, a manager has to make substantially different “bets” than the index such as a concentration of holdings, industry, or risk factors. While these bets may lead to a higher average return than the index (referred to as “alpha”), they almost inevitably also lead to a higher volatility of the manager’s returns than the volatility of the index. Volatility of returns is highly undesirable as it can erode the manager’s excess returns due to a phenomenon called volatility drag. As a simple illustration, a manager who returns +20% one year followed by -10% the next has an average 5% annual return but an IRR of only 3.9%. The manager’s volatility has erased 1.1% of his performance. If increased volatility is a necessary outcome of selecting a manager who can create excess return over time, how does an investor prevent volatility drag from eliminating the outperformance that he has worked so hard to find? The answer is to simultaneously employ several complementary managers within an asset class, with each manager having a distinctly different style and expected source of alpha. Such a combination can allow the higher levels of volatility of each manager to offset each other and allow the excess return to come thru at the overall asset class level. There are two difficulties with such an approach. The first is that it’s hard enough to find ONE good
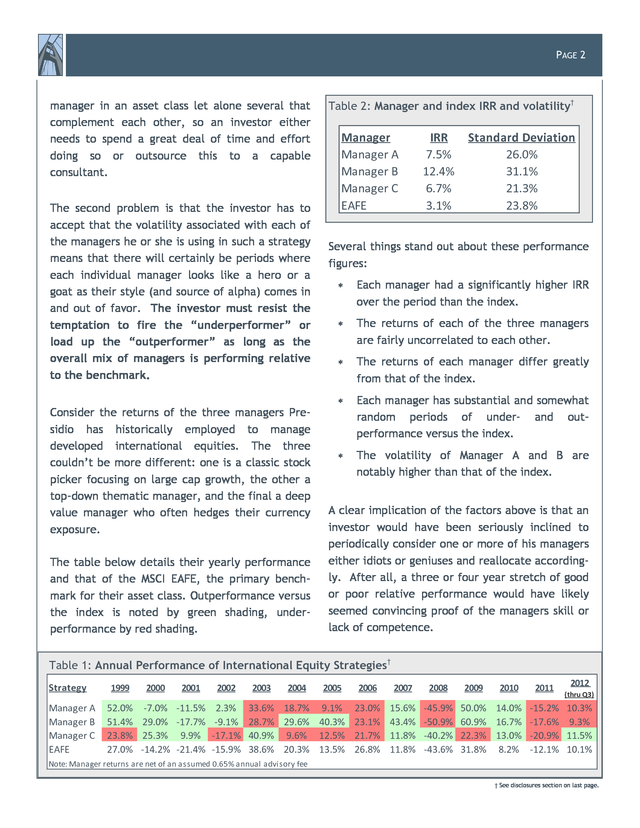
3) PAGE 2 manager in an asset class let alone several that complement each other, so an investor either needs to spend a great deal of time and effort doing so or outsource this to a capable consultant. The second problem is that the investor has to accept that the volatility associated with each of the managers he or she is using in such a strategy means that there will certainly be periods where each individual manager looks like a hero or a goat as their style (and source of alpha) comes in and out of favor. The investor must resist the temptation to fire the “underperformer” or load up the “outperformer” as long as the overall mix of managers is performing relative to the benchmark. Consider the returns of the three managers Presidio has historically employed to manage developed international equities. The three couldn’t be more different: one is a classic stock picker focusing on large cap growth, the other a top-down thematic manager, and the final a deep value manager who often hedges their currency exposure. The table below details their yearly performance and that of the MSCI EAFE, the primary benchmark for their asset class. Outperformance versus the index is noted by green shading, underperformance by red shading. Table 2: Manager and index IRR and volatility† Manager Manager A Manager B Manager C EAFE IRR 7.5% 12.4% 6.7% 3.1% Standard Deviation 26.0% 31.1% 21.3% 23.8% Several things stand out about these performance figures: ∗ Each manager had a significantly higher IRR over the period than the index. ∗ The returns of each of the three managers are fairly uncorrelated to each other. ∗ The returns of each manager differ greatly from that of the index. ∗ Each manager has substantial and somewhat random periods of under- and outperformance versus the index. ∗ The volatility of Manager A and B are notably higher than that of the index. A clear implication of the factors above is that an investor would have been seriously inclined to periodically consider one or more of his managers either idiots or geniuses and reallocate accordingly. After all, a three or four year stretch of good or poor relative performance would have likely seemed convincing proof of the managers skill or lack of competence. Table 1: Annual Performance of International Equity Strategies† Strategy Manager A Manager B Manager C EAFE 1999 2000 2001 52.0% â€7.0% â€11.5% 51.4% 29.0% â€17.7% 23.8% 25.3% 9.9% 27.0% â€14.2% â€21.4% 2002 2.3% â€9.1% â€17.1% â€15.9% 2003 2004 2005 2006 2007 33.6% 18.7% 9.1% 23.0% 15.6% 28.7% 29.6% 40.3% 23.1% 43.4% 40.9% 9.6% 12.5% 21.7% 11.8% 38.6% 20.3% 13.5% 26.8% 11.8% 2008 â€45.9% â€50.9% â€40.2% â€43.6% 2009 2010 2011 2012 (thru Q3) 50.0% 14.0% â€15.2% 10.3% 60.9% 16.7% â€17.6% 9.3% 22.3% 13.0% â€20.9% 11.5% 31.8% 8.2% â€12.1% 10.1% Note: Manager returns are net of an assumed 0.65% annual advisory fee † See disclosures section on last page.
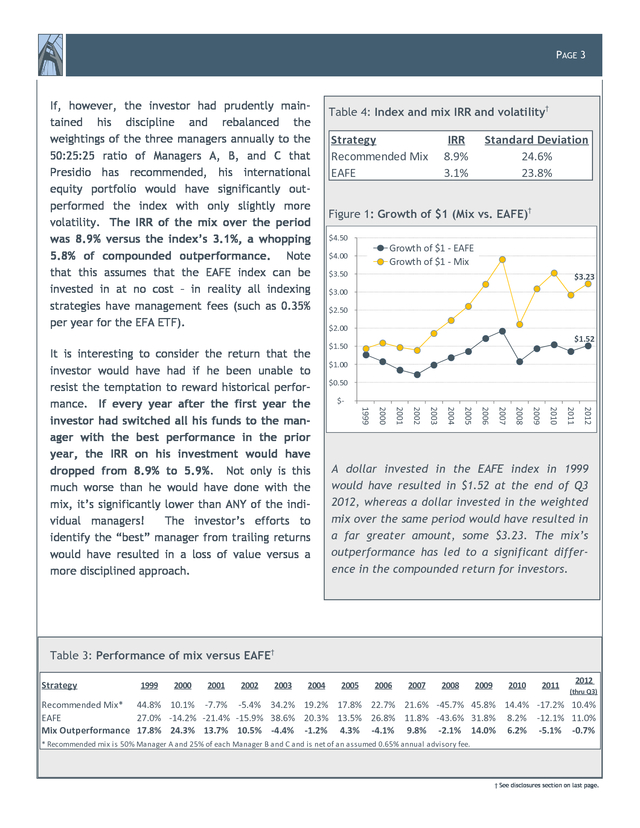
4) PAGE 3 If, however, the investor had prudently maintained his discipline and rebalanced the weightings of the three managers annually to the 50:25:25 ratio of Managers A, B, and C that Presidio has recommended, his international equity portfolio would have significantly outperformed the index with only slightly more volatility. The IRR of the mix over the period was 8.9% versus the index’s 3.1%, a whopping 5.8% of compounded outperformance. Note that this assumes that the EAFE index can be invested in at no cost – in reality all indexing strategies have management fees (such as 0.35% per year for the EFA ETF). Strategy Recommended Mix EAFE IRR 8.9% 3.1% Standard Deviation 24.6% 23.8% Figure 1: Growth of $1 (Mix vs. EAFE)† $4.50 Growth of $1 †EAFE Growth of $1 †Mix $4.00 $3.50 $3.23 $3.00 $2.50 $2.00 $1.52 $1.50 $1.00 $0.50 $†2012 2011 2010 2009 2008 2007 2006 2005 2004 2003 2002 2001 2000 1999 It is interesting to consider the return that the investor would have had if he been unable to resist the temptation to reward historical performance. If every year after the first year the investor had switched all his funds to the manager with the best performance in the prior year, the IRR on his investment would have dropped from 8.9% to 5.9%. Not only is this much worse than he would have done with the mix, it’s significantly lower than ANY of the individual managers! The investor’s efforts to identify the “best” manager from trailing returns would have resulted in a loss of value versus a more disciplined approach. Table 4: Index and mix IRR and volatility† A dollar invested in the EAFE index in 1999 would have resulted in $1.52 at the end of Q3 2012, whereas a dollar invested in the weighted mix over the same period would have resulted in a far greater amount, some $3.23. The mix’s outperformance has led to a significant difference in the compounded return for investors. Table 3: Performance of mix versus EAFE† Strategy 1999 2000 2001 2002 2003 2004 2005 2006 2007 2008 2009 2010 2011 2012 (thru Q3) Recommended Mix* 44.8% 10.1% â€7.7% â€5.4% 34.2% 19.2% 17.8% 22.7% 21.6% â€45.7% 45.8% 14.4% â€17.2% 10.4% EAFE 27.0% â€14.2% â€21.4% â€15.9% 38.6% 20.3% 13.5% 26.8% 11.8% â€43.6% 31.8% 8.2% â€12.1% 11.0% Mix Outperformance 17.8% 24.3% 13.7% 10.5% â€4.4% â€1.2% 4.3% â€4.1% 9.8% â€2.1% 14.0% 6.2% â€5.1% â€0.7% * Recommended mix is 50% Manager A and 25% of each Manager B and C and is net of an assumed 0.65% annual advisory fee. † See disclosures section on last page.
5) PAGE 4 CONCLUSION Investing passively is easy, investing actively is not. The former requires only the selection of a few appropriate indices and ensures average returns. The latter requires far more, but offers the opportunity to capture significant additional returns. If an investor decides to pursue an active approach, necessary skills include: ∗ The ability to identify managers who can outperform over time ∗ An understanding of what drives the manager’s return ∗ The ability to combine complementary managers within an asset class to offset the effects of volatility ∗ The discipline needed to maintain exposure to managers during periods of underperformance ∗ The patience needed to allow outperformance to come through
6) DISCLOSURES PAGE 6 These insights come from Presidio Capital Advisors LLC, a SEC Registered Investment Advisory firm, is a subsidiary of The Presidio Group LLC. There are no warranties, expressed or implied as to the accuracy, completeness, or results obtained from any information in this material. This white paper is provided for information purposes only. This document does not constitute an offer to sell or a solicitation of an offer to purchase securities. Past performance does not guarantee, and is not necessarily indicative of, future results. Index performance does not reflect the deduction of transaction costs, management fees or other costs, which would reduce returns, thus investing in any money manager is not similar to investing in an index. References to market indexes or other measures of relative market performance over a specified period of time are provided for your information only and do not imply that money managers will achieve similar returns, volatility or other results. The composition of an index may not reflect the manner in which a money manager’s portfolio is constructed in relation to expected or achieved returns, restrictions, sectors, correlations, concentrations, volatility, or tracking error targets, all of which may change over time. An investor cannot directly invest in an index. All manager returns presented are net of the manager’s management fee. In addition, performance has been reduced by the amount of the highest fee charged to any Presidio client employing that particular strategy during the period under consideration. Actual fees may vary depending on, among other things, the applicable fee schedule and portfolio size. Actual client allocations may differ from the Recommended Mix and is dependent on the client’s current portfolio holdings, risk level, and investment objective. Thus actual client returns) may be different. Future relative performance of the Recommended Mix may or may not reflect historical performance. The performance represented herein for international equities is not necessarily representative of the performance of other investments recommended by Presidio. Presidio provides broad advisory services to our clients but does not exercise discretion in the selection of or relative allocation to managers. Diversification does not assure a profit or guarantee against a loss in declining markets. Presidio’s fees are available upon request and may be found in Part II of Schedule F of the Form ADV. The MSCI EAFE is the primary benchmark for the composite and is a stock market index of foreign stocks. The index is market-capitalization weighted and includes a selection of stocks from 22 developed markets, but excludes those from the U.S., Canada, and emerging economies. The reported returns reflect a total a total return for each quarter inclusive of dividends. The annual rates of return for Recommended Mix performance for the period 1999 through 2003 and the resulting performance statistics are hypothetical performance. Hypothetical performance does not represent the profit or loss resulting from actual trades. Rather, this hypothetical performance was generated by applying the weightings of the three managers to the target allocation of 50% for Manager A, 25% for Manager B, 25% for Manager C utilizing the returns as specified in Table 1. Hypothetical performance results have many inherent limitations, some of which are described below. No representation is made that any account will or is likely to achieve profits or losses similar to those shown. In fact, there are frequently sharp differences between hypothetical performance results and the results subsequently achieved by any particular trading strategy. One of the limitations of hypothetical performance is that it is generally prepared with the benefit of hindsight. In addition, hypothetical trading does not involved financial risk and no hypothetical trading record can completely account for the impact of financial risk in actual trading. For example, the ability to withstand losses or to adhere to a particular trading program in spite of trading losses are material points that can adversely affect actual results. There are numerous other factors related to the markets in general or to the implementation of any specific portfolio program that cannot be fully accounted for in the preparation of hypothetical performance results and all of which can adversely affect actual portfolio results. Timing of investment in-flows, out-flows, fees, and deductions will impact a client’s portfolio. Due to the differences between hypothetical and actual trading results and because management of the strategy described in this white paper, there are significant inherent limitations in the hypothetical performance information presented herein. Accordingly, customers should be particularly wary of placing any reliance on these results. This material is proprietary and is not allowed to be reproduced, other than for your own personal, noncommercial use, without prior written permission from Presidio. This paper was originally published in 2010 and revised in November 2012. © 2012 All rights reserved.