1) HAYNES AND BOONE, LLP
OIL PATCH BANKRUPTCY
MONITOR
May 16, 2016
© 2016 Haynes and Boone, LLP
© 2016 Haynes and Boone, LLP
�
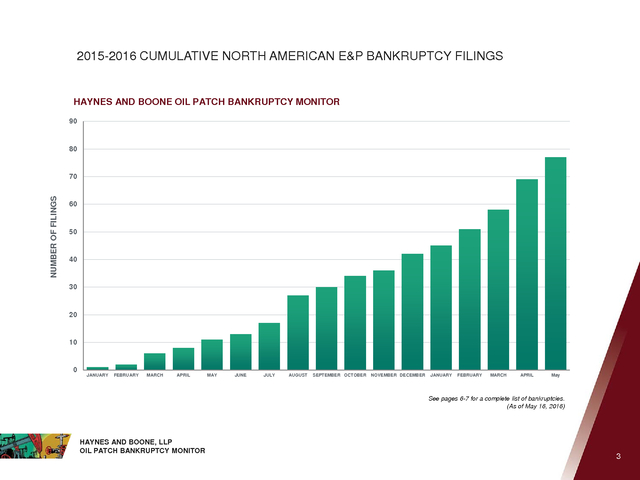
2) Haynes and Boone has tracked 77 North American oil and gas producers that have filed for
bankruptcy since the beginning of 2015. These bankruptcies, including Chapter 7, Chapter
11, Chapter 15, and Canadian cases, involve approximately $51.9 billion in cumulative
secured and unsecured debt. As of May 16, 2016, 35 producers have filed bankruptcy so
far this year, representing approximately $34.7 billion in cumulative secured and unsecured
debt. Despite the modest recovery in energy prices, all indications suggest many more
producer bankruptcy filings will occur during 2016.
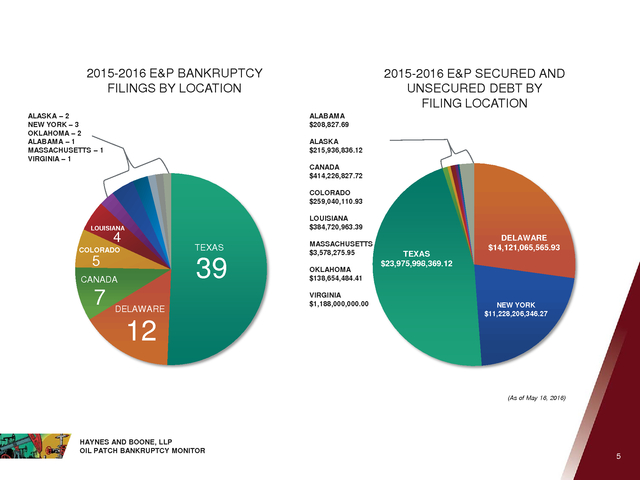
During the month of May, Texas bankruptcy courts surged to the top of the venue
leaderboard, surpassing Delaware in terms of cumulative debt administered. Texas
bankruptcy courts now lead the way both in terms of the number of E&P filings and
cumulative debt. Thirty-nine E&P bankruptcies have been filed in Texas, representing
approximately $24 billion in cumulative secured and unsecured debt.
The lawyers of Haynes and Boone’s Energy and Bankruptcy practice groups are continuing
to follow industry developments. The firm has played a key role in a number of high-profile
E&P and oilfield service matters, including asset sales, refinancings, debt restructurings
and Chapter 11 cases, representing debtors, creditors, energy lenders, and private equity
investors.
Industry analysts and members of the press have referenced the Oil Patch Bankruptcy
Monitor, Oilfield Services Tracker, Oil Patch Bankruptcy Blog, and Haynes and
Boone’s Borrowing Base Survey as an indicator of the impact of market conditions on
producers’ future borrowing bases. The slides that follow include Haynes and Boone’s most
recent summary of E&P bankruptcy filings, which will be updated periodically during 2016.
HAYNES AND BOONE, LLP
OIL PATCH BANKRUPTCY MONITOR
2
�
3) 2015-2016 CUMULATIVE NORTH AMERICAN E&P BANKRUPTCY FILINGS
HAYNES AND BOONE OIL PATCH BANKRUPTCY MONITOR
90
80
NUMBER OF FILINGS
70
60
50
40
30
20
10
0
JANUARY
FEBRUARY
MARCH
APRIL
MAY
JUNE
JULY
AUGUST
SEPTEMBER OCTOBER
NOVEMBER DECEMBER
JANUARY
FEBRUARY
MARCH
APRIL
May
See pages 6-7 for a complete list of bankruptcies.
(As of May 16, 2016)
HAYNES AND BOONE, LLP
OIL PATCH BANKRUPTCY MONITOR
3
�
4) 2015-2016 CUMULATIVE E&P UNSECURED DEBT, SECURED DEBT AND AGGREGATE DEBT
HAYNES AND BOONE OIL PATCH BANKRUPTCY MONITOR
$60
$50
BILLIONS
$40
$30
$20
$10
$0
JANUARY
FEBRUARY
MARCH
APRIL
MAY
JUNE
JULY
AUGUST
SEPTEMBER
OCTOBER
NOVEMBER
DECEMBER
JANUARY
FEBRUARY
MARCH
APRIL
May
See pages 6-7 for a complete list of bankruptcies.
(As of May 16, 2016)
HAYNES AND BOONE, LLP
OIL PATCH BANKRUPTCY MONITOR
4
�
5) 2015-2016 E&P BANKRUPTCY
FILINGS BY LOCATION
ALASKA – 2
NEW YORK – 3
OKLAHOMA – 2
ALABAMA – 1
MASSACHUSETTS – 1
VIRGINIA – 1
2015-2016 E&P SECURED AND
UNSECURED DEBT BY
FILING LOCATION
ALABAMA
$208,827.69
ALASKA
$215,936,836.12
CANADA
$414,226,827.72
COLORADO
$259,040,110.93
LOUISIANA
$384,720,963.39
LOUISIANA
4
TEXAS
COLORADO
5
39
CANADA
7
DELAWARE
MASSACHUSETTS
$3,578,275.95
OKLAHOMA
$138,654,484.41
VIRGINIA
$1,188,000,000.00
TEXAS
$23,975,998,369.12
DELAWARE
$14,121,065,565.93
NEW YORK
$11,228,206,346.27
12
(As of May 16, 2016)
HAYNES AND BOONE, LLP
OIL PATCH BANKRUPTCY MONITOR
5
�
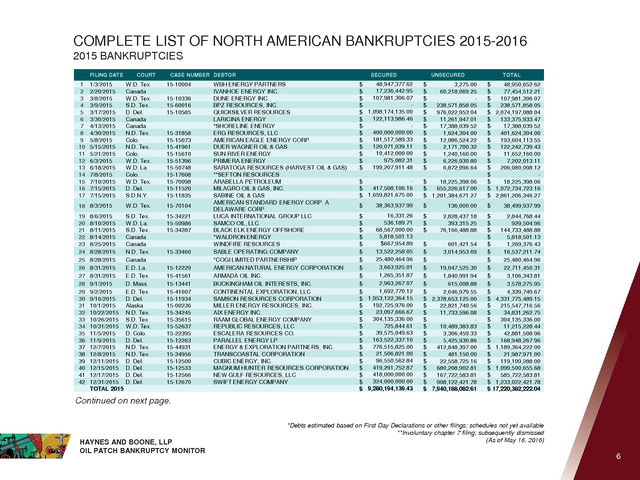
6) COMPLETE LIST OF NORTH AMERICAN BANKRUPTCIES 2015-2016
2015 BANKRUPTCIES
FILING DATE
1
2
3
4
5
6
7
8
9
10
11
12
13
14
15
16
17
1/3/2015
2/20/2015
3/8/2015
3/9/2015
3/17/2015
3/30/2015
4/13/2015
4/30/2015
5/8/2015
5/15/2015
5/21/2015
6/3/2015
6/18/2015
7/8/2015
7/10/2015
7/15/2015
7/15/2015
18 8/3/2015
19
20
21
22
23
24
25
26
27
28
29
30
31
32
33
34
35
36
37
38
39
40
41
42
8/6/2015
8/10/2015
8/11/2015
8/14/2015
8/25/2015
8/28/2015
8/28/2015
8/31/2015
8/31/2015
9/1/2015
9/2/2015
9/16/2015
10/1/2015
10/22/2015
10/26/2015
10/31/2015
11/5/2015
11/9/2015
12/7/2015
12/8/2015
12/11/2015
12/15/2015
12/17/2015
12/31/2015
TOTAL 2015
COURT
CASE NUMBER DEBTOR
W.D. Tex.
Canada
W.D. Tex.
S.D. Tex.
D. Del.
Canada
Canada
N.D. Tex.
Colo.
N.D. Tex.
Colo.
W.D. Tex.
W.D. La.
Colo.
W.D. Tex.
D. Del.
S.D.N.Y.
15-10004
W.D. Tex.
15-70104
S.D. Tex.
W.D. La.
S.D. Tex.
Canada
Canada
N.D. Tex.
Canada
E.D. La.
E.D. Tex.
D. Mass
E.D. Tex.
D. Del.
Alaska
N.D. Tex.
S.D. Tex.
W.D. Tex.
D. Colo.
D. Del.
N.D. Tex.
N.D. Tex.
D. Del.
D. Del.
D. Del.
D. Del.
15-34221
15-50986
15-34287
15-10336
15-60016
15-10585
15-31858
15-15073
15-41961
15-15610
15-51396
15-50748
15-17608
15-70098
15-11520
15-11835
15-33460
15-12229
15-41561
15-13441
15-41607
15-11934
15-00236
15-34245
15-35615
15-52637
15-22395
15-12263
15-44931
15-34956
15-12500
15-12533
15-12566
15-12670
SECURED
WBH ENERGY PARTNERS
IVANHOE ENERGY INC.
DUNE ENERGY INC.
BPZ RESOURCES, INC.
QUICKSILVER RESOURCES
LARICINA ENERGY
*SHORELINE ENERGY
ERG RESOURCES, LLC
AMERICAN EAGLE ENERGY CORP.
DUER WAGNER OIL & GAS
SUN RIVER ENERGY
PRIMERA ENERGY
SARATOGA RESOURCES (HARVEST OIL & GAS)
**SEFTON RESOURCES
ARABELLA PETROLEUM
MILAGRO OIL & GAS, INC.
SABINE OIL & GAS
AMERICAN STANDARD ENERGY CORP. A
DELAWARE CORP.
LUCA INTERNATIONAL GROUP LLC
SAMCO OIL, LLC
BLACK ELK ENERGY OFFSHORE
*WALDRON ENERGY
WINDFIRE RESOURCES
SABLE OPERATING COMPANY
*COGI LIMITED PARTNERSHIP
AMERICAN NATURAL ENERGY CORPORATION
ARMADA OIL INC.
BUCKINGHAM OIL INTERESTS, INC.
CONTINENTAL EXPLORATION, LLC
SAMSON RESOURCES CORPORATION
MILLER ENERGY RESOURCES, INC.
AIX ENERGY INC.
RAAM GLOBAL ENERGY COMPANY
REPUBLIC RESOURCES, LLC
ESCALERA RESOURCES CO.
PARALLEL ENERGY LP
ENERGY & EXPLORATION PARTNERS, INC.
TRANSCOASTAL CORPORATION
CUBIC ENERGY, INC.
MAGNUM HUNTER RESOURCES CORPORATION
NEW GULF RESOURCES, LLC
SWIFT ENERGY COMPANY
UNSECURED
TOTAL
48,947,377.62
$
17,236,442.95
$
107,981,306.07
$
$
$ 1,098,174,135.00
122,113,986.46
$
$
400,000,000.00
$
181,517,589.33
$
120,071,039.11
$
10,412,000.00
$
975,082.31
$
199,207,911.48
$
$
$
$
$
$
$
$
$
$
$
$
$
$
$
417,508,106.16
$
$ 1,659,821,675.00
$
18,225,398.06
$
655,226,617.00
$ 1,201,384,671.27
$
48,950,652.62
$
77,454,512.21
$
107,981,306.07
$
238,571,858.05
$ 2,074,197,088.04
$
133,375,933.47
$
17,388,039.52
$
401,624,304.00
$
193,604,113.55
$
122,242,739.43
$
11,652,160.00
$
7,202,013.11
$
206,080,008.12
$
$
18,225,398.06
$ 1,072,734,723.16
$ 2,861,206,346.27
38,363,937.99
$
136,000.00
$
38,499,937.99
16,331.26
$
536,189.71
$
68,567,000.00
$
5,818,501.13
$
$667,954.89
$
13,522,258.05
$
25,480,464.96
$
3,663,925.01
$
1,265,351.87
$
2,963,267.07
$
1,692,770.12
$
$ 1,953,122,364.15
192,725,976.00
$
23,097,666.67
$
304,135,336.00
$
725,844.61
$
39,575,049.63
$
163,522,337.10
$
776,515,825.00
$
21,506,821.00
$
96,550,562.84
$
419,291,752.87
$
418,000,000.00
$
324,900,000.00
$
$ 9,280,194,139.43
$
$
$
2,828,437.18
393,315.25
76,166,488.88
$
$
$
$
$
$
$
$
$
$
$
$
$
$
$
$
$
$
$
$
$
$
$
$
$
2,844,768.44
929,504.96
144,733,488.88
5,818,501.13
1,269,376.43
16,537,211.74
25,480,464.96
22,711,450.31
3,106,343.81
3,578,275.95
4,339,749.67
4,331,775,489.15
215,547,716.56
34,831,262.75
304,135,336.00
11,215,228.44
42,881,508.96
168,948,267.96
1,189,364,222.00
21,987,971.00
119,109,288.00
1,099,500,655.68
585,722,583.81
1,233,022,421.78
17,220,382,222.04
$
3,275.00
60,218,069.25
238,571,858.05
976,022,953.04
11,261,947.01
17,388,039.52
1,624,304.00
12,086,524.22
2,171,700.32
1,240,160.00
6,226,930.80
6,872,096.64
$
601,421.54
$
3,014,953.69
$
$
19,047,525.30
$
1,840,991.94
$
615,008.88
$
2,646,979.55
$ 2,378,653,125.00
$
22,821,740.56
$
11,733,596.08
$
$
10,489,383.83
$
3,306,459.33
$
5,425,930.86
$
412,848,397.00
$
481,150.00
$
22,558,725.16
$
680,208,902.81
$
167,722,583.81
$
908,122,421.78
$ 7,940,188,082.61
Continued on next page.
HAYNES AND BOONE, LLP
OIL PATCH BANKRUPTCY MONITOR
*Debts estimated based on First Day Declarations or other filings; schedules not yet available
**Involuntary chapter 7 filing; subsequently dismissed
(As of May 16, 2016)
6
�
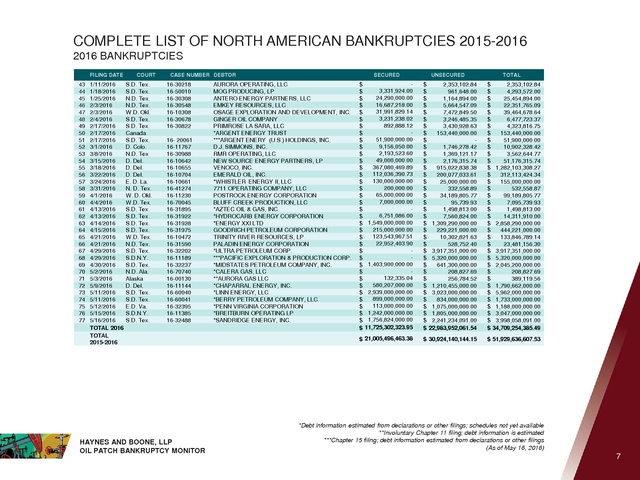
7) COMPLETE LIST OF NORTH AMERICAN BANKRUPTCIES 2015-2016
2016 BANKRUPTCIES
FILING DATE
43
44
45
46
47
48
49
50
51
52
53
54
55
56
57
58
59
60
61
62
63
64
65
66
67
68
69
70
71
72
73
74
75
76
77
1/11/2016
1/18/2016
1/25/2016
2/3/2016
2/3/2016
2/4/2016
2/17/2016
2/17/2016
2/17/2016
3/1/2016
3/8/2016
3/15/2016
3/18/2016
3/22/2016
3/24/2016
3/31/2016
4/1/2016
4/4/2016
4/13/2016
4/13/2016
4/14/2016
4/15/2016
4/21/2016
4/21/2016
4/29/2016
4/29/2016
4/30/2016
5/2/2016
5/3/2016
5/9/2016
5/11/2016
5/11/2016
5/12/2016
5/15/2016
5/16/2016
TOTAL 2016
TOTAL
2015-2016
COURT
S.D. Tex.
S.D. Tex.
N.D. Tex.
N.D. Tex.
W.D. Okl.
S.D. Tex.
S.D. Tex.
Canada
S.D. Tex.
D. Colo.
N.D. Tex
D. Del.
D. Del.
D. Del.
E. D. La.
N. D. Tex.
W. D. Okl.
W.D. Tex.
S.D. Tex.
S.D. Tex.
S.D. Tex.
S.D. Tex.
W.D. Tex.
N.D. Tex.
S.D. Tex.
S.D.N.Y.
S.D. Tex.
N.D. Ala.
Alaska
D. Del.
S.D. Tex.
S.D. Tex.
E.D. Va.
S.D.N.Y.
S.D. Tex.
CASE NUMBER DEBTOR
16-30218
16-50010
16-30308
16-30548
16-10308
16-30678
16-30822
16- 20061
16-11767
16-30988
16-10642
16-10655
16-10704
16-10661
16-41274
16-11230
16-70045
16-31895
16-31922
16-31928
16-31975
16-10472
16-31590
16-32202
16-11189
16-32237
16-70740
16-00130
16-11144
16-60040
16-60041
16-32395
16-11385
16-32488
HAYNES AND BOONE, LLP
OIL PATCH BANKRUPTCY MONITOR
SECURED
AURORA OPERATING, LLC
MOG PRODUCING, LP
ANTERO ENERGY PARTNERS, LLC
EMKEY RESOURCES, LLC
OSAGE EXPLORATION AND DEVELOPMENT, INC.
GINGER OIL COMPANY
PRIMROSE LA SARA, LLC
*ARGENT ENERGY TRUST
***ARGENT ENERY (U.S.) HOLDINGS, INC.
D.J. SIMMONS, INC.
RMR OPERATING, LLC
NEW SOURCE ENERGY PARTNERS, LP
VENOCO, INC.
EMERALD OIL, INC.
*WHISTLER ENERGY II, LLC
7711 OPERATING COMPANY, LLC
POSTROCK ENERGY CORPORATION
BLUFF CREEK PRODUCTION, LLC
*AZTEC OIL & GAS, INC.
*HYDROCARB ENERGY CORPORATION
*ENERGY XXI LTD
GOODRICH PETROLEUM CORPORATION
TRINITY RIVER RESOURCES, LP
PALADIN ENERGY CORPORATION
*ULTRA PETROLEUM CORP.
***PACIFIC EXPLORATION & PRODUCTION CORP.
*MIDSTATES PETROLEUM COMPANY, INC.
*CALERA GAS, LLC
**AURORA GAS LLC
*CHAPARRAL ENERGY, INC.
*LINN ENERGY, LLC
*BERRY PETROLEUM COMPANY, LLC
*PENN VIRGINIA CORPORATION
*BREITBURN OPERATING LP
*SANDRIDGE ENERGY, INC.
$
$
$
$
$
$
$
$
$
$
$
$
$
$
$
$
$
$
$
$
$
$
$
$
$
$
$
$
$
$
$
$
$
$
$
$
3,331,924.00
24,290,000.00
16,687,218.00
31,991,829.14
3,231,238.02
892,888.12
51,900,000.00
9,156,050.00
2,193,523.60
49,000,000.00
367,080,469.89
112,036,390.73
130,000,000.00
200,000.00
65,000,000.00
7,000,000.00
6,751,086.00
1,549,000,000.00
215,000,000.00
123,543,967.51
22,952,403.90
1,403,900,000.00
132,335.04
580,207,000.00
2,939,000,000.00
899,000,000.00
113,000,000.00
1,242,000,000.00
1,756,824,000.00
11,725,302,323.95
$ 21,005,496,463.38
UNSECURED
$
$
$
$
$
$
$
$
$
$
$
$
$
$
$
$
$
$
$
$
$
$
$
$
$
$
$
$
$
$
$
$
$
$
$
$
2,353,102.84
961,648.00
1,164,894.00
5,664,547.09
7,472,849.50
3,246,485.35
3,430,928.63
153,440,000.00
1,746,278.42
1,369,121.17
2,176,315.74
915,022,838.38
200,077,033.61
25,000,000.00
332,558.89
34,189,805.77
95,739.93
1,498,813.00
7,560,824.00
1,309,290,000.00
229,221,000.00
10,302,821.63
528,752.40
3,917,351,000.00
5,320,000,000.00
641,300,000.00
208,827.69
256,784.52
1,210,455,000.00
3,023,000,000.00
834,000,000.00
1,075,000,000.00
1,805,000,000.00
2,241,234,091.00
22,983,952,061.54
$ 30,924,140,144.15
TOTAL
$
$
$
$
$
$
$
$
$
$
$
$
$
$
$
$
$
$
$
$
$
$
$
$
$
$
$
$
$
$
$
$
$
$
$
$
2,353,102.84
4,293,572.00
25,454,894.00
22,351,765.09
39,464,678.64
6,477,723.37
4,323,816.75
153,440,000.00
51,900,000.00
10,902,328.42
3,562,644.77
51,176,315.74
1,282,103,308.27
312,113,424.34
155,000,000.00
532,558.87
99,189,805.77
7,095,739.93
1,498,813.00
14,311,910.00
2,858,290,000.00
444,221,000.00
133,846,789.14
23,481,156.30
3,917,351,000.00
5,320,000,000.00
2,045,200,000.00
208,827.69
389,119.56
1,790,662,000.00
5,962,000,000.00
1,733,000,000.00
1,188,000,000.00
3,047,000,000.00
3,998,058,091.00
34,709,254,385.49
$ 51,929,636,607.53
*Debt information estimated from declarations or other filings; schedules not yet available
**Involuntary Chapter 11 filing; debt information is estimated
***Chapter 15 filing; debt information estimated from declarations or other filings
(As of May 16, 2016)
7
�
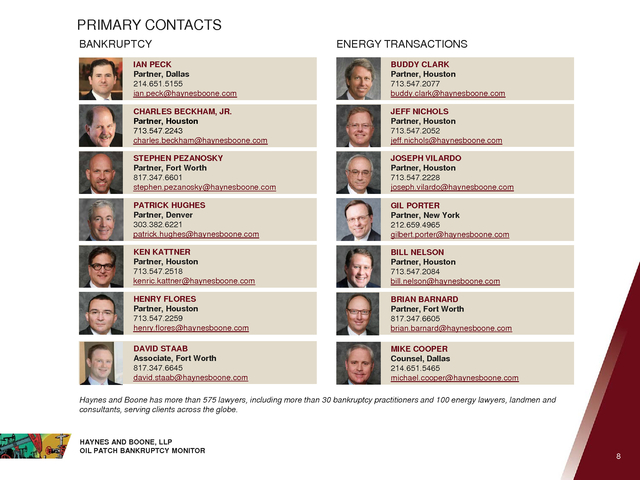
8) PRIMARY CONTACTS
BANKRUPTCY
ENERGY TRANSACTIONS
IAN PECK
Partner, Dallas
214.651.5155
ian.peck@haynesboone.com
BUDDY CLARK
Partner, Houston
713.547.2077
buddy.clark@haynesboone.com
CHARLES BECKHAM, JR.
Partner, Houston
713.547.2243
charles.beckham@haynesboone.com
JEFF NICHOLS
Partner, Houston
713.547.2052
jeff.nichols@haynesboone.com
STEPHEN PEZANOSKY
Partner, Fort Worth
817.347.6601
stephen.pezanosky@haynesboone.com
JOSEPH VILARDO
Partner, Houston
713.547.2228
joseph.vilardo@haynesboone.com
PATRICK HUGHES
Partner, Denver
303.382.6221
patrick.hughes@haynesboone.com
GIL PORTER
Partner, New York
212.659.4965
gilbert.porter@haynesboone.com
KEN KATTNER
Partner, Houston
713.547.2518
kenric.kattner@haynesboone.com
BILL NELSON
Partner, Houston
713.547.2084
bill.nelson@haynesboone.com
HENRY FLORES
Partner, Houston
713.547.2259
henry.flores@haynesboone.com
BRIAN BARNARD
Partner, Fort Worth
817.347.6605
brian.barnard@haynesboone.com
DAVID STAAB
Associate, Fort Worth
817.347.6645
david.staab@haynesboone.com
MIKE COOPER
Counsel, Dallas
214.651.5465
michael.cooper@haynesboone.com
Haynes and Boone has more than 575 lawyers, including more than 30 bankruptcy practitioners and 100 energy lawyers, landmen and
consultants, serving clients across the globe.
HAYNES AND BOONE, LLP
OIL PATCH BANKRUPTCY MONITOR
8
�
9) LOCATIONS
AUSTIN
CHICAGO
DALLAS
DENVER
FORT WORTH
600 Congress Avenue
Suite 1300
Austin, TX 78701
United States of America
180 N. LaSalle Street
Suite 2215
Chicago, IL 60601
United States of America
2323 Victory Avenue
Suite 700
Dallas, TX 75219
United States of America
1801 Broadway Street
Suite 800
Denver, CO 80202
United States of America
301 Commerce Street
Suite 2600
Fort Worth, TX 76102
United States of America
T
F
T
F
T
F
T
F
T
F
+1 512.867.8400
+1 512.867.8470
+1 312.216.1620
+1 312.216.1621
+1 214.651.5000
+1 214.651.5940
+1 303.382.6200
+1 303.382.6210
+1 817.347.6600
+1 817.347.6650
HOUSTON
MEXICO CITY
NEW YORK
ORANGE COUNTY
PALO ALTO
1221 McKinney Street
Suite 2100
Houston, TX 77010
United States of America
Torre Esmeralda I, Blvd.
Manuel Ávila Camacho #40
Despacho 1601
Col. Lomas de Chapultepec,
DF 11000
Mexico City, Mexico
30 Rockefeller Plaza
26th Floor
New York, NY 10112
United States of America
600 Anton Boulevard
Suite 700
Costa Mesa, CA 92626
United States of America
525 University Avenue
Suite 400
Palo Alto, CA 94301
United States of America
T +1 212.659.7300
F +1 212.918.8989
T +1 949.202.3000
F +1 949.202.3001
T
F
T
F
+1 713.547.2000
+1 713.547.2600
+1 650.687.8800
+1 650.687.8801
T +52.55.5249.1800
F +52.55.5249.1801
RICHARDSON
SAN ANTONIO
SHANGHAI
WASHINGTON, D.C.
2505 North Plano Road
Suite 4000
Richardson, TX 75082
United States of America
112 East Pecan Street
Suite 1200
San Antonio, TX 78205
United States of America
800 17th Street, NW
Suite 500
Washington, D.C. 20006
United States of America
T +1 972.739.6900
F +1 972.680.7551
T
F
Shanghai International
Finance Center, Tower 2
Unit 3620, Level 36
8 Century Avenue, Pudong
Shanghai 200120, P.R. China
+1 210.978.7000
+1 210.978.7450
HAYNES AND BOONE, LLP
OIL PATCH BANKRUPTCY MONITOR
T
F
+86.21.6062.6179
+86.21.6062.6347
T
F
+1 202.654.4500
+1 202.654.4501
9
�
10) This publication is for informational purposes only and is not intended to be legal advice and does not establish an attorney-client
relationship. Legal advice of any nature should be sought from legal counsel.
© 2016 Haynes and Boone, LLP
�