Severity: Notice
Message: Undefined variable: content_category
Filename: user/transcript.php
Line Number: 106
Severity: Warning
Message: Invalid argument supplied for foreach()
Filename: user/transcript.php
Line Number: 106


1) The House View: The Challenge of Diversification by Lee Partridge, Chief Investment Officer November 3, 2015 Key Market Returns and Reference Points as of October 30, 2015 Region US Large Cap US Small Cap Japan Germany Developed ex US Developed World Emerging Markets MLPs REITs Equity Markets Total Returns (%) Current MTD QTD YTD Price 2079.36 8.44 8.44 2.70 1161.86 5.63 5.63 -2.53 1558.20 10.42 10.42 12.60 10850.14 12.32 12.32 10.65 1756.45 7.55 7.55 0.85 1705.80 7.96 7.96 1.92 847.84 7.14 -9.22 7.14 329.97 9.69 9.69 -23.95 1492.05 6.52 6.52 1.65 U.S. Equity Sector Total Returns (%) 1-Year 5.19 0.34 18.99 16.33 -1.20 2.40 -14.23 -30.08 5.34 Commodity Market Price Changes (% based on 1st Futures contract) Current Price MTD QTD YTD 1-Year Commodity Spot Gold 1142.11 2.42 2.42 -3.57 -2.63 Copper 231.75 -1.00 -1.00 -17.98 -23.94 Crude (WTI) 46.59 3.33 3.33 -12.54 -42.15 -40.07 Natural Gas 2.32 -8.04 -8.04 -19.66 Soybeans 883.75 -0.92 -0.92 -13.29 -15.55 Wheat 522.00 1.80 1.80 -11.49 -1.97 Commodity Core Fixed Income High Yield Bonds Fixed Income Market Total Returns (%) Current Price MTD QTD YTD 1936.76 0.02 0.02 1.14 1624.70 2.75 2.75 0.23 3-Year 56.86 47.81 122.33 49.44 24.65 41.75 -7.47 -2.27 38.13 3-Year -33.62 -34.12 -45.98 -37.13 -42.87 -39.62 Sector Consumer Discretionary Consumer Staples Energy Financials Health Care Industrials Information Technology Materials Telecom Service Utilities MTD 9.07 5.82 11.44 6.24 7.75 9.19 10.76 13.52 7.11 1.09 QTD 9.07 5.82 11.44 6.24 7.75 9.19 10.76 13.52 7.11 1.09 YTD 13.53 4.79 -12.27 -1.26 5.46 -1.46 7.47 -5.19 2.92 -4.82 1-Year 20.85 9.38 -19.32 2.82 7.58 1.43 11.19 -4.48 -2.25 -0.29 3-Year 84.77 52.39 0.33 60.21 87.69 58.66 67.60 33.57 16.05 33.11 Global Sovereign Bond Yields and Changes (bps) Current Country Yield (%) QTD MTD YTD US 2.14 10.50 10.50 -2.90 Japan 0.30 -4.70 -1.80 -4.70 Germany 0.52 -6.90 -6.90 -2.10 Australia 2.61 0.60 0.60 -12.80 Canada 1.54 10.90 10.90 -24.70 United Kingdom 1.92 16.00 16.00 16.60 1-Year -19.30 -14.90 -32.30 -67.30 -50.60 -32.50 Currency Price Changes (%) 1-Year 1.96 -1.94 3-Year 5.02 12.97 Euro Spot Japanese Yen Spot China Renminbi Spot Trade-Weighted US Dollar Current Pr 1.10 120.62 6.32 96.95 MTD -1.53 -0.61 0.61 0.62 QTD -1.53 -0.61 0.61 0.62 YTD -9.03 -0.70 -1.77 7.40 1-Year -12.13 -6.88 -3.24 11.54 Sources: Bloomberg, Standard & Poor’s, Tokyo Stock Price Index, Morgan Stanley Capital Index, Alerian, Barclays Capital, Chicago Mercantile Exchange, and Global Industry Classification Standard. Notes: Equity market returns include dividends and price changes over the reference period. US equity sectors are based on level one of the Global Industry Classification Standards (GICS). Except for gold, commodity market price changes are based on the first futures contract. Gold prices are referenced from the spot market. Sovereign debt market yields reference local currency returns for 10-year benchmark bond/note. Currency prices are relative to the U.S. dollar. For illustrative purposes only. Past performance does not guarantee future performance. Index performance does not reflect the deduction of fees, expenses, or taxes. The indices are unmanaged and are not available for direct investment. Summary Many investors have been frustrated by their attempts to diversify portfolios with allocations to nonU.S. markets, high yield bonds and extended asset classes like commodities, real estate investment trusts (REITs) and master limited partnerships (MLPs). In most cases, these efforts have detracted from the results that a simple 60% allocation to U.S. large cap stocks, based upon the S&P 500, and a 40% allocation to U.S. core fixed income, based upon the Barclays Aggregate Bond, would have produced. In this post, we examine the actual results of the two portfolios going back to 1990; note three distinct © 2015 Salient. All Rights Reserved. | The House View 1
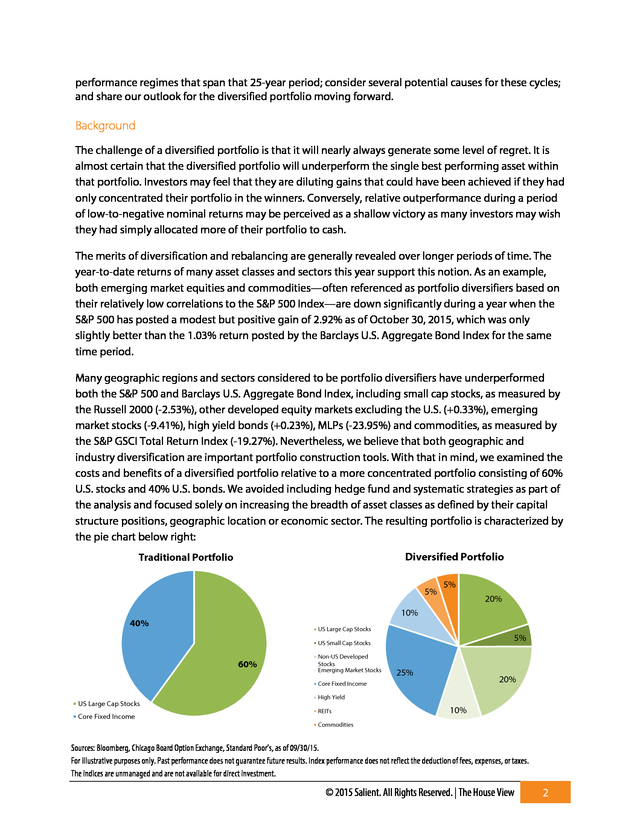
2) performance regimes that span that 25-year period; consider several potential causes for these cycles; and share our outlook for the diversified portfolio moving forward. Background The challenge of a diversified portfolio is that it will nearly always generate some level of regret. It is almost certain that the diversified portfolio will underperform the single best performing asset within that portfolio. Investors may feel that they are diluting gains that could have been achieved if they had only concentrated their portfolio in the winners. Conversely, relative outperformance during a period of low-to-negative nominal returns may be perceived as a shallow victory as many investors may wish they had simply allocated more of their portfolio to cash. The merits of diversification and rebalancing are generally revealed over longer periods of time. The year-to-date returns of many asset classes and sectors this year support this notion. As an example, both emerging market equities and commodities—often referenced as portfolio diversifiers based on their relatively low correlations to the S&P 500 Index—are down significantly during a year when the S&P 500 has posted a modest but positive gain of 2.92% as of October 30, 2015, which was only slightly better than the 1.03% return posted by the Barclays U.S. Aggregate Bond Index for the same time period. Many geographic regions and sectors considered to be portfolio diversifiers have underperformed both the S&P 500 and Barclays U.S. Aggregate Bond Index, including small cap stocks, as measured by the Russell 2000 (-2.53%), other developed equity markets excluding the U.S. (+0.33%), emerging market stocks (-9.41%), high yield bonds (+0.23%), MLPs (-23.95%) and commodities, as measured by the S&P GSCI Total Return Index (-19.27%). Nevertheless, we believe that both geographic and industry diversification are important portfolio construction tools. With that in mind, we examined the costs and benefits of a diversified portfolio relative to a more concentrated portfolio consisting of 60% U.S. stocks and 40% U.S. bonds. We avoided including hedge fund and systematic strategies as part of the analysis and focused solely on increasing the breadth of asset classes as defined by their capital structure positions, geographic location or economic sector. The resulting portfolio is characterized by the pie chart below right: Diversified Portfolio Traditional Portfolio 5% 5% 20% 10% 40% US Large Cap Stocks 5% US Small Cap Stocks 60% Non-US Developed Stocks Emerging Market Stocks 25% 20% Core Fixed Income US Large Cap Stocks Core Fixed Income High Yield REITs 10% Commodities Sources: Bloomberg, Chicago Board Option Exchange, Standard Poor’s, as of 09/30/15. For illustrative purposes only. Past performance does not guarantee future results. Index performance does not reflect the deduction of fees, expenses, or taxes. The indices are unmanaged and are not available for direct investment. © 2015 Salient. All Rights Reserved. | The House View 2
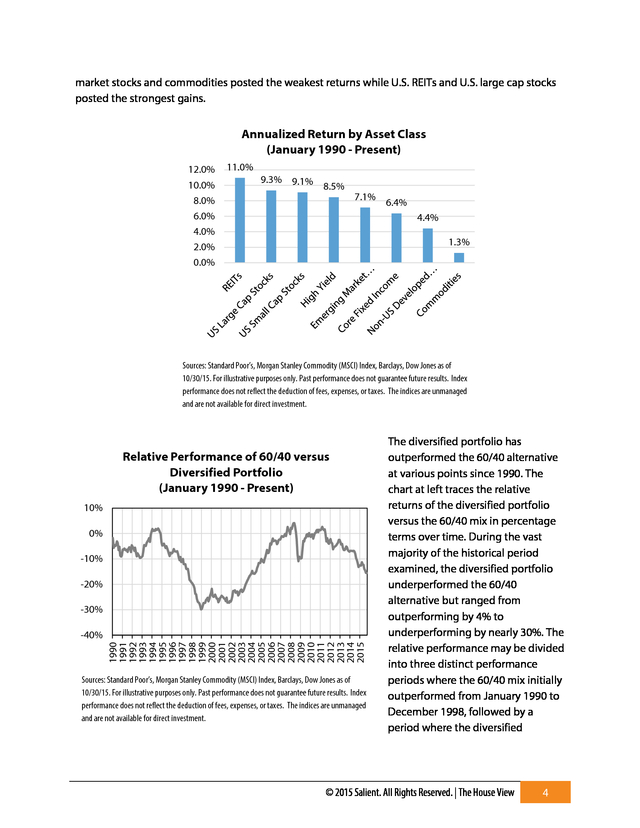
3) Before moving forward with our analysis, we would be quick to point out that both portfolios identified above fail the diversification test from Salient’s perspective based solely on the fact that both portfolios are concentrated in equity-like assets, which tend to be the most volatile component of each portfolio. Furthermore, in our view, a diversified portfolio should adapt with respect to changing economic conditions that often influence the volatility of individual asset classes as well as their correlations to one another. That said, we recognize that many investors will consider the inclusion of foreign equity markets, high yield bonds and real assets—in this case REITs and commodities—to offer a reasonable move toward greater diversification and a potential hedge against long-run inflation. Furthermore, the inclusion of emerging market equities adds meaningful breadth to the equity portion of the portfolio as those economies are less integrated than their developed market counterparts. Traditional versus Diversified Model Portfolio Performance since January 1990 10 707% Percent (%) 8 6 582% 4 2 0 1990 1991 1992 1993 1994 1995 1996 1997 1998 1999 2000 2001 2002 2003 2004 2005 2006 2007 2008 2009 2010 2011 2012 2013 2014 2015 2016 -2 60/40 Diversified Despite the greater breadth of assets included in the diversified portfolio, we observe that it has underperformed the more concentrated portfolio consisting of 60% U.S. large cap stocks and 40% core U.S. fixed income since 1990. The chart to the left shows that since January 1, 1990, the 60/40 portfolio generated a cumulative return of 707% while the diversified alternative generated a cumulative return of 582%. Sources: Standard Poor’s, Morgan Stanley Commodity (MSCI) Index, Barclays, Dow Jones as of 10/30/15.For illustrative purposes only. Past performance does not guarantee future results. Index performance does not reflect the deduction of fees, expenses, or taxes. The indices are unmanaged and are not available for direct investment. The underperformance of the diversified portfolio is largely attributable to the strong outperformance of U.S. stocks during this measurement period. We attribute this outperformance to several factors, including significant productivity gains in the U.S. that resulted in expanding margins; disinflationary trends; and accommodative monetary policy. By contrast, many foreign markets experienced declining growth trends; strained fiscal budgets; over-indebtedness; and restrictive monetary policy. Many emerging market countries also experienced considerably higher levels of inflation. Additionally, the measurement period captured the cumulative return on commodities during the lower end of their performance cycle. The chart on the following page identifies the relative performance of the major asset classes included in this analysis. Notably, non-U.S. developed © 2015 Salient. All Rights Reserved. | The House View 3
4) market stocks and commodities posted the weakest returns while U.S. REITs and U.S. large cap stocks posted the strongest gains. Annualized Return by Asset Class (January 1990 - Present) 12.0% 10.0% 8.0% 6.0% 4.0% 2.0% 0.0% 11.0% 9.3% 9.1% 8.5% 7.1% 6.4% 4.4% 1.3% Sources: Standard Poor’s, Morgan Stanley Commodity (MSCI) Index, Barclays, Dow Jones as of 10/30/15. For illustrative purposes only. Past performance does not guarantee future results. Index performance does not reflect the deduction of fees, expenses, or taxes. The indices are unmanaged and are not available for direct investment. Relative Performance of 60/40 versus Diversified Portfolio (January 1990 - Present) 10% 0% -10% -20% -30% 1990 1991 1992 1993 1994 1995 1996 1997 1998 1999 2000 2001 2002 2003 2004 2005 2006 2007 2008 2009 2010 2011 2012 2013 2014 2015 -40% Sources: Standard Poor’s, Morgan Stanley Commodity (MSCI) Index, Barclays, Dow Jones as of 10/30/15. For illustrative purposes only. Past performance does not guarantee future results. Index performance does not reflect the deduction of fees, expenses, or taxes. The indices are unmanaged and are not available for direct investment. The diversified portfolio has outperformed the 60/40 alternative at various points since 1990. The chart at left traces the relative returns of the diversified portfolio versus the 60/40 mix in percentage terms over time. During the vast majority of the historical period examined, the diversified portfolio underperformed the 60/40 alternative but ranged from outperforming by 4% to underperforming by nearly 30%. The relative performance may be divided into three distinct performance periods where the 60/40 mix initially outperformed from January 1990 to December 1998, followed by a period where the diversified © 2015 Salient. All Rights Reserved. | The House View 4
5) portfolio outperformed from January 1999 through May 2008 and ended with the 60/40 portfolio outperforming again from June 2008 through October 2015. These distinct performance periods Periodic Returns of 60/40 versus are isolated in the chart on the Diversified Portfolios right. During the initial 14.9% 16.0% performance period the diversified 14.0% portfolio underperformed the 60/40 10.7% 12.0% alternative by a 4.2% annualized 8.6% 10.0% rate, the diversified portfolio then 8.0% 6.2% outperformed by 4.3% annually 6.0% 4.3% during the next performance period 3.2% 4.0% and then it underperformed by 3% 2.0% annually during the last 0.0% performance period. These January 1990 January 1999 June 2008 performance cycles ranged in December 1998 May 2008 October 2015 length from approximately seven to nine years. We believe that the key 60/40 Diversified drivers of these performance cycles are: starting valuations, growth Sources: Standard Poor’s, Morgan Stanley Commodity (MSCI) Index, Barclays, Dow Jones as of rate differentials, credit spreads 10/30/15. For illustrative purposes only. Past performance does not guarantee future results. Index and beginning interest rates. In performance does not reflect the deduction of fees, expenses, or taxes. The indices are unmanaged many cases, these drivers have a and are not available for direct investment. tendency to revert back to their long-term mean from one cycle to the next. This dynamic is most clearly seen in valuation measures when a period of exceptional returns for a particular market often corresponds to increases in the prices paid per unit of cash flow as compared to an underperforming market that may see price multiples compress over that same period. As investor enthusiasm for the outperforming market begins to moderate, valuation levels often retreat back toward the levels of the underperforming market. Furthermore, policy intervention from both a fiscal and monetary perspective can influence asset prices and growth rates over shorter periods of time but often lead to imbalances that must be corrected during the next cycle. Conclusion 1. Monetary conditions in the U.S. have been tightening since 2014 as the Federal Reserve formally withdrew from its third round of quantitative easing in the second half of that year. By contrast, the European Central Bank, Bank of Japan and People’s Bank of China have all undertaken significant monetary stimulus measures since 2014. We think that these stimulus packages will continue to result in the inflation of financial assets in those economies. This outlook favors the stock markets of non-U.S. developed countries. 2. U.S. stocks benefited from a declining dollar from 2001 to 2014. Concurrent with the withdrawal of central bank stimulus cited above, the trade-weighted U.S. dollar has been increasing in value since 2014. The strengthening dollar weakens the competitiveness of U.S. exports and reduces profits from foreign operations to U.S. companies. © 2015 Salient. All Rights Reserved. | The House View 5
6) 3. Valuations have tilted in favor of emerging markets, which according to the MSCI Emerging Markets Index have fallen to 12.6x trailing twelve-month earnings. By contrast, the developed world trades at close to 18.5x trailing twelve-month earnings. 1 4. The starting level of interest rates across developed markets are low by historic standards (e.g., 10-year U.S. Treasury at 2.15%, Germany’s 10-year at 0.52% and Japan’s 10-year at 0.30%) while the yield on high yield bonds is relatively high (Barclays Global High Yield Index is at 7.46%) and certain emerging countries like Brazil and Russia have 10-year yields of 15.88% and 10.00%, respectively. 2 5. Commodities have been declining in sympathy with falling levels of inflation, falling global growth and increased energy supply resulting from new drilling technologies. Moving forward we believe that the secular decline in the rate of inflation globally will likely persist for some time as the baby boom generation enters retirement and the world works through a large balance of debt to growth domestic product. This inflation decline will likely be offset by improving growth conditions in East Asia and a reduction in oil supply that is a function of steep decline rates in many shale basins in the U.S. and the cancellation of major onshore and offshore projects. This combination will likely result in the dual impact of lower supply growth rates and increasing demand, which in our opinion will result in upward price pressure. In conclusion, we believe the factors cited above frame a reasonable basis to expect the diversified portfolio to outperform the 60/40 alternative by an annualized rate of 3%-4% over the next six to nine years, which is in line with the historical performance differences during each of the three performance cycles cited herein. DISCLOSURES Investing involves risk, including possible loss of principal. The value of any financial instruments or markets mentioned herein can fall as well as rise. Past performance does not guarantee future results. This material is distributed for informational purposes only and should not be considered as investment advice, a recommendation of any particular security, strategy or investment product, or as an offer or solicitation with respect to the purchase or sale of any investment. Statistics, prices, estimates, forward-looking statements, and other information contained herein have been obtained from sources believed to be reliable, but no guarantee is given as to their accuracy or completeness. All expressions of opinion are subject to change without notice. Limitations of Hypothetical Performance. The hypothetical backtested performance presented is supplemental to the GIPS-compliant presentation included as part of this presentation. The returns presented reflect hypothetical performance an investor would have obtained had it invested in the manner shown and does not represents returns that any investor actually attained. The information presented is based upon the following hypothetical assumptions: [1)The historical transactions costs are reflected by our estimates based on the modern costs of trading the instruments in the strategy. 2) No market events not accounted for in the model would have disrupted the rebalancing of assets throughout the backtest. 3) The computational resources required to conduct the strategy would have been available throughout the history. Certain of the assumptions have been made for modeling purposes and are unlikely to be realized. No 1 2 Source: Bloomberg, MSCI, Standard & Poor’s Source: Bloomberg, Barclays © 2015 Salient. All Rights Reserved. | The House View 6
7) representation or warranty is made as to the reasonableness of the assumptions made or that all assumptions used in achieving the returns have been stated or fully considered. Changes in the assumptions may have a material impact on the hypothetical returns presented. Hypothetical backtested returns have many inherent limitations. Unlike actual performance, it does not represent actual trading. Since trades have not been actually been executed, results may have under- or over-compensated for the impact, if any, of certain market factors, such as lack of liquidity, and may not reflect the impact that certain economic or market factors may have had on the decisionmaking process. Hypothetical backtested performance also is developed with the benefit of hindsight. Other periods selected may have different results, including losses. There can be no assurance that the Adviser will achieve profits or avoid incurring substantial losses. Neither diversification nor asset allocation assures profit or protects against risk. One cannot invest directly in an index. “Alerian MLP Index”, “Alerian MLP Total Return Index”, “AMZ” and “AMZX” are trademarks of Alerian and their use is granted under a license from Alerian. Lee Partridge has earned the right to use the Chartered Financial Analyst designation. CFA Institute marks are trademarks owned by the CFA Institute. DEFINITIONS Alerian MLP Index (AMZ) is a composite of the 50 most prominent energy MLPs that provides investors with a comprehensive benchmark for this emerging asset class. Barclays Global High Yield Index is a multi-currency flagship measure of the global high yield debt market. Barclays Intermediate Government/Credit Bond Index tracks the performance of intermediate term U.S. government and corporate bonds. Bloomberg Commodity Index is a broadly diversified index composed of exchange-traded futures contracts on physical commodities. Chicago Mercantile Exchange is the world's second-largest exchange for futures and options on futures and the largest exchange in the U.S. The Chicago Board Options Exchange Volatility Index reflects a market estimate of future volatility, based on the weighted average of the implied volatilities for a wide range of strikes. 1st & 2nd month expirations are used until 8 days from expiration, then the 2nd and 3rd are used. The Global Industry Classification Standard (GICS) is a standardized classification system for equities developed jointly by Morgan Stanley Capital International (MSCI) and Standard & Poor's. The GICS methodology is used by the MSCI indexes, which include domestic and international stocks, as well as by a large portion of the professional investment management community. S&P GSCI Commodity Index is a composite index of commodity sector returns representing an unleveraged, long-only investment in commodity futures that is broadly diversified across the spectrum of commodities and serves as a measure of commodity performance over time. MSCI Emerging Markets (EM) Index is an index created by Morgan Stanley Capital International (MSCI) that is designed to measure equity market performance in global emerging markets. The Russell 2000 Index measures the performance of the small-cap segment of the U.S. equity universe. It includes approximately 2000 of the smallest securities based on a combination of their market cap and current index membership. The Russell 2000 is constructed to © 2015 Salient. All Rights Reserved. | The House View 7
8) provide a comprehensive and unbiased small-cap barometer and is completely reconstituted annually to ensure larger stocks do not distort the performance and characteristics of the true small-cap opportunity set. S&P 500 Index is an unmanaged, capitalization weighted index comprising publicly traded common stocks issued by companies in various industries. The S&P 500 Index is widely recognized as the leading broad-based measurement of changes in conditions of the U.S. equities market. Tokyo Stock Price Index is an index that measures stock prices on the Tokyo Stock Exchange (TSE). © 2015 Salient. All Rights Reserved. | The House View 8