Severity: Notice
Message: Undefined variable: content_category
Filename: user/transcript.php
Line Number: 106
Severity: Warning
Message: Invalid argument supplied for foreach()
Filename: user/transcript.php
Line Number: 106


1) - - - - - - - - - - - - - - - - - - - - - - - - - - - - - - - - - - - - - - - - - - - - - - - - - - - - - - - ADVISORSHARES TRUST 4800 Montgomery Lane Suite 150 Bethesda, Maryland 20814 www.advisorshares.com 1.877.843.3831 Annual Report June 30, 2015
2)
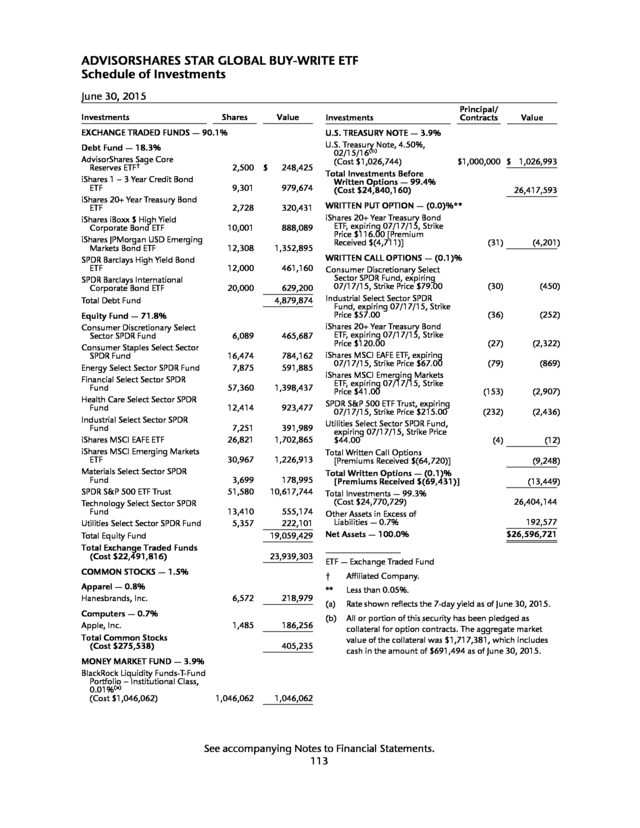
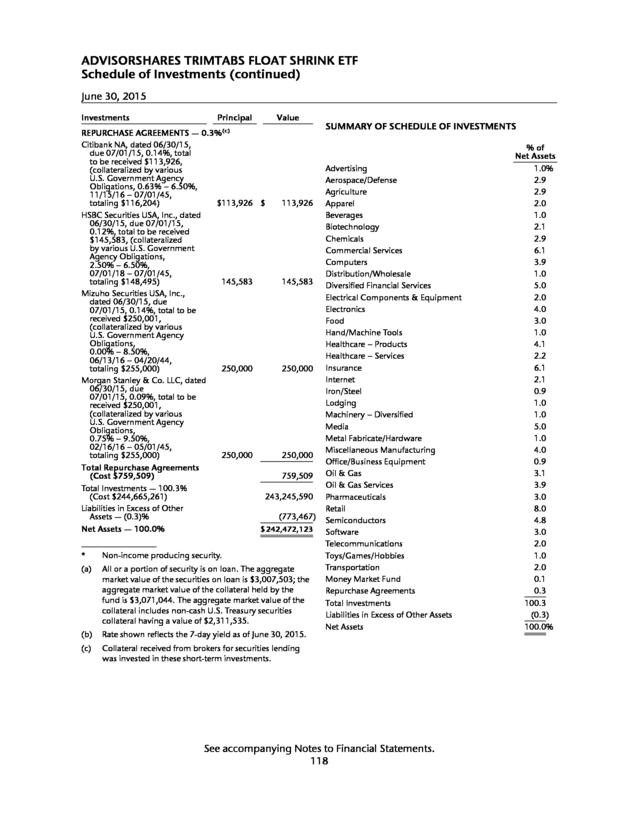
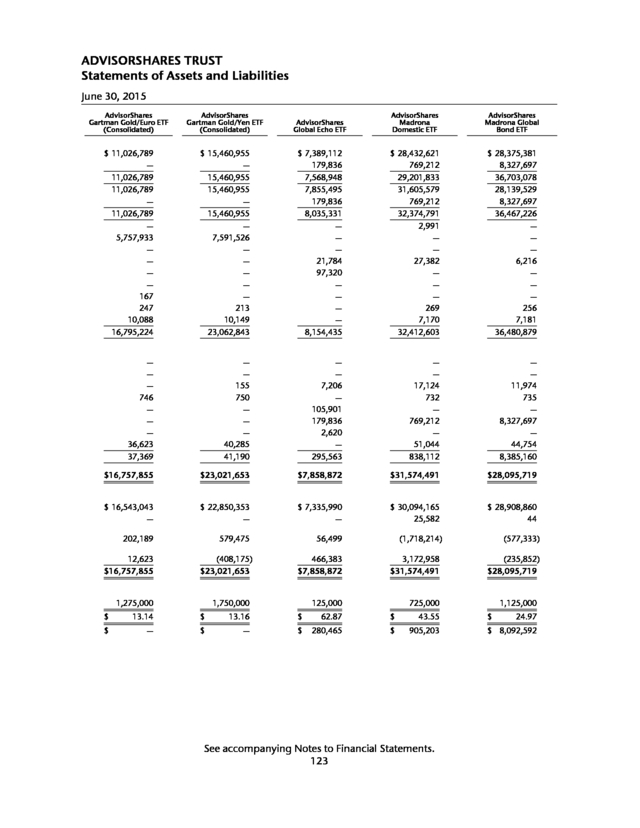
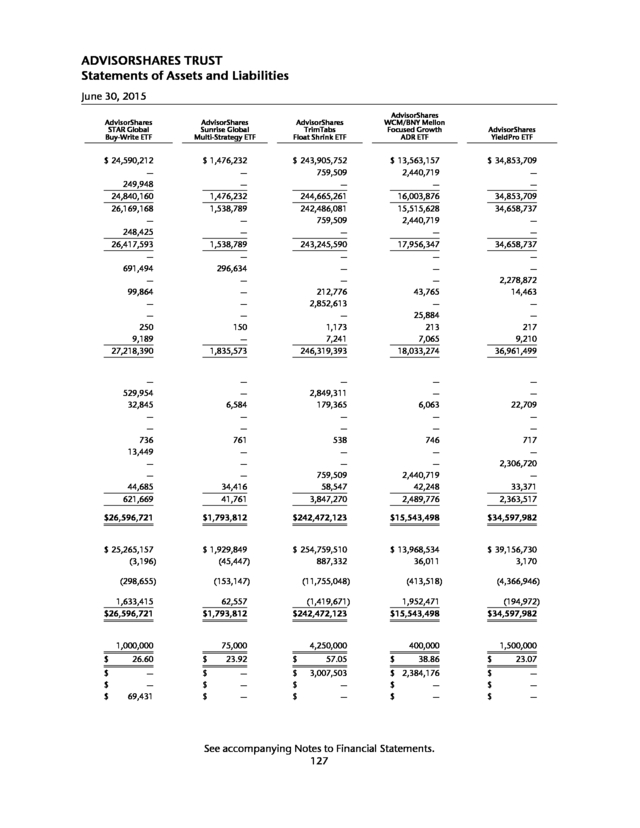
3) TABLE OF CONTENTS Letter from the CEO of AdvisorShares Investments, LLC . . . . . . . . . . . . . . . . . . . . . . . . . . 1 Hypothetical Growth of a $10,000 Investment, Historical Performances . . . . . . . . . . . . . . 4 Shareholder Expense Examples . . . . . . . . . . . . . . . . . . . . . . . . . . . . . . . . . . . . . . . . . . . . 50 Schedules of Investments AdvisorShares Accuvest Global Long Short ETF (AGLS) . . . . . . . . . . . . . . . . . . . . . . . . . 53 AdvisorShares Athena High Dividend ETF (DIVI) . . . . . . . . . . . . . . . . . . . . . . . . . . . . . . 54 AdvisorShares EquityPro ETF (EPRO) . . . . . . . . . . . . . . . . . . . . . . . . . . . . . . . . . . . . . . 56 AdvisorShares Gartman Gold/Euro ETF (GEUR) . . . . . . . . . . . . . . . . . . . . . . . . . . . . . . . 57 AdvisorShares Gartman Gold/Yen ETF (GYEN) . . . . . . . . . . . . . . . . . . . . . . . . . . . . . . . 58 AdvisorShares Global Echo ETF (GIVE) . . . . . . . . . . . . . . . . . . . . . . . . . . . . . . . . . . . . . 59 AdvisorShares Madrona Domestic ETF (FWDD) . . . . . . . . . . . . . . . . . . . . . . . . . . . . . . . 62 AdvisorShares Madrona Global Bond ETF (FWDB) . . . . . . . . . . . . . . . . . . . . . . . . . . . . . 70 AdvisorShares Madrona International ETF (FWDI) . . . . . . . . . . . . . . . . . . . . . . . . . . . . . 72 AdvisorShares Meidell Tactical Advantage ETF (MATH) . . . . . . . . . . . . . . . . . . . . . . . . . 78 AdvisorShares Morgan Creek Global Tactical ETF (GTAA) . . . . . . . . . . . . . . . . . . . . . . . . 79 AdvisorShares Newfleet Multi-Sector Income ETF (MINC) . . . . . . . . . . . . . . . . . . . . . . . 81 AdvisorShares Pacific Asset Enhanced Floating Rate ETF (FLRT) . . . . . . . . . . . . . . . . . . . . 95 AdvisorShares Peritus High Yield ETF (HYLD) . . . . . . . . . . . . . . . . . . . . . . . . . . . . . . . . . 98 AdvisorShares Pring Turner Business Cycle ETF (DBIZ) . . . . . . . . . . . . . . . . . . . . . . . . . . 102 AdvisorShares QAM Equity Hedge ETF (QEH) . . . . . . . . . . . . . . . . . . . . . . . . . . . . . . . . 104 AdvisorShares Ranger Equity Bear ETF (HDGE) . . . . . . . . . . . . . . . . . . . . . . . . . . . . . . . 106 AdvisorShares Sage Core Reserves ETF (HOLD) . . . . . . . . . . . . . . . . . . . . . . . . . . . . . . . 108 AdvisorShares STAR Global Buy-Write ETF (VEGA) . . . . . . . . . . . . . . . . . . . . . . . . . . . . . 113 AdvisorShares Sunrise Global Multi-Strategy ETF (MULT) . . . . . . . . . . . . . . . . . . . . . . . 115 AdvisorShares TrimTabs Float Shrink ETF (TTFS) . . . . . . . . . . . . . . . . . . . . . . . . . . . . . . 116 AdvisorShares WCM/BNY Mellon Focused Growth ADR ETF (AADR) . . . . . . . . . . . . . . . 119 AdvisorShares YieldPro ETF (YPRO) . . . . . . . . . . . . . . . . . . . . . . . . . . . . . . . . . . . . . . . 121 Statements of Assets and Liabilities . . . . . . . . . . . . . . . . . . . . . . . . . . . . . . . . . . . . . . . . . 122 Statements of Operations . . . . . . . . . . . . . . . . . . . . . . . . . . . . . . . . . . . . . . . . . . . . . . . . 128 Statements of Changes in Net Assets . . . . . . . . . . . . . . . . . . . . . . . . . . . . . . . . . . . . . . . . 134 Statements of Cash Flows . . . . . . . . . . . . . . . . . . . . . . . . . . . . . . . . . . . . . . . . . . . . . . . . 143 Financial Highlights . . . . . . . . . . . . . . . . . . . . . . . . . . . . . . . . . . . . . . . . . . . . . . . . . . . . 144 Notes to Financial Statements . . . . . . . . . . . . . . . . . . . . . . . . . . . . . . . . . . . . . . . . . . . . . 159 Report of Independent Registered Public Accounting Firm . . . . . . . . . . . . . . . . . . . . . . . . 187 Board of Trustees and Officers (Unaudited) . . . . . . . . . . . . . . . . . . . . . . . . . . . . . . . . . . . 188 Board Review of Investment Advisory and Sub-Advisory Agreements . . . . . . . . . . . . . . . . 190 Supplemental Information . . . . . . . . . . . . . . . . . . . . . . . . . . . . . . . . . . . . . . . . . . . . . . . 194
4) (This page intentionally left blank.)
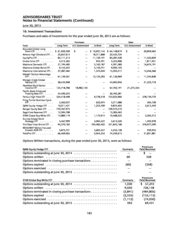
5) ADVISORSHARES TRUST Letter from the CEO of AdvisorShares Investments, LLC June 30, 2015 The year ending June 30th, 2015 was an exciting year for growth in the actively managed ETF market place. The number of funds grew by 44% to 129 and assets increased by 23% to $20.195 billion (See Exhibit 1 below.) Additionally there were 13 new fund sponsors who entered the market over the last 12 months. AcÆŸve ETF Market by Products and Total Assets Number of AcÆŸve ETFs Total Assets (Millions) $20,195,265,787 $30,000 100 Millions $20,000 80 $15,000 60 $10,000 40 $5,000 20 $0 Number of Active ETFs 120 $25,000 Jun-15 May-15 Apr-15 Mar-15 Feb-15 Jan-15 Dec-14 Nov-14 Oct-14 Sep-14 Aug-14 Jul-14 Jun-14 0 Exhibit 1 As of June 30, 2015 I Source: AdvisorShares As you can see from Exhibit 2, AdvisorShares offers investors the largest number of actively managed ETFs in the market, with 23 ETFs trading today on both the NYSE Arca and NASDAQ exchanges. An increasingly complex investing environment has created the need for investors to utilize the potential benefits that active ETFs provide as a part of their overall asset allocation. We actively seek out investment managers who offer interesting active strategies so that we can provide you with a wide variety of ETFs to choose from, to help you meet and exceed your investment goals. 1
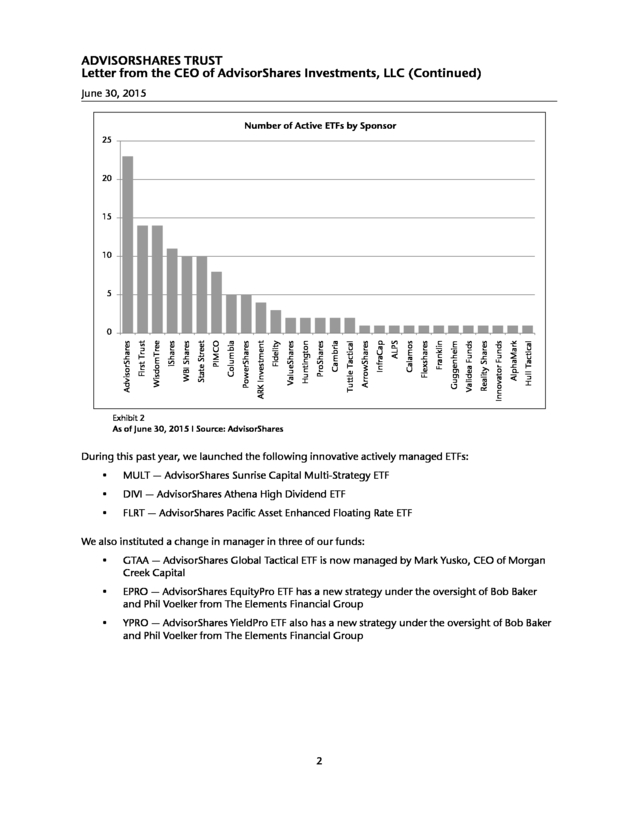
6) ADVISORSHARES TRUST Letter from the CEO of AdvisorShares Investments, LLC (Continued) June 30, 2015 Number of Active ETFs by Sponsor 25 20 15 10 5 Hull Tactical AlphaMark Reality Shares Innovator Funds Guggenheim Validea Funds Franklin Flexshares ALPS Calamos InfraCap ArrowShares Tuttle Tactical Cambria ProShares Huntington ValueShares Fidelity PowerShares ARK Investment PIMCO Columbia WBI Shares State Street iShares WisdomTree First Trust AdvisorShares 0 Exhibit 2 As of June 30, 2015 I Source: AdvisorShares During this past year, we launched the following innovative actively managed ETFs: • MULT — AdvisorShares Sunrise Capital Multi-Strategy ETF • DIVI — AdvisorShares Athena High Dividend ETF • FLRT — AdvisorShares Pacific Asset Enhanced Floating Rate ETF We also instituted a change in manager in three of our funds: • GTAA — AdvisorShares Global Tactical ETF is now managed by Mark Yusko, CEO of Morgan Creek Capital • EPRO — AdvisorShares EquityPro ETF has a new strategy under the oversight of Bob Baker and Phil Voelker from The Elements Financial Group • YPRO — AdvisorShares YieldPro ETF also has a new strategy under the oversight of Bob Baker and Phil Voelker from The Elements Financial Group 2
7) ADVISORSHARES TRUST Letter from the CEO of AdvisorShares Investments, LLC (Continued) June 30, 2015 We look forward to continuing to offer you new innovative managers and strategies in the market place in the coming year, and will maintain our transparency to you through our regular communications, so you will know what our managers are doing and why with the assets you have entrusted to them. We appreciate the continued trust and confidence that you, our shareholders, have given to us. Best Regards, Noah Hamman CEO, AdvisorShares Investments An investment in the Funds is subject to risk, including the possible loss of principal amount invested. ADRs are subject to the risk of change in political or economic conditions and exchange rates in foreign countries. Certain funds may participate in leveraged transactions to include selling securities short which creates the risk of magnified capital losses. Under certain market conditions, short sales can increase the volatility and decrease the liquidity of certain securities or positions, and may lower the Fund’s return or result in a loss. There is no guarantee that the individual Funds’ will achieve the stated investment objectives. The risks associated with each Fund include the risks associated with the underlying ETFs, which can result in higher volatility, and are detailed in each Fund’s prospectus and on each Fund’s webpage. The views in this report were those of the Fund’s CEO as of June 30, 2015 and may not reflect his views on the date that this report is first published or anytime thereafter. These views are intended to assist shareholders in understanding their investments and do not constitute investment advice. 3
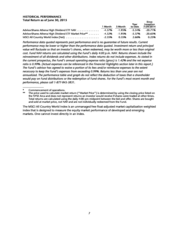
8) ADVISORSHARES TRUST AdvisorShares Accuvest Global Long Short ETF (AGLS) The one year ending June 30, 2015 was characterized by a wide range of performance for world equities. The MSCI World Index (ACWI) was up 1.43% for the 12 month period. The largest weight in the index, the US, was up over 6.9%., which masked the underlying weakness in world markets. The average country in the AGLS universe was down over -7.5%. China and Hong Kong were the only two countries up by double digits, up 24.6% and 12.4% respectively. Nine countries were down over 15%, including Austria, Brazil, Canada, Chile, Malaysia, Norway, Russia, Spain and Turkey. Performance for the AdvisorShares Accuvest Global Long Short ETF (NYSE Arca: AGLS) was below that of the ACWI benchmark, returning -4.2% over the period. Underperformance was primarily driven by 3 main factors: 1) A structural underweight to the US, which was again one of the best performing countries in the world, 2) A consistent net long exposure of 40 − 45% to a broad universe of countries, 3) Missing the majority of a fierce market rebound in February of 2015. In fact, the entire underperformance of the fund can be attributed to the return differential from that month. During the year, there were 6 periods in which the benchmark lost over 1%. AGLS outperformed the benchmark in 5 of those months, and was either flat or positive in 4 of those months. We feel that AGLS is well positioned for a market where the US is not a performance leader, and a market that is characterized by higher volatility and larger downside moves. The majority of short positions in AGLS are total return swaps. These aggregate positions range in size from 50% to 75% of the net value of the fund. We use these swaps as a way to get exposure in positions that are hard to borrow, or as a way to decrease our overall cost of shorting a particular country index. These positions are entirely for hedging purposes. A long position is the purchase of an investment with the expectation that it will rise in value. A short position is the sale of a borrowed investment with the expectation that it will decline in value. HYPOTHETICAL GROWTH OF $10,000 INVESTMENT For the period July 9, 2010* to June 30, 2015 $19,000 $17,754 $17,000 $15,000 $13,000 $11,000 $9,000 $7,000 7/8/2010 $8,062 $8,061 6/30/2011 6/30/2012 6/30/2013 6/30/2014 $8,062 AdvisorShares Accuvest Global Long Short ETF NAV $8,061 AdvisorShares Accuvest Global Long Short ETF Market Price $17,754 MSCI World Index 4 6/30/2015
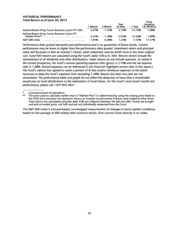
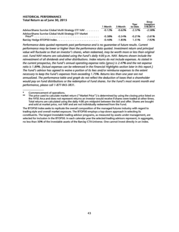
9) HISTORICAL PERFORMANCE Total Return as of June 30, 2015 Year to Date 1 Month AdvisorShares Accuvest Global Long Short ETF NAV . . . . . . . . . . . . . . . . AdvisorShares Accuvest Global Long Short ETF Market Price** . . . . . . . . . MSCI World Index (Net) . . . . . . . . . . . 1 Year 3 Year Since Inception 7/9/2010 3 Month -1.44% -1.29% -0.90% -4.20% -2.17% -4.24% -1.34% -2.33% -1.34% 0.31% -0.65% 2.63% -4.20% 1.43% -2.20% 14.27% -4.24% 12.22% Performance data quoted represents past performance and is no guarantee of future results. Current performance may be lower or higher than the performance data quoted. Investment return and principal value will fluctuate so that an investor’s shares, when redeemed, may be worth more or less than original cost. Fund NAV returns are calculated using the Fund’s daily 4:00 p.m. NAV. Returns shown include the reinvestment of all dividends and other distributions. Index returns do not include expenses. As stated in the current prospectus, the Fund’s annual operating expense ratio (gross) is 2.13% and the net expense ratio is 1.97%. (Actual expenses can be referenced in the Financial Highlights section later in this report.) The Fund’s advisor has agreed to waive a portion of its fees and/or reimburse expenses to the extent necessary to keep the Fund’s expenses from exceeding 1.50%. Returns less than one year are not annualized. The performance table and graph do not reflect the deduction of taxes that a shareholder would pay on Fund distributions or the redemption of Fund shares. For the Fund’s most recent month end performance, please call 1-877-843-3831. * ** Commencement of operations. The price used to calculate market return (‘‘Market Price’’) is determined by using the closing price listed on the NYSE Arca and does not represent returns an investor would receive if shares were traded at other times. Total returns are calculated using the daily 4:00 pm midpoint between the bid and offer. Shares are bought and sold at market price, not NAV and are not individually redeemed from the Fund. The MSCI World Index is a free float-adjusted market capitalization weighted index that is designed to measure the equity market performance of developed markets. One cannot invest directly in an index. 5
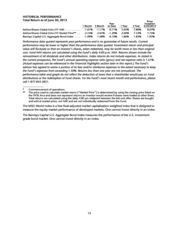
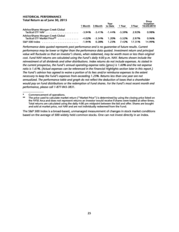
10) ADVISORSHARES TRUST AdvisorShares Athena High Dividend ETF (DIVI) The AdvisorShares Athena High Dividend ETF (NYSE Arca: DIVI) is built on three drivers that have been shown to deliver strong long term equity performance: 1. Higher yielding stocks on average generate higher total returns both in the US and internationally. Dividends represent a strong commitment by company management to its shareholders and the higher the yield the stronger this commitment. 2. But even with this powerful market discipline, some high dividend yield (DY) companies over promise and see their stock prices drop when they are unable to sustain dividends. In order to reduce this collateral damage, a quality screen based on Athena’s extensive mutual fund holdings database is used to help identify the best stock ideas of the best managers. 3. In each sector, International stocks often offer higher dividend yields than do similar US stocks. For this reason, we launched DIVI as a global portfolio rather than as US only. Over shorter time periods results can be quite different, as was the case during DIVI’s first year: • The biggest negative was a dramatic drop in oil prices during the second half of 2014 as DIVI was launched. Since DIVI is more exposed to energy than other high dividend portfolios, it suffered a greater drawdown. This was evidenced by five underperforming months in a row from September 2014 through January 2015, corresponding to the drop in oil prices from near $100 bbl. to $50 bbl. Since then, prices have stabilized. • But just when oil prices became less of an issue, high DY stocks began to dramatically underperform. High DY stocks were the darling of 2014, but are the goats of 2015. For some perspective, the top DY decile S&P 500 stocks are underperforming the bottom decile by 10% so far in 2015! Since DIVI’s DY is higher than most funds, its performance has suffered more than others in 2015. Dividend Yield is a financial ratio that shows how much a company pays out in dividends each year relative to its share price. HYPOTHETICAL GROWTH OF $10,000 INVESTMENT For the period July 29, 2014* to June 30, 2015 $11,000 $10,025 $10,000 $9,000 $7,935 $7,929 $8,000 $7,000 7/29/2014 12/31/2014 $7,929 AdvisorShares Athena High Dividend ETF NAV $7,935 AdvisorShares Athena High Dividend ETF Market Price $10,025 MSCI All Country World Index 6 6/30/2015
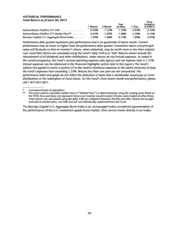
11) HISTORICAL PERFORMANCE Total Return as of June 30, 2015 1 Month AdvisorShares Athena High Dividend ETF NAV . . . . . . . . . . . . . AdvisorShares Athena High Dividend ETF Market Price** . . . . . . MSCI All Country World Index (Net) . . . . . . . . . . . . . . . . . . . 3 Month -4.37% -4.32% -2.35% -1.95% -1.95% 0.35% Year to Date -5.34% -5.37% 2.66% Since Inception 7/29/2014 -20.71% -20.65% 0.25% Performance data quoted represents past performance and is no guarantee of future results. Current performance may be lower or higher than the performance data quoted. Investment return and principal value will fluctuate so that an investor’s shares, when redeemed, may be worth more or less than original cost. Fund NAV returns are calculated using the Fund’s daily 4:00 p.m. NAV. Returns shown include the reinvestment of all dividends and other distributions. Index returns do not include expenses. As stated in the current prospectus, the Fund’s annual operating expense ratio (gross) is 1.42% and the net expense ratio is 0.99%. (Actual expenses can be referenced in the Financial Highlights section later in this report.) The Fund’s advisor has agreed to waive a portion of its fees and/or reimburse expenses to the extent necessary to keep the Fund’s expenses from exceeding 0.99%. Returns less than one year are not annualized. The performance table and graph do not reflect the deduction of taxes that a shareholder would pay on Fund distributions or the redemption of Fund shares. For the Fund’s most recent month end performance, please call 1-877-843-3831. * ** Commencement of operations. The price used to calculate market return (‘‘Market Price’’) is determined by using the closing price listed on the NYSE Arca and does not represent returns an investor would receive if shares were traded at other times. Total returns are calculated using the daily 4:00 pm midpoint between the bid and offer. Shares are bought and sold at market price, not NAV and are not individually redeemed from the Fund. The MSCI All Country World Index is an unmanaged free float-adjusted market capitalization weighted index that is designed to measure the equity market performance of developed and emerging markets. One cannot invest directly in an index. 7
12) ADVISORSHARES TRUST AdvisorShares EquityPro ETF (EPRO) The AdvisorShares EquityPro ETF (NYSE Arca: EPRO) returned -1.89% on a Market Price basis, and -2.01% on an NAV basis for the twelve months ended June 30, 2015. While this compares to 7.42% return for the S&P 500 Index, in light of EPRO’s global posture, a comparison to the MSCI World Index, which returned to 1.43% for the same time period, provides an additional perspective. In October 2014, EPRO adopted a partially defensive position, with only 20% exposure to equities, due in large part to the S&P 500 Index trading under its 200-day moving average. This position was short-lived, however, as the market quickly rebounded, and proceeded to post new highs, including during the month of May 2015. On May 18, 2015, the Sub-Advisor appointed new portfolio managers for EPRO. We implemented several changes to the EPRO portfolio, including: international equity exposure which was decreased from 40% to 21%, due to less attractive relative valuation vs. U.S. equities and the recent run-up that had taken place in foreign stock markets. The Information Technology sector exposure was increased from 9% to 22%; Financial sector exposure was decreased from 18% to 8%; and the Health Care sector exposure was increased from 12% to 19%. In addition, sector allocations were adjusted in light of our revised approach to sector valuation discipline. As of June 30, 2015, EPRO’s portfolio was over-weighted in Consumer Staples, Health Care and Information Technology. In our opinion, these are the most attractively valued domestic equity sectors, while Financial and Utility companies are more over-valued relative to historical norms, and under-weighted relative to their S&P 500 weightings. Although risks continued to exist in the securities markets, EPRO remained 98% invested in equities, as of June 30, 2015. Given the structured nature of our investment process, it is significant to note that the S&P 500 Index had continued to trade above its 200-day moving average by approximately 1 − 4% during June 2015, and no part of the U.S. Treasury yield curve was inverted through June 30, 2015. As a result, as of that date, EPRO remained virtually fully exposed to equities going into the second half of 2015. Nonetheless, the investment process is structured with the flexibility to reduce risk in severe down markets, in the event that there is a change in the factors noted in this paragraph. The MSCI World Index is an unmanaged free float-adjusted market capitalization weighted index that is designed to measure the equity market performance of developed markets. The 200-day moving average is an indicator used by traders to determine a stock’s closing average over a period of 200 consecutive days. Most traders use this technical indicator to determine trends in the market. A Yield Curve is a line that plots the interest rates, at a set point in time, of bonds having equal credit quality, but differing maturity dates. The most frequently reported yield curve compares the three month, two-year, five-year and 30-year U.S. Treasury debt. This yield curve is used as a benchmark for other debt in the market, such as mortgage rates or bank lending rates. The curve is also used to predict changes in economic output and growth. 8
13) HYPOTHETICAL GROWTH OF $10,000 INVESTMENT For the period July 10, 2012* to June 30, 2015 $18,000 $17,000 $16,381 $16,000 $15,121 $15,000 $14,000 $13,000 $12,821 $12,805 $12,000 $11,000 $10,000 $9,000 7/10/2012 12/31/2012 6/30/2013 12/31/2013 6/30/2014 12/31/2014 6/30/2015 $12,805 AdvisorShares EquityPro ETF NAV $12,821 AdvisorShares EquityPro ETF Market Price $16,381 S&P 500 Index $15,121 MSCI World Index (Net) HISTORICAL PERFORMANCE Total Return as of June 30, 2015 1 Month AdvisorShares EquityPro ETF NAV . . . . . . . . . . . . . AdvisorShares EquityPro ETF Market Price** . . . . . . MSCI World Index (Net) . . . . . . . . . . . . . . . . . . . 3 Month -2.57% -2.57% -2.33% 0.03% 0.00% 0.31% Year to Date 2.00% 4.67% 2.63% 1 Year -2.01% -1.89% 1.43% Since Inception 7/10/2012 8.67% 8.72% 14.93% Performance data quoted represents past performance and is no guarantee of future results. Current performance may be lower or higher than the performance data quoted. Investment return and principal value will fluctuate so that an investor’s shares, when redeemed, may be worth more or less than original cost. Fund NAV returns are calculated using the Fund’s daily 4:00 p.m. NAV. Returns shown include the reinvestment of all dividends and other distributions. Index returns do not include expenses. As stated in the current prospectus, the Fund’s annual operating expense ratio (gross) is 2.38% and the net expense ratio is 1.71%. (Actual expenses can be referenced in the Financial Highlights section later in this report.) The Fund’s advisor has agreed to waive a portion of its fees and/or reimburse expenses to the extent necessary to keep the Fund’s expenses from exceeding 1.25%. Returns less than one year are not annualized. The performance table and graph do not reflect the deduction of taxes that a shareholder would pay on Fund distributions or the redemption of Fund shares. For the Fund’s most recent month end performance, please call 1-877-843-3831. * ** Commencement of operations. The price used to calculate market return (‘‘Market Price’’) is determined by using the closing price listed on the NYSE Arca and does not represent returns an investor would receive if shares were traded at other times. Total returns are calculated using the daily 4:00 pm midpoint between the bid and offer. Shares are bought and sold at market price, not NAV and are not individually redeemed from the Fund. The S&P 500 Index is a broad-based, unmanaged measurement of changes in stock market conditions based on the average of 500 widely held common stocks. One can not invest directly in an index. 9
14) ADVISORSHARES TRUST AdvisorShares Gartman Gold/Euro ETF (GEUR) The spot price of gold (funded in US dollars) lagged most major asset classes during the period between 7/1/14 to 6/30/15. However, during this period, gold funded in the Euro currency performed quite well, increasing 8.4%, and outperformed the spot price of gold which was down 11.7%. The AdvisorShares Gartman Gold/Euro ETF’s (NYSE Arca: GEUR) portfolio strategy to provide investors this exposure was executed through the use of exchange traded futures contracts. These derivative contracts provide the most direct and liquid exposure with minimal transaction costs. The most significant factor affecting gold’s price performance has been the anticipated change in the United States’ monetary policy. The announcement of the end of quantitative easing and the anticipation of interest rate increases has caused the US dollar to get stronger. The softness in gold prices was largely due to its inverse relationship with the US dollar. The economic situation in Euroland was much different with the ECB announcing the start of its own quantitative easing program. This has caused the Euro to depreciate thereby helping GEUR outperform the spot price of gold. A Gold Future is an agreement to buy and sell quantities of gold on a particular date in the future at a fixed price. HYPOTHETICAL GROWTH OF $10,000 INVESTMENT For the period February 11, 2014* to June 30, 2015 $12,500 $12,000 $11,500 $10,917 $10,881 $11,000 $10,500 $10,000 $9,500 $9,000 2/11/2014 $9,102 6/30/2014 12/31/2014 $10,917 AdvisorShares Gartman Gold Euro NAV $10,881 AdvisorShares Gartman Gold Euro Market Price $9,102 Spot Gold - London Bullion Market Association 10 6/30/2015
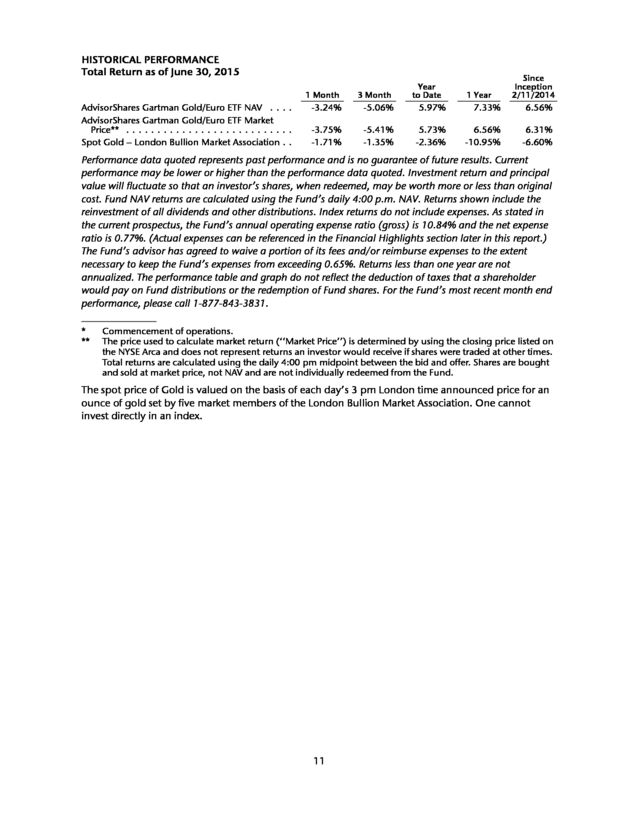
15) HISTORICAL PERFORMANCE Total Return as of June 30, 2015 Year to Date 1 Month AdvisorShares Gartman Gold/Euro ETF NAV . . . . AdvisorShares Gartman Gold/Euro ETF Market Price** . . . . . . . . . . . . . . . . . . . . . . . . . . . Spot Gold − London Bullion Market Association . . 1 Year Since Inception 2/11/2014 3 Month -3.24% -5.06% 5.97% 7.33% 6.56% -3.75% -1.71% -5.41% -1.35% 5.73% -2.36% 6.56% -10.95% 6.31% -6.60% Performance data quoted represents past performance and is no guarantee of future results. Current performance may be lower or higher than the performance data quoted. Investment return and principal value will fluctuate so that an investor’s shares, when redeemed, may be worth more or less than original cost. Fund NAV returns are calculated using the Fund’s daily 4:00 p.m. NAV. Returns shown include the reinvestment of all dividends and other distributions. Index returns do not include expenses. As stated in the current prospectus, the Fund’s annual operating expense ratio (gross) is 10.84% and the net expense ratio is 0.77%. (Actual expenses can be referenced in the Financial Highlights section later in this report.) The Fund’s advisor has agreed to waive a portion of its fees and/or reimburse expenses to the extent necessary to keep the Fund’s expenses from exceeding 0.65%. Returns less than one year are not annualized. The performance table and graph do not reflect the deduction of taxes that a shareholder would pay on Fund distributions or the redemption of Fund shares. For the Fund’s most recent month end performance, please call 1-877-843-3831. * ** Commencement of operations. The price used to calculate market return (‘‘Market Price’’) is determined by using the closing price listed on the NYSE Arca and does not represent returns an investor would receive if shares were traded at other times. Total returns are calculated using the daily 4:00 pm midpoint between the bid and offer. Shares are bought and sold at market price, not NAV and are not individually redeemed from the Fund. The spot price of Gold is valued on the basis of each day’s 3 pm London time announced price for an ounce of gold set by five market members of the London Bullion Market Association. One cannot invest directly in an index. 11
16) ADVISORSHARES TRUST AdvisorShares Gartman Gold/Yen ETF (GYEN) The spot price of gold (funded in US dollars) lagged most major asset classes during the period between 7/1/14 to 6/30/15. However, during this period, gold funded in Japanese Yen currency performed quite well, increasing 6.2% and outperformed the spot price of gold, which was down 11.7%. The AdvisorShares Gartman Gold/Yen ETF’s (NYSE Arca: GYEN) portfolio strategy to provide investors this exposure was executed through the use of exchange traded futures contracts. These derivative contracts provide the most direct and liquid exposure with minimal transaction costs. The most significant factor affecting gold’s price performance has been the anticipated change in the United States’ monetary policy. The announcement of the end of quantitative easing and the anticipation of interest rate increases has caused the US dollar to get stronger. The softness in gold prices was largely due to its inverse relationship with the US dollar. The economic situation in Japan was much different with Japan’s economy struggling to come out of its two decade recession. Japan had put forth a comprehensive plan with monetary and fiscal stimulus to finally get Japan on economic growth. This has caused the Yen to depreciate thereby helping GYEN outperform the spot price of gold. A Gold Future is an agreement to buy and sell quantities of gold on a particular date in the future at a fixed price. HYPOTHETICAL GROWTH OF $10,000 INVESTMENT For the period February 11, 2014* to June 30, 2015 $12,500 $12,000 $11,500 $11,000 $10,743 $10,722 $10,500 $10,000 $9,500 $9,000 2/11/2014 $9,102 6/30/2014 12/31/2014 $10,722 AdvisorShares Gartman Gold Yen NAV $10,743 AdvisorShares Gartman Gold Yen Market Price $9,102 Spot Gold - London Bullion Market Association 12 6/30/2015
17) HISTORICAL PERFORMANCE Total Return as of June 30, 2015 Year to Date 1 Month AdvisorShares Gartman Gold/Yen ETF NAV . . . . . AdvisorShares Gartman Gold/Yen ETF Market Price** . . . . . . . . . . . . . . . . . . . . . . . . . . . Spot Gold − London Bullion Market Association . . 1 Year Since Inception 2/11/2014 3 Month -2.95% 0.92% 0.61% 6.06% 5.18% -3.09% -1.71% 1.15% -1.35% 0.46% -2.36% 5.45% -10.95% 5.33% -6.60% Performance data quoted represents past performance and is no guarantee of future results. Current performance may be lower or higher than the performance data quoted. Investment return and principal value will fluctuate so that an investor’s shares, when redeemed, may be worth more or less than original cost. Fund NAV returns are calculated using the Fund’s daily 4:00 p.m. NAV. Returns shown include the reinvestment of all dividends and other distributions. Index returns do not include expenses. As stated in the current prospectus, the Fund’s annual operating expense ratio (gross) is 4.89% and the net expense ratio is 0.80%. (Actual expenses can be referenced in the Financial Highlights section later in this report.) The Fund’s advisor has agreed to waive a portion of its fees and/or reimburse expenses to the extent necessary to keep the Fund’s expenses from exceeding 0.65%. Returns less than one year are not annualized. The performance table and graph do not reflect the deduction of taxes that a shareholder would pay on Fund distributions or the redemption of Fund shares. For the Fund’s most recent month end performance, please call 1-877-843-3831. * ** Commencement of operations. The price used to calculate market return (‘‘Market Price’’) is determined by using the closing price listed on the NYSE Arca and does not represent returns an investor would receive if shares were traded at other times. Total returns are calculated using the daily 4:00 pm midpoint between the bid and offer. Shares are bought and sold at market price, not NAV and are not individually redeemed from the Fund. The spot price of Gold is valued on the basis of each day’s 3 pm London time announced price for an ounce of gold set by five market members of the London Bullion Market Association. One cannot invest directly in an index. 13
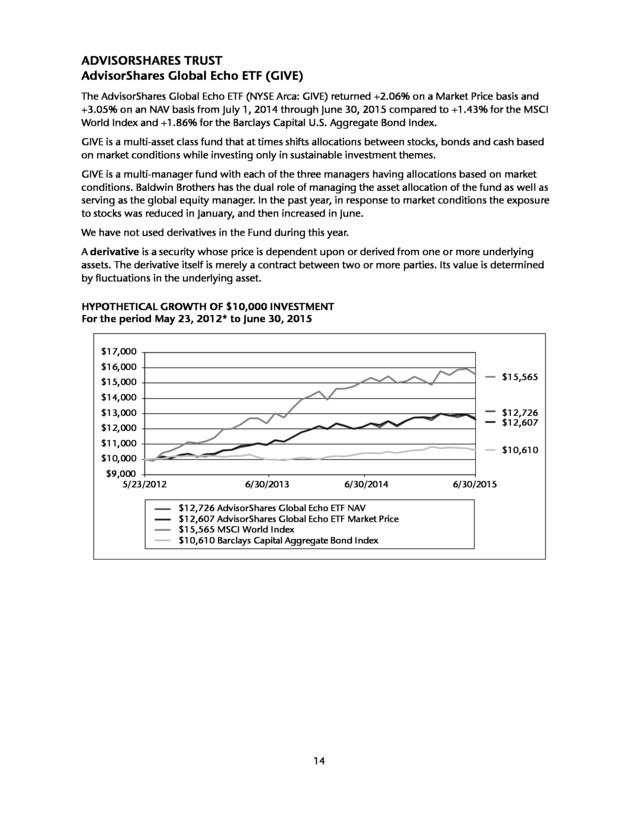
18) ADVISORSHARES TRUST AdvisorShares Global Echo ETF (GIVE) The AdvisorShares Global Echo ETF (NYSE Arca: GIVE) returned +2.06% on a Market Price basis and +3.05% on an NAV basis from July 1, 2014 through June 30, 2015 compared to +1.43% for the MSCI World Index and +1.86% for the Barclays Capital U.S. Aggregate Bond Index. GIVE is a multi-asset class fund that at times shifts allocations between stocks, bonds and cash based on market conditions while investing only in sustainable investment themes. GIVE is a multi-manager fund with each of the three managers having allocations based on market conditions. Baldwin Brothers has the dual role of managing the asset allocation of the fund as well as serving as the global equity manager. In the past year, in response to market conditions the exposure to stocks was reduced in January, and then increased in June. We have not used derivatives in the Fund during this year. A derivative is a security whose price is dependent upon or derived from one or more underlying assets. The derivative itself is merely a contract between two or more parties. Its value is determined by fluctuations in the underlying asset. HYPOTHETICAL GROWTH OF $10,000 INVESTMENT For the period May 23, 2012* to June 30, 2015 $17,000 $16,000 $15,565 $15,000 $14,000 $13,000 $12,726 $12,607 $12,000 $11,000 $10,610 $10,000 $9,000 5/23/2012 6/30/2013 6/30/2014 $12,726 AdvisorShares Global Echo ETF NAV $12,607 AdvisorShares Global Echo ETF Market Price $15,565 MSCI World Index $10,610 Barclays Capital Aggregate Bond Index 14 6/30/2015
19) HISTORICAL PERFORMANCE Total Return as of June 30, 2015 1 Month AdvisorShares Global Echo ETF NAV . . . . . . . . . AdvisorShares Global Echo ETF Market Price** . . Barclays Capital U.S. Aggregate Bond Index . . . 3 Month -1.61% -2.43% -1.09% -1.11% -2.04% -1.68% Year to Date -0.11% -1.20% -0.10% 1 Year 3.05% 2.06% 1.86% 3 Year 7.80% 7.32% 1.83% Since Inception 5/23/2012 8.07% 7.75% 1.93% Performance data quoted represents past performance and is no guarantee of future results. Current performance may be lower or higher than the performance data quoted. Investment return and principal value will fluctuate so that an investor’s shares, when redeemed, may be worth more or less than original cost. Fund NAV returns are calculated using the Fund’s daily 4:00 p.m. NAV. Returns shown include the reinvestment of all dividends and other distributions. Index returns do not include expenses. As stated in the current prospectus, the Fund’s annual operating expense ratio (gross) and net expense ratio is 1.61%. (Actual expenses can be referenced in the Financial Highlights section later in this report.) The Fund’s advisor has agreed to waive a portion of its fees and/or reimburse expenses to the extent necessary to keep the Fund’s expenses from exceeding 1.50%. Returns less than one year are not annualized. The performance table and graph do not reflect the deduction of taxes that a shareholder would pay on Fund distributions or the redemption of Fund shares. For the Fund’s most recent month end performance, please call 1-877-843-3831. * ** Commencement of operations. The price used to calculate market return (‘‘Market Price’’) is determined by using the closing price listed on the NYSE Arca and does not represent returns an investor would receive if shares were traded at other times. Total returns are calculated using the daily 4:00 pm midpoint between the bid and offer. Shares are bought and sold at market price, not NAV and are not individually redeemed from the Fund. The MSCI World Index is a free float-adjusted market capitalization weighted index that is designed to measure the equity market performance of developed markets. One cannot invest directly in an index. The Barclays Capital U.S. Aggregate Bond Index measures the performance of the U.S. investment grade bond market. One cannot invest directly in an index. 15
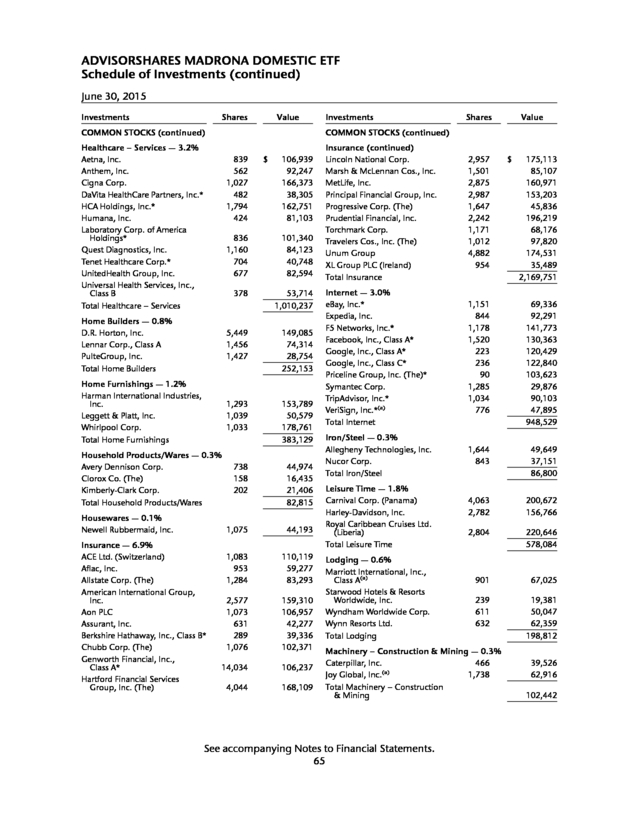
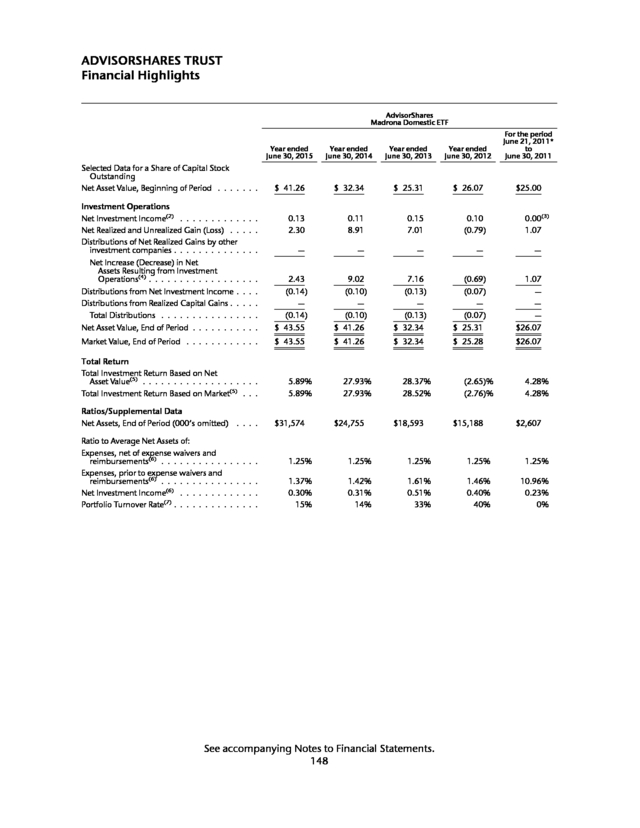
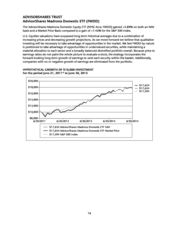
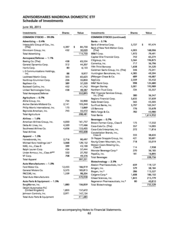
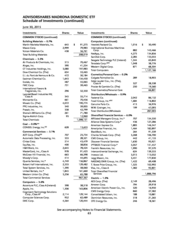
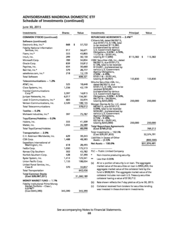
20) ADVISORSHARES TRUST AdvisorShares Madrona Domestic ETF (FWDD) The AdvisorShares Madrona Domestic Equity ETF (NYSE Arca: FWDD) gained +5.89% on both an NAV basis and a Market Price Basis compared to a gain of +7.42% for the S&P 500 Index. U.S. Equities valuations have surpassed long-term historical averages due to a combination of increasing prices and decreasing growth projections. As we move forward we believe that qualitative investing will be necessary to take advantage of opportunities in the market. We feel FWDD by nature is positioned to take advantage of opportunities in undervalued securities, while maintaining a material allocation to each sector and a broadly balanced diversified portfolio overall. Because price to earnings ratios do not paint the whole picture to evaluate a stock, the strategy incorporates the forward-looking long-term growth of earnings to rank each security within the basket. Additionally, companies with no or negative growth of earnings are eliminated from the portfolio. HYPOTHETICAL GROWTH OF $10,000 INVESTMENT For the period June 21, 2011* to June 30, 2015 $20,000 $17,654 $17,654 $17,594 $18,000 $16,000 $14,000 $12,000 $10,000 $8,000 6/20/2011 6/30/2012 6/30/2013 6/30/2014 $17,654 AdvisorShares Madrona Domestic ETF NAV $17,654 AdvisorShares Madrona Domestic ETF Market Price $17,594 S&P 500 Index 16 6/30/2015
21) HISTORICAL PERFORMANCE Total Return as of June 30, 2015 Year to Date 1 Month AdvisorShares Madrona Domestic ETF NAV . . . . AdvisorShares Madrona Domestic ETF Market Price** . . . . . . . . . . . . . . . . . . . . . . . . . . S&P 500 Index . . . . . . . . . . . . . . . . . . . . . . 1 Year 3 Year Since Inception 6/21/2011 3 Month -1.80% 0.05% 1.71% 5.89% 20.25% 15.16% -2.09% -1.94% -0.02% 0.28% 1.73% 1.23% 5.89% 7.42% 20.30% 17.31% 15.16% 15.06% Performance data quoted represents past performance and is no guarantee of future results. Current performance may be lower or higher than the performance data quoted. Investment return and principal value will fluctuate so that an investor’s shares, when redeemed, may be worth more or less than original cost. Fund NAV returns are calculated using the Fund’s daily 4:00 p.m. NAV. Returns shown include the reinvestment of all dividends and other distributions. Index returns do not include expenses. As stated in the current prospectus, the Fund’s annual operating expense ratio (gross) is 1.42% and the net expense ratio is 1.25%. (Actual expenses can be referenced in the Financial Highlights section later in this report.) The Fund’s advisor has agreed to waive a portion of its fees and/or reimburse expenses to the extent necessary to keep the Fund’s expenses from exceeding 1.25%. Returns less than one year are not annualized. The performance table and graph do not reflect the deduction of taxes that a shareholder would pay on Fund distributions or the redemption of Fund shares. For the Fund’s most recent month end performance, please call 1-877-843-3831. * ** Commencement of operations. The price used to calculate market return (‘‘Market Price’’) is determined by using the closing price listed on the NYSE Arca and does not represent returns an investor would receive if shares were traded at other times. Total returns are calculated using the daily 4:00 pm midpoint between the bid and offer. Shares are bought and sold at market price, not NAV and are not individually redeemed from the Fund. The S&P 500 Index is a broad-based, unmanaged measurement of changes in stock market conditions based on the average of 500 widely held common stocks. One can not invest directly in an index. 17
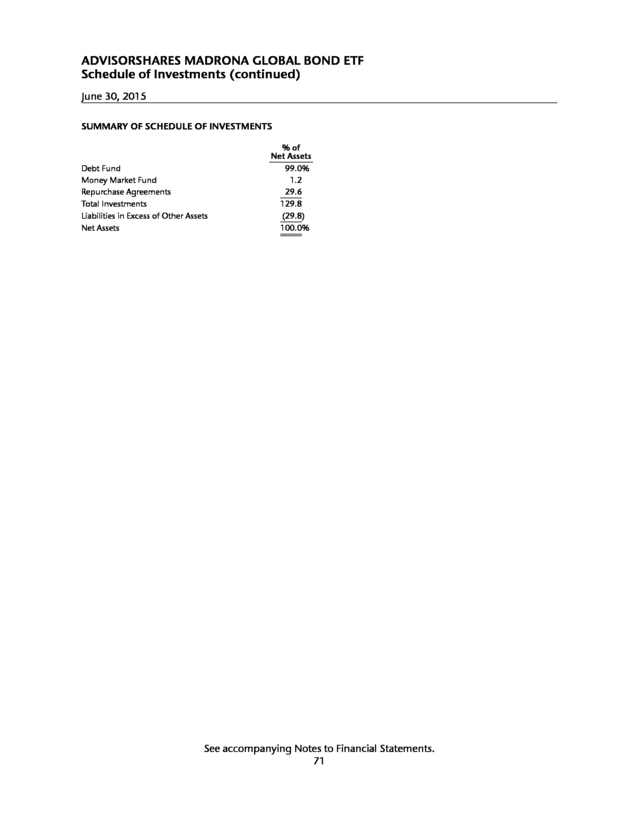
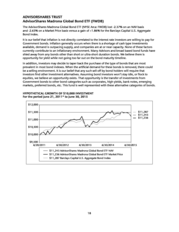
22) ADVISORSHARES TRUST AdvisorShares Madrona Global Bond ETF (FWDB) The AdvisorShares Madrona Global Bond ETF (NYSE Arca: FWDB) lost -2.37% on an NAV basis and -2.63% on a Market Price basis versus a gain of +1.86% for the Barclays Capital U.S. Aggregate Bond Index. It is our belief that inflation is not directly correlated to the interest rate investors are willing to pay for Government bonds. Inflation generally occurs when there is a shortage of cash type investments available, demand is outpacing supply, and companies are at or near capacity. None of these factors currently contribute to an inflationary environment. Many Advisors and broad based bond funds have shied away from any bonds other than short or ultra-short duration bonds. We believe there is opportunity for yield while not going too far out on the bond maturity timeline. In addition, investors may decide to taper back the purchase of the type of bonds that are most prevalent in most bond indexes. When the artificial demand for these bonds is removed, there could be a selling environment. It is our belief that any such sell-off by bond holders will require that investors find other investment alternatives. Assuming bond investors won’t stay idle, or flock to equities, we believe an opportunity exists. That opportunity is the transfer of investments from Government bonds to other bond categories such as corporates, high-yields, bank notes, emerging markets, preferred bonds, etc. This fund is well represented with these alternative categories of bonds. HYPOTHETICAL GROWTH OF $10,000 INVESTMENT For the period June 21, 2011* to June 30, 2015 $12,000 $11,287 $11,243 $11,236 $11,500 $11,000 $10,500 $10,000 $9,500 6/20/2011 6/30/2012 6/30/2013 6/30/2014 $11,243 AdvisorShares Madrona Global Bond ETF NAV $11,236 AdvisorShares Madrona Global Bond ETF Market Price $11,287 Barclays Capital U.S. Aggregate Bond Index 18 6/30/2015
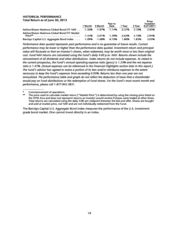
23) HISTORICAL PERFORMANCE Total Return as of June 30, 2015 Year to Date 1 Month AdvisorShares Madrona Global Bond ETF NAV . . AdvisorShares Madrona Global Bond ETF Market Price** . . . . . . . . . . . . . . . . . . . . . . . . . . Barclays Capital U.S. Aggregate Bond Index . . . 1 Year 3 Year Since Inception 6/21/2011 3 Month -1.50% -1.97% -1.14% -2.37% 2.10% 2.95% -1.54% -1.09% -2.01% -1.68% -1.29% -0.10% -2.63% 1.86% 2.10% 1.83% 2.94% 3.05% Performance data quoted represents past performance and is no guarantee of future results. Current performance may be lower or higher than the performance data quoted. Investment return and principal value will fluctuate so that an investor’s shares, when redeemed, may be worth more or less than original cost. Fund NAV returns are calculated using the Fund’s daily 4:00 p.m. NAV. Returns shown include the reinvestment of all dividends and other distributions. Index returns do not include expenses. As stated in the current prospectus, the Fund’s annual operating expense ratio (gross) is 1.53% and the net expense ratio is 1.41%. (Actual expenses can be referenced in the Financial Highlights section later in this report.) The Fund’s advisor has agreed to waive a portion of its fees and/or reimburse expenses to the extent necessary to keep the Fund’s expenses from exceeding 0.95%. Returns less than one year are not annualized. The performance table and graph do not reflect the deduction of taxes that a shareholder would pay on Fund distributions or the redemption of Fund shares. For the Fund’s most recent month end performance, please call 1-877-843-3831. * ** Commencement of operations. The price used to calculate market return (‘‘Market Price’’) is determined by using the closing price listed on the NYSE Arca and does not represent returns an investor would receive if shares were traded at other times. Total returns are calculated using the daily 4:00 pm midpoint between the bid and offer. Shares are bought and sold at market price, not NAV and are not individually redeemed from the Fund. The Barclays Capital U.S. Aggregate Bond Index measures the performance of the U.S. investment grade bond market. One cannot invest directly in an index. 19
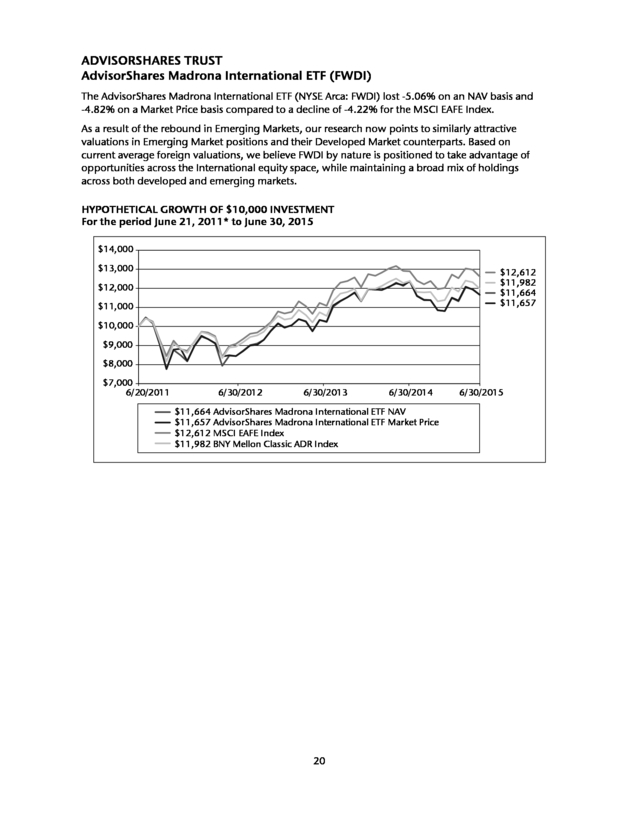
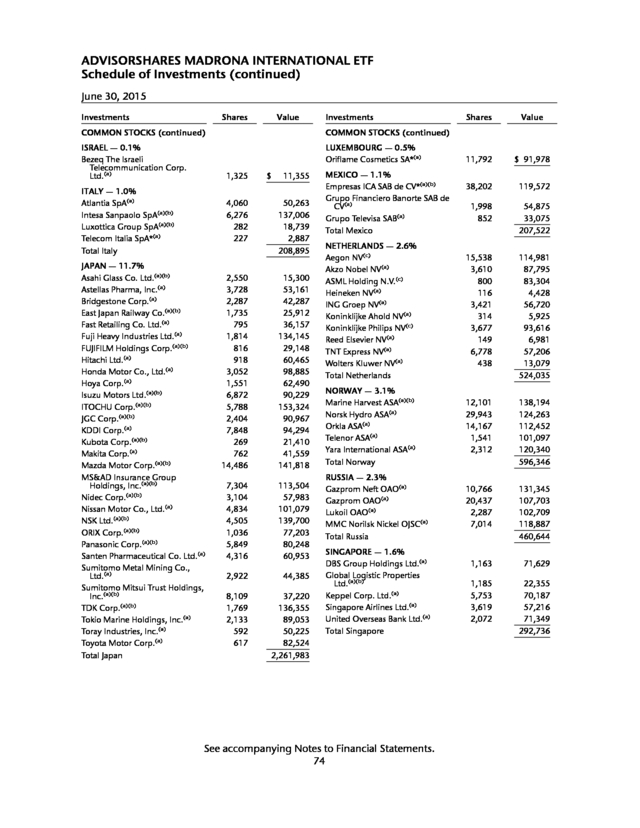
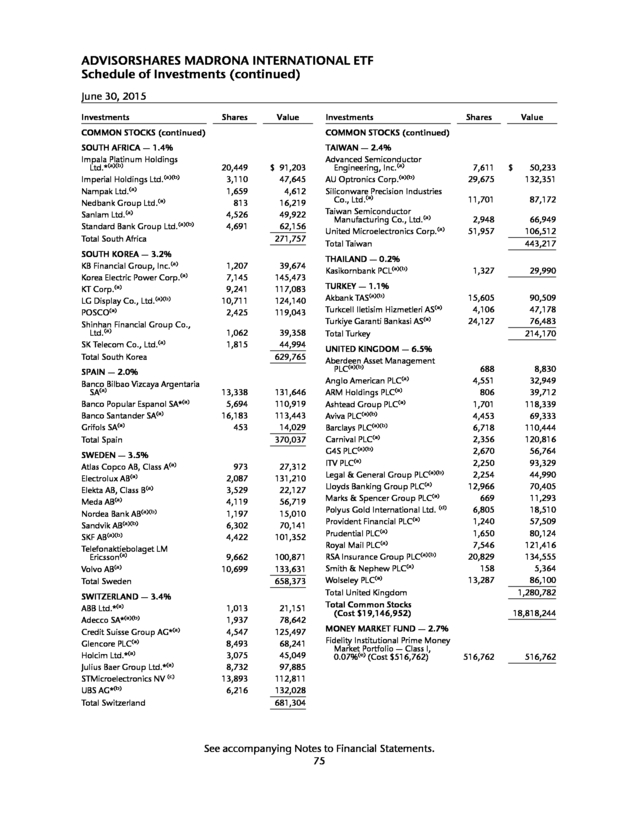
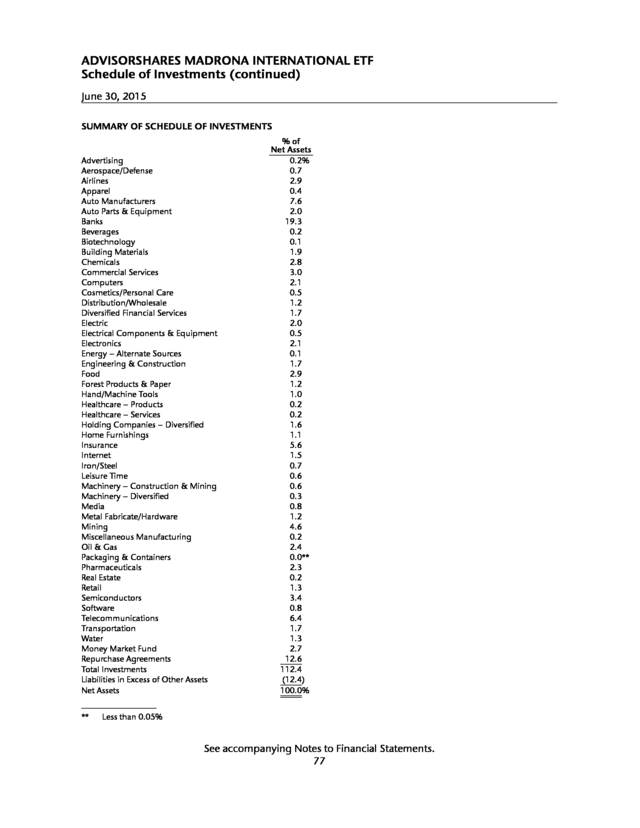
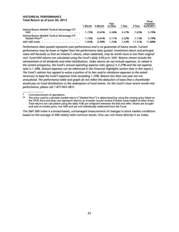
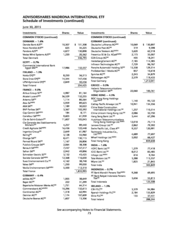
24) ADVISORSHARES TRUST AdvisorShares Madrona International ETF (FWDI) The AdvisorShares Madrona International ETF (NYSE Arca: FWDI) lost -5.06% on an NAV basis and -4.82% on a Market Price basis compared to a decline of -4.22% for the MSCI EAFE Index. As a result of the rebound in Emerging Markets, our research now points to similarly attractive valuations in Emerging Market positions and their Developed Market counterparts. Based on current average foreign valuations, we believe FWDI by nature is positioned to take advantage of opportunities across the International equity space, while maintaining a broad mix of holdings across both developed and emerging markets. HYPOTHETICAL GROWTH OF $10,000 INVESTMENT For the period June 21, 2011* to June 30, 2015 $14,000 $13,000 $12,612 $11,982 $11,664 $11,657 $12,000 $11,000 $10,000 $9,000 $8,000 $7,000 6/20/2011 6/30/2012 6/30/2013 6/30/2014 $11,664 AdvisorShares Madrona International ETF NAV $11,657 AdvisorShares Madrona International ETF Market Price $12,612 MSCI EAFE Index $11,982 BNY Mellon Classic ADR Index 20 6/30/2015
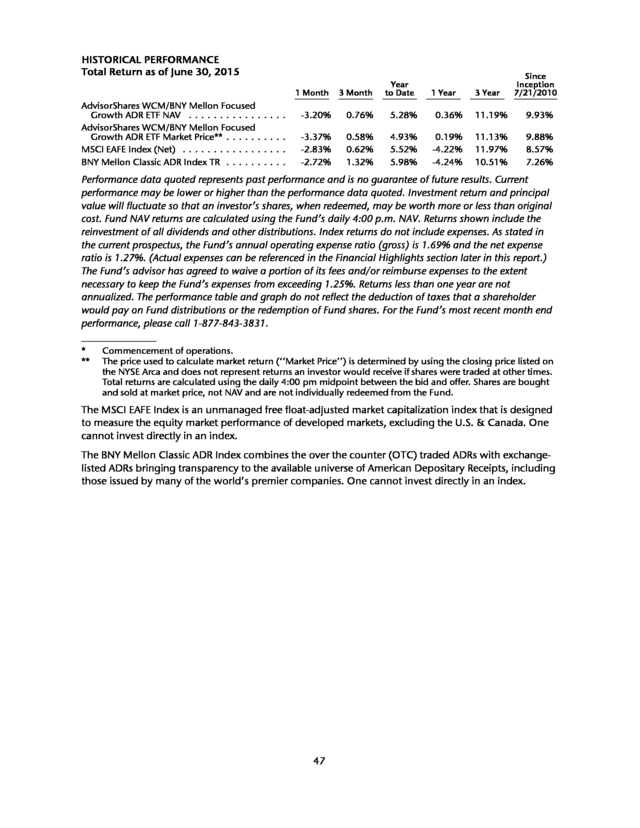
25) HISTORICAL PERFORMANCE Total Return as of June 30, 2015 1 Month AdvisorShares Madrona International ETF NAV . . AdvisorShares Madrona International ETF Market Price** . . . . . . . . . . . . . . . . . . . . . . . . . . MSCI EAFE Index (Net) . . . . . . . . . . . . . . . . . BNY Mellon Classic ADR Index. . . . . . . . . . . . . 3 Month -2.40% 3.13% -2.37% -2.83% -2.72% 2.71% 0.62% 1.32% Year to Date Since Inception 6/21/2011 1 Year 3 Year 7.58% -5.06% 11.27% 3.90% 7.46% 5.52% 5.98% -4.82% -4.22% -4.24% 11.16% 11.97% 10.51% 3.88% 5.93% 4.59% Performance data quoted represents past performance and is no guarantee of future results. Current performance may be lower or higher than the performance data quoted. Investment return and principal value will fluctuate so that an investor’s shares, when redeemed, may be worth more or less than original cost. Fund NAV returns are calculated using the Fund’s daily 4:00 p.m. NAV. Returns shown include the reinvestment of all dividends and other distributions. Index returns do not include expenses. As stated in the current prospectus, the Fund’s annual operating expense ratio (gross) is 1.55% and the net expense ratio is 1.25%. (Actual expenses can be referenced in the Financial Highlights section later in this report.) The Fund’s advisor has agreed to waive a portion of its fees and/or reimburse expenses to the extent necessary to keep the Fund’s expenses from exceeding 1.25%. Returns less than one year are not annualized. The performance table and graph do not reflect the deduction of taxes that a shareholder would pay on Fund distributions or the redemption of Fund shares. For the Fund’s most recent month end performance, please call 1-877-843-3831. * ** Commencement of operations. The price used to calculate market return (‘‘Market Price’’) is determined by using the closing price listed on the NYSE Arca and does not represent returns an investor would receive if shares were traded at other times. Total returns are calculated using the daily 4:00 pm midpoint between the bid and offer. Shares are bought and sold at market price, not NAV and are not individually redeemed from the Fund. The MSCI EAFE Index is an unmanaged free float-adjusted market capitalization index that is designed to measure the equity market performance of developed markets, excluding the U.S. & Canada. One cannot invest directly in an index. 21
26) ADVISORSHARES TRUST AdvisorShares Meidell Tactical Advantage ETF (MATH) The AdvisorShares Meidell Tactical Advantage ETF (NYSE Arca: MATH) gained 3.52% on a Market Price basis and 3.47% on an NAV basis for the year ending June 30, 2015, while the S&P 500 Index rose 7.42% over the same period. Over the past twelve months, the relative performance of the S&P 500 Index has illustrated the changes in investor behavior over this period. In the second half of 2014, U.S. large cap stocks outperformed other U.S. asset classes, as investors became more risk averse following the growing expectation that the Federal Reserve would end quantitative easing by October of last year. Another challenge for MATH during the second half of 2014 was the Ebola panic during the September to October time frame. Due to the steepness of the stock market’s decline and rebound in such a short period of time, MATH’s quantitative methodology kept it from experiencing the stock market’s sharp loss in value, but was unable to capture much of the early rebound due to the trend-following nature of MATH’s methodology. As 2014 was coming to a close, small cap stocks began to outperform. This was largely a function of the strengthening U.S. dollar, which investors interpreted as a drag on large multi-national corporations who export goods overseas. The MATH portfolio increased its allocation to small cap stocks in late 2014 and participated in the rally that followed through June of 2015. In early 2015, foreign stocks began outperforming, as the European Central Bank declared its plans for a quantitative easing program. For the first five (5) months of 2015 MATH’s allocation to U.S. small cap and foreign stocks lifted the Fund ahead of most broad U.S. market indexes, but by mid-June of 2015, concerns of Greece defaulting on their loan to the IMF and potentially exiting the European Union, caused MATH shares to underperform the S&P 500 Index. HYPOTHETICAL GROWTH OF $10,000 INVESTMENT For the period June 23, 2011* to June 30, 2015 $20,000 $18,000 $17,472 $16,000 $14,000 $12,542 $12,539 $12,000 $10,000 $8,000 6/22/2011 6/30/2012 6/30/2013 6/30/2014 6/30/2015 $12,539 AdvisorShares Meidell Tactical Advantage ETF NAV $12,542 AdvisorShares Meidell Tactical Advantage ETF Market Price $17,472 S&P 500 Index 22
27) HISTORICAL PERFORMANCE Total Return as of June 30, 2015 Year to Date 1 Month AdvisorShares Meidell Tactical Advantage ETF NAV . . . . . . . . . . . . . . . . . . . . . . . . . . . . AdvisorShares Meidell Tactical Advantage ETF Market Price** . . . . . . . . . . . . . . . . . . . . . S&P 500 Index . . . . . . . . . . . . . . . . . . . . . . 1 Year 3 Year Since Inception 6/23/2011 3 Month -1.72% -0.64% 2.46% 3.47% 7.63% 5.79% -1.72% -1.94% -0.64% 0.28% 3.11% 1.23% 3.52% 7.42% 7.13% 17.31% 5.79% 14.88% Performance data quoted represents past performance and is no guarantee of future results. Current performance may be lower or higher than the performance data quoted. Investment return and principal value will fluctuate so that an investor’s shares, when redeemed, may be worth more or less than original cost. Fund NAV returns are calculated using the Fund’s daily 4:00 p.m. NAV. Returns shown include the reinvestment of all dividends and other distributions. Index returns do not include expenses. As stated in the current prospectus, the Fund’s annual operating expense ratio (gross) is 2.27% and the net expense ratio is 1.50%. (Actual expenses can be referenced in the Financial Highlights section later in this report.) The Fund’s advisor has agreed to waive a portion of its fees and/or reimburse expenses to the extent necessary to keep the Fund’s expenses from exceeding 1.35%. Returns less than one year are not annualized. The performance table and graph do not reflect the deduction of taxes that a shareholder would pay on Fund distributions or the redemption of Fund shares. For the Fund’s most recent month end performance, please call 1-877-843-3831. * ** Commencement of operations. The price used to calculate market return (‘‘Market Price’’) is determined by using the closing price listed on the NYSE Arca and does not represent returns an investor would receive if shares were traded at other times. Total returns are calculated using the daily 4:00 pm midpoint between the bid and offer. Shares are bought and sold at market price, not NAV and are not individually redeemed from the Fund. The S&P 500 Index is a broad-based, unmanaged measurement of changes in stock market conditions based on the average of 500 widely held common stocks. One can not invest directly in an index. 23
28) ADVISORSHARES TRUST AdvisorShares Morgan Creek Global Tactical ETF (GTAA) The AdvisorShares Morgan Creek Global Tactical ETF (NYSE Arca: GTAA) returned -3.52% on a Market Price basis and -3.59% on a NAV basis from July 1, 2014 through June 30, 2015 as compared to 7.42% for the S&P 500. Morgan Creek Capital Management began sub advising for GTAA on July 28, 2014. It has returned -3.60% on a Market Price basis and -3.52% on a NAV basis from July 28, 2014 to June 30, 2015 as compared to 6.32% for the S&P 500 and -0.84% for a composite index consisting of 25% MSCI ACWI Index, 25% Barclays Aggregate Bond Index, 25% Bloomberg Commodity Index, and 25% DXY Index. Although GTAA underperformed the S&P 500 in the second half of calendar year 2014, its return in the first half of calendar year 2015 kept pace with the index until June when Chinese markets sold off materially. The Fund’s modified approach of investing across asset classes has kept the volatility low while providing the ability to invest in uncorrelated opportunities. HYPOTHETICAL GROWTH OF $10,000 INVESTMENT For the period October 26, 2010* to June 30, 2015 $20,000 $19,222 $18,000 $16,000 $14,000 $12,000 $10,467 $10,459 $10,000 $8,000 10/25/2010 6/30/2011 6/30/2012 6/30/2013 6/30/2014 6/30/2015 $10,467 AdvisorShares Morgan Creek Global Tactical ETF NAV $10,459 AdvisorShares Morgan Creek Global Tactical ETF Market Price $19,222 S&P 500 Index 24
29) HISTORICAL PERFORMANCE Total Return as of June 30, 2015 Year to Date 1 Month AdvisorShares Morgan Creek Global Tactical ETF NAV . . . . . . . . . . . . . . . . . . . AdvisorShares Morgan Creek Global Tactical ETF Market Price** . . . . . . . . . . . . S&P 500 Index . . . . . . . . . . . . . . . . . . . . . 1 Year 3 Year Since Inception 10/25/2010 3 Month -3.94% -3.41% -1.44% -3.59% 2.92% 0.98% -4.02% -1.94% -3.34% 0.28% 1.20% 1.23% -3.52% 7.42% 2.97% 17.31% 0.96% 14.99% Performance data quoted represents past performance and is no guarantee of future results. Current performance may be lower or higher than the performance data quoted. Investment return and principal value will fluctuate so that an investor’s shares, when redeemed, may be worth more or less than original cost. Fund NAV returns are calculated using the Fund’s daily 4:00 p.m. NAV. Returns shown include the reinvestment of all dividends and other distributions. Index returns do not include expenses. As stated in the current prospectus, the Fund’s annual operating expense ratio (gross) is 1.60% and the net expense ratio is 1.61%. (Actual expenses can be referenced in the Financial Highlights section later in this report.) The Fund’s advisor has agreed to waive a portion of its fees and/or reimburse expenses to the extent necessary to keep the Fund’s expenses from exceeding 1.25%. Returns less than one year are not annualized. The performance table and graph do not reflect the deduction of taxes that a shareholder would pay on Fund distributions or the redemption of Fund shares. For the Fund’s most recent month end performance, please call 1-877-843-3831. * ** Commencement of operations. The price used to calculate market return (‘‘Market Price’’) is determined by using the closing price listed on the NYSE Arca and does not represent returns an investor would receive if shares were traded at other times. Total returns are calculated using the daily 4:00 pm midpoint between the bid and offer. Shares are bought and sold at market price, not NAV and are not individually redeemed from the Fund. The S&P 500 Index is a broad-based, unmanaged measurement of changes in stock market conditions based on the average of 500 widely held common stocks. One can not invest directly in an index. 25
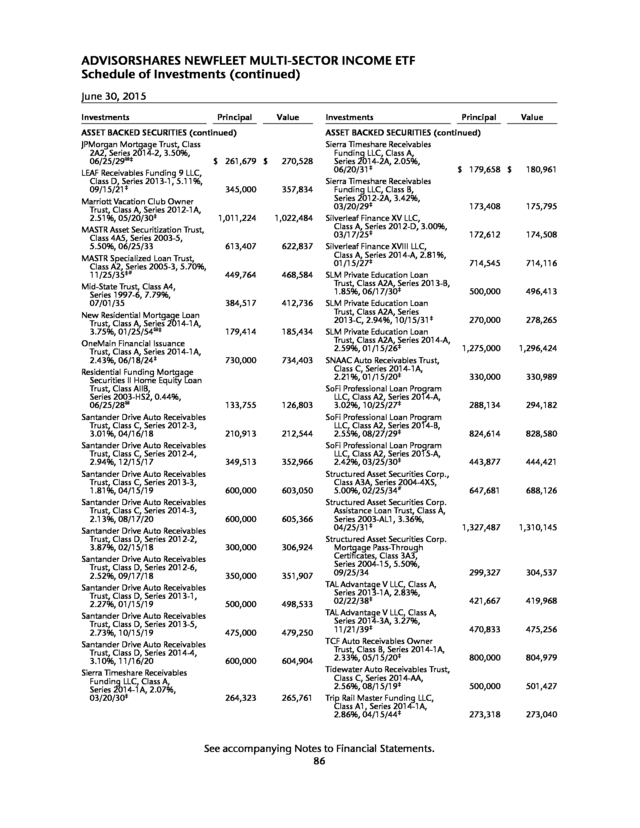
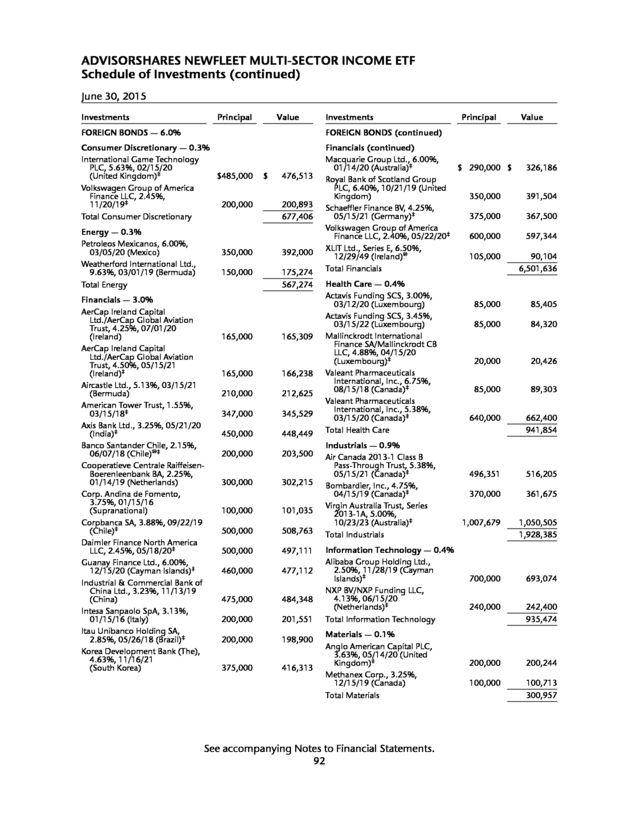
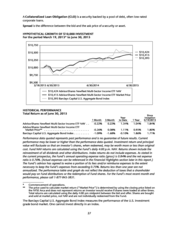
30) ADVISORSHARES TRUST AdvisorShares Newfleet Multi-Sector Income ETF (MINC) The AdvisorShares Newfleet Multi-Sector Income Fund (NYSE Arca: MINC) returned 0.95% on a Market Price Basis during the fiscal year ending June 30, 2015 compared to a gain of 1.86% for the Barclays Capital U.S. Aggregate Bond Index. During the fiscal year the Fund’s short duration relative to the benchmark in a declining rate environment detracted from performance. Over the last 12 months, yields increased on the short end of the U.S. Treasury curve and decreased on the long end. Overall the yield curve flattened. The Fund’s allocation to the structured finance sectors (CMBS, non-agency residential mortgage-backed (RMBS), and asset-backed (ABS)) continues to play an important role in the Fund. Valuations remain attractive in the areas in which we invest, and this segment of the market offers diversification to sectors more sensitive to global macro fears. In addition, it offers diversification to the corporate credit allocation within the portfolio. Our consumer focus within ABS has been beneficial as the U.S. consumer continues to show the ability to lift the U.S. economy. CMBS has benefited from the strengthening U.S. economy and demand for U.S. real estate; underlying commercial real estate fundamentals remain strong and for the most part are not hurt by low oil prices. RMBS benefits from the continuing improvement in the housing market. High beta sectors such as corporate high yield and bank loans contributed to the Fund’s positive performance. Both benefited from investors’ higher risk appetite and reach for yield. The corporate high yield sector has performed well in an environment where rates have backed up. The sector has benefited from continued positive fundamentals (including low defaults), demand for yield (including strong demand from foreign investors), good relative value, and overall strength in U.S. risk assets. Issue selection within high yield also has contributed positively to performance. High yield bank loans, too, have performed well in a rising rate environment. The sector also has outperformed as a result of continued favorable technicals (due to demand from Collateralized Loan Obligation (CLO) issuance, lower loan fund outflows, and low net issuance), positive fundamentals (including low defaults), demand for yield, good relative value, and strength in U.S. risk assets. Within the corporate investment grade sector the Fund’s overweight to BBB rated securities benefitted performance as they outperformed the broader corporate investment grade index. We are constructive on sectors with a yield advantage to U.S. Treasuries as credit fundamentals remain positive and spreads remain at attractive levels. With positive fundamentals such as low defaults and good interest coverage, modest demand for fixed income by investors, and a supportive environment for fixed income, spread sectors continue to offer attractive investment opportunities to investors searching for total return and yield. Some of the specific sectors where we see value are higher quality corporate high yield, out-of-index/off-the-run asset-backed securities, high yield bank loans, new issue corporate investment grade and selective emerging market sovereigns. Over the fiscal year, we continued to invest cash from inflows and sale proceeds, primarily focusing on the addition of higher quality bank loans, corporate high yield bonds, corporate high quality bonds and asset backed securities. We have continued to overweight spread sectors, seeking to take advantage of higher yields and wider spreads. The Yield Curve is a line that plots the interest rates, at a set point in time, of bonds having equal credit quality, but differing maturity dates. The most frequently reported yield curve compares the three-month, two-year, five-year and 30-year U.S. Treasury debt. This yield curve is used as a benchmark for other debt in the market, such as mortgage rates or bank lending rates. The curve is also used to predict changes in economic output and growth. An Asset Backed Security (ABS) is a financial security backed by a loan, lease or receivables against assets other than real estate and mortgage-backed securities. For investors, asset-backed securities are an alternative to investing in corporate debt. Beta is a measure of the volatility, or systematic risk, of a security or a portfolio in comparison to the market as a whole. Beta is used in the capital asset pricing model (CAPM), a model that calculates the expected return of an asset based on its beta and expected market returns. 26
31) A Collateralized Loan Obligation (CLO) is a security backed by a pool of debt, often low-rated corporate loans. Spread is the difference between the bid and the ask price of a security or asset. HYPOTHETICAL GROWTH OF $10,000 INVESTMENT For the period March 19, 2013* to June 30, 2015 $10,750 $10,424 $10,415 $10,393 $10,500 $10,250 $10,000 $9,750 $9,500 3/19/2013 6/30/2013 6/30/2014 6/30/2015 $10,424 AdvisorShares Newfleet Multi-Sector Income ETF NAV $10,415 AdvisorShares Newfleet Multi-Sector Income ETF Market Price $10,393 Barclays Capital U.S. Aggregate Bond Index HISTORICAL PERFORMANCE Total Return as of June 30, 2015 Year to Date 1 Month AdvisorShares Newfleet Multi-Sector Income ETF NAV . . AdvisorShares Newfleet Multi-Sector Income ETF Market Price** . . . . . . . . . . . . . . . . . . . . . . . . . . Barclays Capital U.S. Aggregate Bond Index . . . . . . . . . 1 Year Since Inception 3/19/2013 3 Month -0.22% 0.22% 1.34% 1.04% 1.84% -0.26% -1.09% 0.08% -1.68% 1.11% -0.10% 0.95% 1.86% 1.80% 1.71% Performance data quoted represents past performance and is no guarantee of future results. Current performance may be lower or higher than the performance data quoted. Investment return and principal value will fluctuate so that an investor’s shares, when redeemed, may be worth more or less than original cost. Fund NAV returns are calculated using the Fund’s daily 4:00 p.m. NAV. Returns shown include the reinvestment of all dividends and other distributions. Index returns do not include expenses. As stated in the current prospectus, the Fund’s annual operating expense ratio (gross) is 0.84% and the net expense ratio is 0.76%. (Actual expenses can be referenced in the Financial Highlights section later in this report.) The Fund’s advisor has agreed to waive a portion of its fees and/or reimburse expenses to the extent necessary to keep the Fund’s expenses from exceeding 0.75%. Returns less than one year are not annualized. The performance table and graph do not reflect the deduction of taxes that a shareholder would pay on Fund distributions or the redemption of Fund shares. For the Fund’s most recent month end performance, please call 1-877-843-3831. * ** Commencement of operations. The price used to calculate market return (‘‘Market Price’’) is determined by using the closing price listed on the NYSE Arca and does not represent returns an investor would receive if shares were traded at other times. Total returns are calculated using the daily 4:00 pm midpoint between the bid and offer. Shares are bought and sold at market price, not NAV and are not individually redeemed from the Fund. The Barclays Capital U.S. Aggregate Bond Index measures the performance of the U.S. investment grade bond market. One cannot invest directly in an index. 27
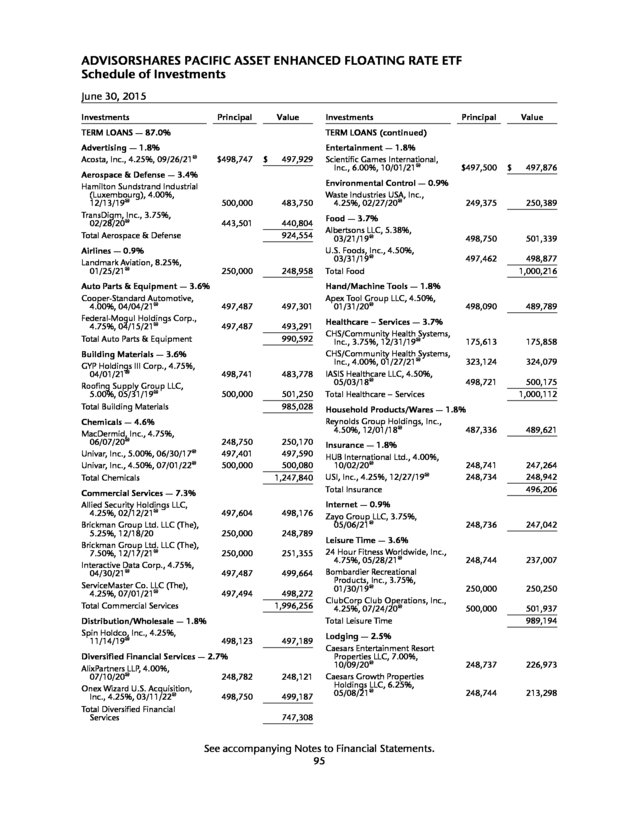
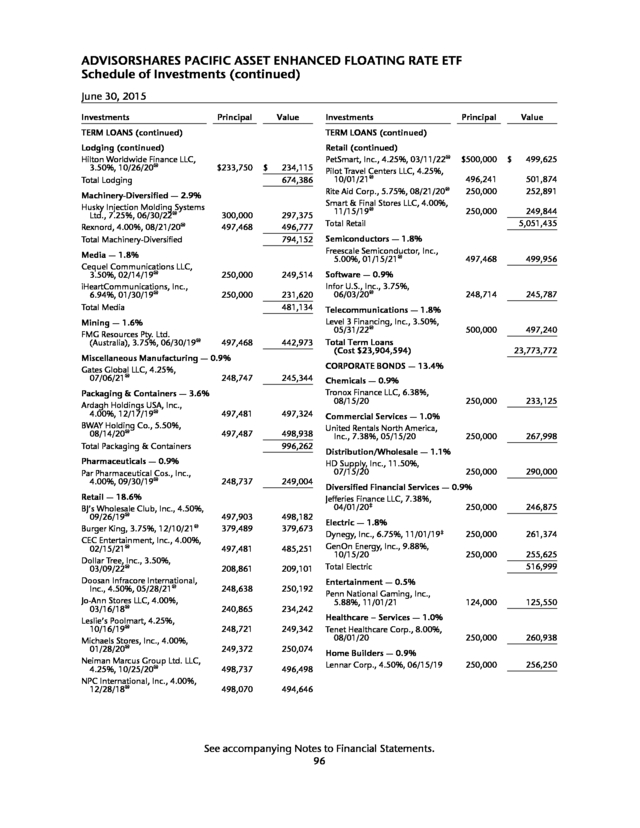
32) ADVISORSHARES TRUST AdvisorShares Pacific Asset Enhanced Floating Rate ETF (FLRT) The AdvisorShares Pacific Asset Enhanced Floating Rate ETF (NYSE Arca: FLRT) earned a total return 0.47% (NAV) and 0.62% (Market Price) for the three months ending June 30, 2015, and has provided return of 0.71% (Market Price) and 0.47% (NAV) since inception. For the three months ending June 30, 2015, the Credit Suisse Institutional Leveraged Loan Index (CSILLI) was up 0.98%, with the S&P/LSTA 100 Index returning -0.09%. This underperformance was attributed to FLRT’s exposure to specific sectors, including metals/minerals, utilities and consumer durables. Utilities and metals/minerals lagged the Index and the underperformance was due to declining coal and iron ore prices. We continue to hold higher-rated, more liquid loans within FLRT. We believe they will continue to strike the best balance among limited rate sensitivity, attractive income and reasonable default risk. The portfolio also maintains a significant exposure to non-bank loan assets, primarily through lower-than-average duration high yield bonds. FLRT dynamically utilizes Total Return Swaps to add incremental bank loan credit risk to the fund. We believe that, over time, investors will benefit from having a modestly levered exposure to the bank loan market. Our ETF risk committee has targeted leverage equivalent to up to 20% of the assets of the fund. Due to the relative value of leverage available, we’ve elected to hold the leverage component closer to 10% of the size of the fund currently. A Total Return Swap is a swap agreement in which one party makes payments based on a set rate, either fixed or variable, while the other party makes payments based on the return of an underlying asset, which includes both the income it generates and any capital gains. A Bank Loan is a loan or a line of credit expended to a corporation from a traditional bank. Leverage is the amount of debt used to finance a firm’s assets. HYPOTHETICAL GROWTH OF $10,000 INVESTMENT For the period February 18, 2015* to June 30, 2015 $10,500 $10,250 $10,071 $10,047 $10,038 $10,000 $9,750 $9,500 2/18/2015 3/31/2015 6/30/2015 $10,047 AdvisorShares Pacific Asset Enhanced Floating Rate ETF NAV $10,071 AdvisorShares Pacific Asset Enhanced Floating Rate ETF Market Price $10,038 S&P/LSTA U.S. Leveraged Loan 100 TR USD Index 28
33) HISTORICAL PERFORMANCE Total Return as of June 30, 2015 1 Month AdvisorShares Pacific Asset Enhanced Floating Rate ETF NAV . . . . . . AdvisorShares Pacific Asset Enhanced Floating Rate ETF Market Price** S&P/LSTA U.S. Leveraged Loan 100 Index . . . . . . . . . . . . . . . . . . S&P 500 Index . . . . . . . . . . . . . . . . . . . . . . . . . . . . . . . . . . . . U.S. OE Bank Loan Index . . . . . . . . . . . . . . . . . . . . . . . . . . . . . . . . . . . . . . . . . . . . . 3 Month Since Inception 2/18/2015 -0.52% -0.50% -0.86% -1.94% -0.47% 0.47% 0.62% -0.09% 0.28% 0.57% 0.47% 0.71% 0.38% -1.02% 1.29% Performance data quoted represents past performance and is no guarantee of future results. Current performance may be lower or higher than the performance data quoted. Investment return and principal value will fluctuate so that an investor’s shares, when redeemed, may be worth more or less than original cost. Fund NAV returns are calculated using the Fund’s daily 4:00 p.m. NAV. Returns shown include the reinvestment of all dividends and other distributions. Index returns do not include expenses. As stated in the current prospectus, the Fund’s annual operating expense ratio (gross) is 1.16% and the net expense ratio is 1.10%. (Actual expenses can be referenced in the Financial Highlights section later in this report.) The Fund’s advisor has agreed to waive a portion of its fees and/or reimburse expenses to the extent necessary to keep the Fund’s expenses from exceeding 1.10%. Returns less than one year are not annualized. The performance table and graph do not reflect the deduction of taxes that a shareholder would pay on Fund distributions or the redemption of Fund shares. For the Fund’s most recent month end performance, please call 1-877-843-3831. * ** Commencement of operations. The price used to calculate market return (‘‘Market Price’’) is determined by using the closing price listed on the NYSE Arca and does not represent returns an investor would receive if shares were traded at other times. Total returns are calculated using the daily 4:00 pm midpoint between the bid and offer. Shares are bought and sold at market price, not NAV and are not individually redeemed from the Fund. The S&P/LSTA U.S. Leveraged Loan 100 Index is designed to track the market-weighted performance of the largest institutional leveraged loans based on market weightings, spreads and interest payments. One cannot invest directly in an index. The S&P 500 Index is a broad-based, unmanaged measurement of changes in stock market conditions based on the average of 500 widely held common stocks. One cannot invest directly in an index. Bank Loan: funds that invest primarily in floating-rate bank loans instead of bonds. In exchange for their credit risk, they offer high interest payments that typically float above a common short-term benchmark. 29
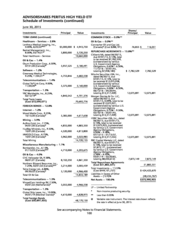
34) ADVISORSHARES TRUST AdvisorShares Peritus High Yield ETF (HYLD) The AdvisorShares Peritus High Yield ETF (NYSE Arca: HYLD) returned -16.88% during fiscal year ending June 30, 2015 on a market price basis and -16.82% on a NAV basis, compared to a return of -0.40% for the Barclays Capital U.S. Corporate High Yield Index. Our underperformance relative to the index was caused largely by our energy exposure during the final quarter of 2014. Based on the research we had done and our in-depth understanding of the energy market, we had made a strategic allocation to the this sector during 2014, and we, like most of the market, were surprised by the swiftness and severity of the decline in oil prices in the latter half of 2014 and into early 2015. No one, including us, projected a 50% decline in oil prices, especially given that global energy markets were merely in a slight over-supply situation and demand was still growing. Another related factor that had an impact on the portfolio was the decision we had made to include dividend paying equities in the portfolio, many of them in the energy space. During 2014, in an effort to protect income and, in several cases, execute on our energy thesis, we had decided to include selective master limited partnerships (MLPs) and dividend paying equities in the portfolio. While this did serve to protect income and provide what we saw as attractive yield, it did introduce an additional level of volatility to the portfolios, especially as we saw the swift decline in oil prices. As 2015 began and the reality of low oil prices was evident for the time being, we cut our energy holdings by more than half of what it was when we exited 2014, though this didn’t mean we eliminated all of our energy exposure. We are still long term believers that oil prices will have to rise from here, but that may take the better part of a year to happen. Additionally, during the first half of calendar 2015 we eliminated our equity positions. While our intention with purchasing dividend equities was to protect the fund’s yield and take advantage of various yield-bearing opportunities within the company’s entire capital structure, the latter part of 2014 and early 2015 demonstrated that these equities produced excessive volatility within the fund. As of the end of the fiscal year, we have exited our equity positions and do not intend to undertake further equity investments at this time. Finally we are taking steps to broaden out our portfolio in terms of the number of holdings, including adding some more recognizable and highly liquid names that are more familiar to our market makers but still meet our investment criteria. For more detail about our strategy behind these changes within the portfolio, see our recent piece ‘‘The Past, Present and Future,’’ as well as our ‘‘Mid-Year Update,’’ both found on the HYLD website (http://hyld.advisorshares.com). HYPOTHETICAL GROWTH OF $10,000 INVESTMENT For the period December 1, 2010* to June 30, 2015 $15,000 $14,000 $13,970 $13,000 $11,818 $11,797 $12,000 $11,000 $10,000 $9,000 11/30/2010 6/30/2011 6/30/2012 6/30/2013 6/30/2014 $11,818 AdvisorShares Peritus High Yield ETF NAV $11,797 AdvisorShares Peritus High Yield ETF Market Price $13,970 Barclays U.S. Corporate High Yield Index 30 6/30/2015
35) HISTORICAL PERFORMANCE Total Return as of June 30, 2015 Year to Date 1 Month AdvisorShares Peritus High Yield ETF NAV . . . . . AdvisorShares Peritus High Yield ETF Market Price** . . . . . . . . . . . . . . . . . . . . . . . . . . Barclays U.S. Corporate High Yield Index . . . . . 1 Year 3 Year Since Inception 12/1/2010 3 Month -1.40% 0.05% 0.41% -16.82% 2.21% 3.72% -1.38% -1.49% 0.37% 0.00% 2.51% 2.53% -16.88% -0.40% 2.14% 6.81% 3.68% 7.57% Performance data quoted represents past performance and is no guarantee of future results. Current performance may be lower or higher than the performance data quoted. Investment return and principal value will fluctuate so that an investor’s shares, when redeemed, may be worth more or less than original cost. Fund NAV returns are calculated using the Fund’s daily 4:00 p.m. NAV. Returns shown include the reinvestment of all dividends and other distributions. Index returns do not include expenses. As stated in the current prospectus, the Fund’s annual operating expense ratio (gross) and net expense ratio is 1.18%. (Actual expenses can be referenced in the Financial Highlights section later in this report.) The Fund’s advisor has agreed to waive a portion of its fees and/or reimburse expenses to the extent necessary to keep the Fund’s expenses from exceeding 1.35%. Returns less than one year are not annualized. The performance table and graph do not reflect the deduction of taxes that a shareholder would pay on Fund distributions or the redemption of Fund shares. For the Fund’s most recent month end performance, please call 1-877-843-3831. * ** Commencement of operations. The price used to calculate market return (‘‘Market Price’’) is determined by using the closing price listed on the NYSE Arca and does not represent returns an investor would receive if shares were traded at other times. Total returns are calculated using the daily 4:00 pm midpoint between the bid and offer. Shares are bought and sold at market price, not NAV and are not individually redeemed from the Fund. The Barclays U.S. Corporate High Yield Index is an unmanaged index considered representative of the universe of U.S. fixed rate, non investment grade debt. One cannot invest directly in an index. 31
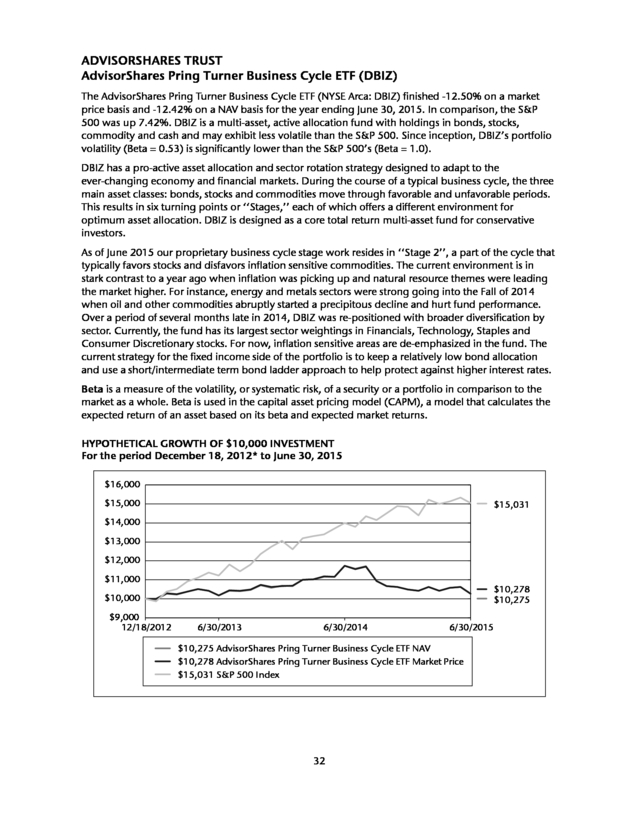
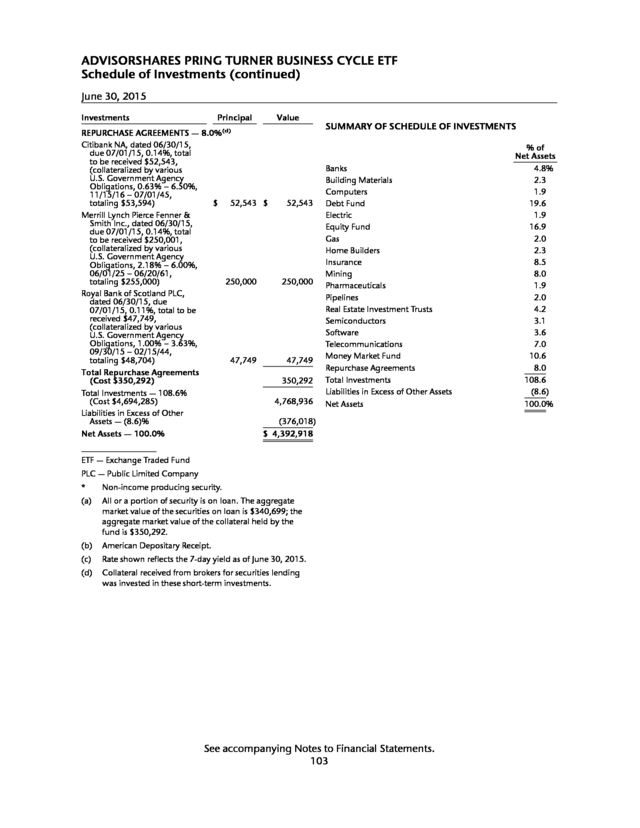
36) ADVISORSHARES TRUST AdvisorShares Pring Turner Business Cycle ETF (DBIZ) The AdvisorShares Pring Turner Business Cycle ETF (NYSE Arca: DBIZ) finished -12.50% on a market price basis and -12.42% on a NAV basis for the year ending June 30, 2015. In comparison, the S&P 500 was up 7.42%. DBIZ is a multi-asset, active allocation fund with holdings in bonds, stocks, commodity and cash and may exhibit less volatile than the S&P 500. Since inception, DBIZ’s portfolio volatility (Beta = 0.53) is significantly lower than the S&P 500’s (Beta = 1.0). DBIZ has a pro-active asset allocation and sector rotation strategy designed to adapt to the ever-changing economy and financial markets. During the course of a typical business cycle, the three main asset classes: bonds, stocks and commodities move through favorable and unfavorable periods. This results in six turning points or ‘‘Stages,’’ each of which offers a different environment for optimum asset allocation. DBIZ is designed as a core total return multi-asset fund for conservative investors. As of June 2015 our proprietary business cycle stage work resides in ‘‘Stage 2’’, a part of the cycle that typically favors stocks and disfavors inflation sensitive commodities. The current environment is in stark contrast to a year ago when inflation was picking up and natural resource themes were leading the market higher. For instance, energy and metals sectors were strong going into the Fall of 2014 when oil and other commodities abruptly started a precipitous decline and hurt fund performance. Over a period of several months late in 2014, DBIZ was re-positioned with broader diversification by sector. Currently, the fund has its largest sector weightings in Financials, Technology, Staples and Consumer Discretionary stocks. For now, inflation sensitive areas are de-emphasized in the fund. The current strategy for the fixed income side of the portfolio is to keep a relatively low bond allocation and use a short/intermediate term bond ladder approach to help protect against higher interest rates. Beta is a measure of the volatility, or systematic risk, of a security or a portfolio in comparison to the market as a whole. Beta is used in the capital asset pricing model (CAPM), a model that calculates the expected return of an asset based on its beta and expected market returns. HYPOTHETICAL GROWTH OF $10,000 INVESTMENT For the period December 18, 2012* to June 30, 2015 $16,000 $15,000 $15,031 $14,000 $13,000 $12,000 $11,000 $10,278 $10,275 $10,000 $9,000 12/18/2012 6/30/2013 6/30/2014 6/30/2015 $10,275 AdvisorShares Pring Turner Business Cycle ETF NAV $10,278 AdvisorShares Pring Turner Business Cycle ETF Market Price $15,031 S&P 500 Index 32
37) HISTORICAL PERFORMANCE Total Return as of June 30, 2015 Year to Date 1 Month AdvisorShares Pring Turner Business Cycle ETF NAV. . AdvisorShares Pring Turner Business Cycle ETF Market Price** . . . . . . . . . . . . . . . . . . . . . . . . S&P 500 Index . . . . . . . . . . . . . . . . . . . . . . . . . 1 Year Since Inception 12/18/2012 3 Month -3.27% -1.45% -2.10% -12.42% 1.08% -3.24% -1.94% -1.38% 0.28% -2.03% 1.23% -12.50% 7.42% 1.09% 17.47% Performance data quoted represents past performance and is no guarantee of future results. Current performance may be lower or higher than the performance data quoted. Investment return and principal value will fluctuate so that an investor’s shares, when redeemed, may be worth more or less than original cost. Fund NAV returns are calculated using the Fund’s daily 4:00 p.m. NAV. Returns shown include the reinvestment of all dividends and other distributions. Index returns do not include expenses. As stated in the current prospectus, the Fund’s annual operating expense ratio (gross) is 2.74% and the net expense ratio is 1.68%. (Actual expenses can be referenced in the Financial Highlights section later in this report.) The Fund’s advisor has agreed to waive a portion of its fees and/or reimburse expenses to the extent necessary to keep the Fund’s expenses from exceeding 1.49%. Returns less than one year are not annualized. The performance table and graph do not reflect the deduction of taxes that a shareholder would pay on Fund distributions or the redemption of Fund shares. For the Fund’s most recent month end performance, please call 1-877-843-3831. * ** Commencement of operations. The price used to calculate market return (‘‘Market Price’’) is determined by using the closing price listed on the NYSE Arca and does not represent returns an investor would receive if shares were traded at other times. Total returns are calculated using the daily 4:00 pm midpoint between the bid and offer. Shares are bought and sold at market price, not NAV and are not individually redeemed from the Fund. The S&P 500 Index is a broad-based, unmanaged measurement of changes in stock market conditions based on the average of 500 widely held common stocks. One cannot invest directly in an index. 33
38) ADVISORSHARES TRUST AdvisorShares QAM Equity Hedge ETF (QEH) The AdvisorShares QAM Equity Hedge ETF (NYSE: Arca: QEH) incepted on August 7, 2012. For the period ending 6/30/2015 QEH has returned 6.00% on a Net Asset Value annualized basis and 6.01% on a Market Price annualized basis since inception. For the one year period ending 6/30/2015 QEH returned 1.48% on an NAV basis and 1.60% on a Market Price basis. Performance in the fund was slightly behind our benchmark, the HFRI Equity Hedge (Total) Index, but was still within the range of expectations for the strategy. The Fund utilizes a fundamental and quantitative investment process to estimate the aggregate net market exposures of a large universe of long/short equity hedge funds defined by the HFRI Equity Hedge (Total) Index. The Fund’s sub-advisor has fundamentally identified over 25 groups of long/short equity hedge fund managers within the Index and utilizes a factor based system to attempt to identify the net exposures for each group. The sub-advisor believes that by replicating the net exposures of each group, over time the Fund’s return will closely track that of the index. In the year ended June 2015, we believe dominant performance of the US equity markets has begun to fade against its global counterparts. The moderately net exposed global portfolio for QEH partially participated in the gains while doing so with a lower beta to the S&P 500. Throughout the year, there was a tug of war between a friendly low interest rate environment and unfriendly geopolitical situations ranging from Russia and Ukraine to Greece and the European Union. In addition, the concerns of a slowdown in China weighed on markets. As the markets bounced up and down, our models indicated that the universe of long/short equity hedge fund managers, in aggregate, kept their net exposures in a fairly tight band around 60% net long. Within economic sectors, Information Technology was the largest allocation followed by Healthcare, Financials and Consumer Discretionary. Net exposure to North America remained the largest geographic exposure, however during the year exposures to developed Non-U.S., emerging, and frontier markets were rising. QEH is a diversified and moderately net exposed portfolio providing a lower volatility approach to global equity markets that we believe can produce superior risk adjusted returns over time. A long position is the purchase of an investment with the expectation that it will rise in value. A short position is the sale of a borrowed investment with the expectation that it will decline in value. HYPOTHETICAL GROWTH OF $10,000 INVESTMENT For the period August 7, 2012* to June 30, 2015 $12,500 $12,000 $11,840 $11,840 $11,500 $11,000 $10,500 $10,000 $9,500 8/7/2012 6/30/2013 6/30/2014 $11,840 AdvisorShares QAM Equity Hedge ETF NAV $11,840 AdvisorShares QAM Equity Hedge ETF Market Price N/A HFRI Equity Hedge (Total) Index 34 6/30/2015
39) HISTORICAL PERFORMANCE Total Return as of June 30, 2015 Year to Date 1 Month AdvisorShares QAM Equity Hedge ETF NAV . . . . . . AdvisorShares QAM Equity Hedge ETF Market Price** . . . . . . . . . . . . . . . . . . . . . . . . . . . . . HFRI Equity Hedge (Total) Index . . . . . . . . . . . . . . 1 Year Since Inception 8/7/2012 3 Month -1.41% 0.49% 2.39% 1.48% 6.00% -0.80% -0.75% 0.60% 2.01% 3.30% 4.05% 1.60% 2.59% 6.01% N/A*** Performance data quoted represents past performance and is no guarantee of future results. Current performance may be lower or higher than the performance data quoted. Investment return and principal value will fluctuate so that an investor’s shares, when redeemed, may be worth more or less than original cost. Fund NAV returns are calculated using the Fund’s daily 4:00 p.m. NAV. Returns shown include the reinvestment of all dividends and other distributions. Index returns do not include expenses. As stated in the current prospectus, the Fund’s annual operating expense ratio (gross) is 3.12% and the net expense ratio is 2.16%. (Actual expenses can be referenced in the Financial Highlights section later in this report.) The Fund’s advisor has agreed to waive a portion of its fees and/or reimburse expenses to the extent necessary to keep the Fund’s expenses from exceeding 1.50%. Returns less than one year are not annualized. The performance table and graph do not reflect the deduction of taxes that a shareholder would pay on Fund distributions or the redemption of Fund shares. For the Fund’s most recent month end performance, please call 1-877-843-3831. * ** Commencement of operations. The price used to calculate market return (‘‘Market Price’’) is determined by using the closing price listed on the NYSE Arca and does not represent returns an investor would receive if shares were traded at other times. Total returns are calculated using the daily 4:00 pm midpoint between the bid and offer. Shares are bought and sold at market price, not NAV and are not individually redeemed from the Fund. *** Benchmark performance available on a month-end basis only. For the period 8/31/2012 through 6/30/2015, the HFRI Equity Hedge Index returned 8.35%. The HFRI Equity Hedge Index is a fund-weighted index of select hedge funds focusing on Equity Hedge strategies. Equity Hedge investing consists of a core holding of long equities hedged at all times with short sales of stocks and/or stock index options. One cannot invest directly in an index. 35
40) ADVISORSHARES TRUST AdvisorShares Ranger Equity Bear ETF (HDGE) The AdvisorShares Ranger Equity Bear ETF (NYSE Arca: HDGE) returned -7.72% on a Market Price basis and -7.64% on an NAV basis from July 1, 2014 through June 30, 2015 compared to +7.42% for the S&P 500 Index. As a short-only investment vehicle HDGE seeks to outperform peers and relevant benchmarks on a relative basis during bull markets. During down markets and/or highly volatile market conditions characterized by fear and uncertainty, HDGE seeks to generate positive results and outperform peers and relevant benchmarks on both a relative and absolute basis. Performance was driven by a mid-capitalization growth exposure allocated to stocks not in the S&P 500 Index and to some extent several large capitalization holdings. The fund remained nearly fully invested over the entire 12 month period in aggressive growth stocks despite equity markets pushing to new highs. The valuation of market indices on a price/revenue basis is at a multi-decade high. Sentiment among both professional and individual investors has reached extremes on numerous occasions over the past 12 months. The percentage of unprofitable IPOs reached a 25-year high over the past 12 months. In addition, household liquidity has turned down while margin leverage has increased. As a result, the fund managers have maintained an aggressive short position for the fund. A short position is the sale of a borrowed investment with the expectation that it will decline in value. HYPOTHETICAL GROWTH OF $10,000 INVESTMENT For the period January 27, 2011* to June 30, 2015 $20,000 $18,000 $17,488 $16,000 $14,000 $12,000 $10,000 $8,000 $6,000 $4,000 1/27/2011 6/30/2011 $4,352 $4,352 6/30/2012 6/30/2013 6/30/2014 $4,352 AdvisorShares Active Bear ETF NAV $4,352 AdvisorShares Active Bear ETF Market Price $17,488 S&P 500 Index 36 6/30/2015
41) HISTORICAL PERFORMANCE Total Return as of June 30, 2015 1 Month AdvisorShares Ranger Equity Bear ETF NAV . . . . AdvisorShares Ranger Equity Bear ETF Market Price** . . . . . . . . . . . . . . . . . . . . . . . . . . S&P 500 Index . . . . . . . . . . . . . . . . . . . . . . 3 Month 0.74% -1.80% 0.65% -1.94% -1.89% 0.28% Year to Date Since Inception 1/27/2011 1 Year 3 Year -5.14% -7.64% -22.45% -17.14% -4.98% 1.23% -7.72% 7.42% -22.46% 17.31% -17.14% 13.47% Performance data quoted represents past performance and is no guarantee of future results. Current performance may be lower or higher than the performance data quoted. Investment return and principal value will fluctuate so that an investor’s shares, when redeemed, may be worth more or less than original cost. Fund NAV returns are calculated using the Fund’s daily 4:00 p.m. NAV. Returns shown include the reinvestment of all dividends and other distributions. Index returns do not include expenses. As stated in the current prospectus, the Fund’s annual operating expense ratio (gross) and net expense ratio is 2.92%. (Actual expenses can be referenced in the Financial Highlights section later in this report.) The Fund’s advisor has agreed to waive a portion of its fees and/or reimburse expenses to the extent necessary to keep the Fund’s expenses from exceeding 1.85%. Returns less than one year are not annualized. The performance table and graph do not reflect the deduction of taxes that a shareholder would pay on Fund distributions or the redemption of Fund shares. For the Fund’s most recent month end performance, please call 1-877-843-3831. * ** Commencement of operations. The price used to calculate market return (‘‘Market Price’’) is determined by using the closing price listed on the NYSE Arca and does not represent returns an investor would receive if shares were traded at other times. Total returns are calculated using the daily 4:00 pm midpoint between the bid and offer. Shares are bought and sold at market price, not NAV and are not individually redeemed from the Fund. The S&P 500 Index is a broad-based, unmanaged measurement of changes in stock market conditions based on the average of 500 widely held common stocks. One cannot invest directly in an index. 37
42) ADVISORSHARES TRUST AdvisorShares Sage Core Reserves ETF (HOLD) The AdvisorShares Sage Core Reserves ETF (NYSE Arca: HOLD) returned 0.00% for the year ending June 30, 2015 on a NAV basis. The Barclays 1 − 3 Month U.S. Treasury Bill Index, a common short-term benchmark, in contrast returned 0.01% over the same period. During the 12 months ending June 30 2015, fixed income investors experienced significant volatility of credit spreads and interest rates. Changing Fed policy contributed to volatility as the Federal Reserve ended its QE3 asset-purchase program in October 2014, and has more recently shifted its communications to manage expectations toward tighter monetary policy in the future. Despite record monetary policy stimulus in the US and worldwide, economic growth and inflation have remained stubbornly low. The US unemployment rate fell from 6.3% to 5.5% over the same period. As of June 30, US GDP growth and CPI (year-over-year) were 2.9% and 0%, respectively. The 10-year Treasury yield began the period at 2.53%, dropped below 2% and ended the period at 2.35%. Investment-grade credit spreads began the period at 0.96% and ended it at 1.37%. During this time of turbulence we have maintained a high-quality, defensive fixed income allocation with average portfolio duration hovering slightly above half a year, including short futures positions. We maintained broad diversification through exposure to assets in the US government, corporate, mortgage-backed and asset-backed sectors, among others. Credit Spread is the spread between Treasury securities and non-Treasury securities that are identical in all respects except for quality rating. Duration is a measure of the sensitivity of the price (the value of principal) of a fixed-income investment to a change in interest rates. Duration is expressed as a number of years. The Short Futures position is an unlimited profit, unlimited risk position that can be entered by the futures speculator to profit from a fall in the price of the underlying. HYPOTHETICAL GROWTH OF $10,000 INVESTMENT For the period January 14, 2014* to June 30, 2015 $10,250 $10,125 $10,012 $10,010 $10,003 $10,000 $9,875 $9,750 1/14/2014 6/30/2014 12/31/2014 $10,010 AdvisorShares Sage Core Reserves NAV $10,012 AdvisorShares Sage Core Reserves Market Price $10,003 Barclays 1-3 Month U.S. Treasury Index 38 6/30/2015
43) HISTORICAL PERFORMANCE Total Return as of June 30, 2015 Year to Date 1 Month AdvisorShares Sage Core Reserves ETF NAV . . . . . . AdvisorShares Sage Core Reserves ETF Market Price** . . . . . . . . . . . . . . . . . . . . . . . . . . . . . Barclays 1 − 3 Month U.S. Treasury Bill Index . . . . . 1 Year Since Inception 1/14/2014 3 Month -0.03% 0.07% 0.24% 0.00% 0.07% -0.03% 0.00% 0.08% 0.00% 0.26% 0.01% 0.00% 0.01% 0.09% 0.02% Performance data quoted represents past performance and is no guarantee of future results. Current performance may be lower or higher than the performance data quoted. Investment return and principal value will fluctuate so that an investor’s shares, when redeemed, may be worth more or less than original cost. Fund NAV returns are calculated using the Fund’s daily 4:00 p.m. NAV. Returns shown include the reinvestment of all dividends and other distributions. Index returns do not include expenses. As stated in the current prospectus, the Fund’s annual operating expense ratio (gross) is 0.73% and the net expense ratio is 0.35%. (Actual expenses can be referenced in the Financial Highlights section later in this report.) The Fund’s advisor has agreed to waive a portion of its fees and/or reimburse expenses to the extent necessary to keep the Fund’s expenses from exceeding 0.35%. Returns less than one year are not annualized. The performance table and graph do not reflect the deduction of taxes that a shareholder would pay on Fund distributions or the redemption of Fund shares. For the Fund’s most recent month end performance, please call 1-877-843-3831. * ** Commencement of operations. The price used to calculate market return (‘‘Market Price’’) is determined by using the closing price listed on the NYSE Arca and does not represent returns an investor would receive if shares were traded at other times. Total returns are calculated using the daily 4:00 pm midpoint between the bid and offer. Shares are bought and sold at market price, not NAV and are not individually redeemed from the Fund. The Barclays 1 − 3 Month U.S. Treasury Bill Index includes all publicly issued zero-coupon U.S. Treasury Bills that have a remaining maturity of less than 3 months and more than 1 month, are rated investment grade, and have $250 million or more of outstanding face value. The Barclays Treasury Bill Index is an unmanaged index considered representative of the performance of the U.S. Treasury Bill issued by the U.S. Government. One cannot invest directly in an index. 39
44) ADVISORSHARES TRUST AdvisorShares STAR Global Buy-Write ETF (VEGA) The AdvisorShares STAR Global Buy-Write ETF (NYSE Arca: VEGA) gained 1.49% for the year ending June 30, 2015 on a Market Price basis and 1.60% on an NAV basis. By comparison, VEGA’s Policy Benchmark* gained 1.98% over the same period. In addition, for the year VEGA achieved a beta of just under 0.60 versus the S&P 500. VEGA is a broadly diversified ETF that includes other asset classes beyond the S&P 500, such as, individual equities, foreign developed and emerging market equities, global bonds and domestic fixed-income. We believe that VEGA, over full market cycles, can provide its benefit in declining markets by harnessing volatility in the form of earned option premiums from covered calls and cash-secured puts, and utilizing cash as a strategic asset intended to be reinvested when levels of implied volatility on its constituent ETFs is higher than average. Typically, VEGA will benefit from volatile markets while participating less in strongly trending markets. VEGA differs from other strictly formulaic BuyWrite funds in several ways, notably: 1. Invests in a global ‘‘go anywhere’’ portfolio 2. Invests in fixed-income as well as equity securities 3. Adjusts the percent covered of the underlying positions, depending on the current volatility regime, which allows for more appreciation potential when volatility is high. 4. Engages in ‘‘volatility-based reinvestment’’ by redeploying strategic cash reserves when volatility is high and prices are lower. 5. Uses protective puts as a tactical overlay Beta is a measure of the volatility, or systematic risk, of a security or a portfolio in comparison to the market as a whole. Beta is used in the capital asset pricing model (CAPM), a model that calculates the expected return of an asset based on its beta and expected market returns. A covered call is an options strategy whereby an investor holds a long position in an asset and writes (sells) call options on that same asset in an attempt to generate increased income from the asset. This is often employed when an investor has a short-term neutral view on the asset and for this reason hold the asset long and simultaneously have a short position via the option to generate income from the option premium. An investor who employs a cash-secured put writes a put contract, and at the same time deposits in his brokerage account the full cash amount for a possible purchase of underlying shares. The purpose of depositing this cash is to ensure that it’s available should the investor be assigned on the short put position and be obligated to purchase shares at the put’s strike price. While the cash is on deposit it may generally be invested in short-term, interest-bearing instruments. * VEGA’s Policy Benchmark comprises a 37.5% weighting to the MSCI World Index, 37.5% to the CBOE BuyWrite Index and 25% to the Barclays’ Intermediate Government/Credit Index. 40
45) HYPOTHETICAL GROWTH OF $10,000 INVESTMENT For the period September 17, 2012* to June 30, 2015 $15,000 $14,000 $13,680 $13,000 $12,000 $11,000 $10,729 $10,726 $10,000 $9,000 9/17/2012 6/30/2013 6/30/2014 6/30/2015 $10,726 AdvisorShares STAR Global Buy-Write ETF NAV $10,729 AdvisorShares STAR Global Buy-Write ETF Market Price $13,680 MSCI World Index (Net) HISTORICAL PERFORMANCE Total Return as of June 30, 2015 Year to Date 1 Month AdvisorShares STAR Global Buy-Write ETF NAV . . . . AdvisorShares STAR Global Buy-Write ETF Market Price** . . . . . . . . . . . . . . . . . . . . . . . . . . . . . MSCI World Index (Net) . . . . . . . . . . . . . . . . . . . 1 Year Since Inception 9/17/2012 3 Month -1.63% -0.11% 0.49% 1.60% 2.55% -1.63% -2.33% 0.07% 0.31% 0.60% 2.63% 1.49% 1.43% 2.56% 11.91% Performance data quoted represents past performance and is no guarantee of future results. Current performance may be lower or higher than the performance data quoted. Investment return and principal value will fluctuate so that an investor’s shares, when redeemed, may be worth more or less than original cost. Fund NAV returns are calculated using the Fund’s daily 4:00 p.m. NAV. Returns shown include the reinvestment of all dividends and other distributions. Index returns do not include expenses. As stated in the current prospectus, the Fund’s annual operating expense ratio (gross) is 1.94% and the net expense ratio is 2.00%. (Actual expenses can be referenced in the Financial Highlights section later in this report.) The Fund’s advisor has agreed to waive a portion of its fees and/or reimburse expenses to the extent necessary to keep the Fund’s expenses from exceeding 1.85%. Returns less than one year are not annualized. The performance table and graph do not reflect the deduction of taxes that a shareholder would pay on Fund distributions or the redemption of Fund shares. For the Fund’s most recent month end performance, please call 1-877-843-3831. * ** Commencement of operations. The price used to calculate market return (‘‘Market Price’’) is determined by using the closing price listed on the NYSE Arca and does not represent returns an investor would receive if shares were traded at other times. Total returns are calculated using the daily 4:00 pm midpoint between the bid and offer. Shares are bought and sold at market price, not NAV and are not individually redeemed from the Fund. The MSCI World Index is a free float-adjusted market capitalization weighted index that is designed to measure the equity market performance of developed markets. One cannot invest directly in an index. 41
46) ADVISORSHARES TRUST AdvisorShares Sunrise Global Multi-Strategy ETF (MULT) The AdvisorShares Sunrise Global Multi-Strategy ETF (NASDAQ: MULT) returned a -2.61% on a Market Price basis and -2.58% on an NAV basis from inception through June 30th, 2015 as compared to 7.92% for the Barclays Hedge BTOP50 Index. During the period in question, generally positive equity futures, bond futures and ETF trading results were undercut by sub-optimal currency future trading results. The primary culprit for the currency challenges was an inordinate amount of short term price vacillation, particularly in the case of the Swiss franc which since a series of unexpected interventionary moves by the Swiss monetary authorities in January 2015, has demonstrated unprecedented volatility swings that seasoned investors such as Sunrise have not seen in more than three decades of trading. Overall, the diversified nature of the total MULT portfolio muted the effects of currency challenges to some degree but the product’s outcome to date was nonetheless undermined. Looking forward Sunrise would expect the MULT portfolio to achieve even better balance and would expect the strategy to begin to gain traction across global equity, bond and currency markets, particularly if those markets begin to demonstrate more defined patterns of directional volatility as opposed to what have been largely ‘‘whippy’’ markets since MULT’s July 2014 inception. Futures are a financial contract obligating the buyer to purchase an asset (or the seller to sell an asset), such as a physical commodity or a financial instrument, at a predetermined future date and price. HYPOTHETICAL GROWTH OF $10,000 INVESTMENT For the period July 8, 2014* to June 30, 2015 $12,000 $11,000 $10,792 $10,000 $9,000 7/8/2014 $9,742 $9,739 12/31/2014 6/30/2015 $9,742 AdvisorShares Sunrise Global Multi-Strategy ETF NAV $9,739 AdvisorShares Sunrise Global Multi-Strategy ETF Market Price $10,792 BarclayHedge BTOP50 Index 42
47) HISTORICAL PERFORMANCE Total Return as of June 30, 2015 Year to Date Since Inception 7/8/2014 1 Month AdvisorShares Sunrise Global Multi-Strategy ETF NAV . . . . . . . . AdvisorShares Sunrise Global Multi-Strategy ETF Market Price** . . . . . . . . . . . . . . . . . . . . . . . . . . . . . . . . . . . . . Barclay Hedge BTOP50 Index . . . . . . . . . . . . . . . . . . . . . . . . 3 Month -0.12% -0.62% -2.37% -2.58% -0.38% -0.46% -0.54% -1.85% -0.21% 1.51% -2.61% 7.92% Performance data quoted represents past performance and is no guarantee of future results. Current performance may be lower or higher than the performance data quoted. Investment return and principal value will fluctuate so that an investor’s shares, when redeemed, may be worth more or less than original cost. Fund NAV returns are calculated using the Fund’s daily 4:00 p.m. NAV. Returns shown include the reinvestment of all dividends and other distributions. Index returns do not include expenses. As stated in the current prospectus, the Fund’s annual operating expense ratio (gross) is 2.47% and the net expense ratio is 1.89%. (Actual expenses can be referenced in the Financial Highlights section later in this report.) The Fund’s advisor has agreed to waive a portion of its fees and/or reimburse expenses to the extent necessary to keep the Fund’s expenses from exceeding 1.75%. Returns less than one year are not annualized. The performance table and graph do not reflect the deduction of taxes that a shareholder would pay on Fund distributions or the redemption of Fund shares. For the Fund’s most recent month end performance, please call 1-877-843-3831. * ** Commencement of operations. The price used to calculate market return (‘‘Market Price’’) is determined by using the closing price listed on the NYSE Arca and does not represent returns an investor would receive if shares were traded at other times. Total returns are calculated using the daily 4:00 pm midpoint between the bid and offer. Shares are bought and sold at market price, not NAV and are not individually redeemed from the Fund. The BTOP50 Index seeks to replicate the overall composition of the managed futures industry with regard to trading style and overall market exposure. The BTOP50 employs a top-down approach in selecting its constituents. The largest investable trading advisor programs, as measured by assets under management, are selected for inclusion in the BTOP50. In each calendar year the selected trading advisors represent, in aggregate, no less than 50% of the investable assets of the Barclay CTA Universe. One cannot invest directly in an index. 43
48) ADVISORSHARES TRUST AdvisorShares TrimTabs Float Shrink ETF (TTFS) In the past fiscal year, the S&P 500 Index gained 7.42%, while the Russell 3000 Index rose 7.29%. The AdvisorShares TrimTabs Float Shrink ETF (NYSE Arca: TTFS) outperformed both broad-market indices with a total return of 12.06% net of all fees. During the first half of 2015, the fund advanced 3.11%, more than double the return of the S&P 500 Index (1.23%), while outperforming the Russell 3000 Index by 1.17%. If we look back further, TTFS has established a 23.13% lead in cumulative performance versus the S&P 500 Index since its inception on October 4, 2011. In the first six months of 2015, new stock buyback authorizations, which contribute over 20% to total earnings growth, have already exceeded full-year totals for 2008, 2009, 2010, and 2012. The float shrink strategy we manage further serves to differentiate companies using free cash flow to repurchase stocks from those that use debt. HYPOTHETICAL GROWTH OF $10,000 INVESTMENT For the period October 4, 2011* to June 30, 2015 $24,000 $22,205 $22,204 $20,125 $22,000 $20,000 $18,000 $16,000 $14,000 $12,000 $10,000 $8,000 10/4/2011 6/30/2012 6/30/2013 6/30/2014 $22,204 AdvisorShares Trimtabs Float Shrink ETF NAV $22,205 AdvisorShares Trimtabs Float Shrink ETF Market Price $20,125 Russell 3000 Index 44 6/30/2015
49) HISTORICAL PERFORMANCE Total Return as of June 30, 2015 1 Month AdvisorShares TrimTabs Float Shrink ETF NAV . . AdvisorShares TrimTabs Float Shrink ETF Market Price** . . . . . . . . . . . . . . . . . . . . . . . . . . Russell 3000 Index . . . . . . . . . . . . . . . . . . . . 3 Month -1.66% -0.47% -1.72% -1.67% -0.50% 0.14% Year to Date Since Inception 10/4/2011 1 Year 3 Year 3.11% 12.06% 20.59% 23.78% 3.09% 1.94% 11.99% 7.29% 20.49% 17.73% 23.78% 20.56% Performance data quoted represents past performance and is no guarantee of future results. Current performance may be lower or higher than the performance data quoted. Investment return and principal value will fluctuate so that an investor’s shares, when redeemed, may be worth more or less than original cost. Fund NAV returns are calculated using the Fund’s daily 4:00 p.m. NAV. Returns shown include the reinvestment of all dividends and other distributions. Index returns do not include expenses. As stated in the current prospectus, the Fund’s annual operating expense ratio (gross) is 1.16% and the net expense ratio is 0.99%. (Actual expenses can be referenced in the Financial Highlights section later in this report.) The Fund’s advisor has agreed to waive a portion of its fees and/or reimburse expenses to the extent necessary to keep the Fund’s expenses from exceeding 0.99%. Returns less than one year are not annualized. The performance table and graph do not reflect the deduction of taxes that a shareholder would pay on Fund distributions or the redemption of Fund shares. For the Fund’s most recent month end performance, please call 1-877-843-3831. * ** Commencement of operations. The price used to calculate market return (‘‘Market Price’’) is determined by using the closing price listed on the NYSE Arca and does not represent returns an investor would receive if shares were traded at other times. Total returns are calculated using the daily 4:00 pm midpoint between the bid and offer. Shares are bought and sold at market price, not NAV and are not individually redeemed from the Fund. The Russell 3000 Index measures the performance of the largest 3,000 U.S. companies representing approximately 98% of the investable U.S. equity market. One cannot invest directly in an index. 45
50) ADVISORSHARES TRUST AdvisorShares WCM/BNY Mellon Focused Growth ADR ETF (AADR) The AdvisorShares WCM/BNY Mellon Focused Growth ADR ETF (NYSE Arca: AADR) returned +0.36% from July 1, 2014 to the period ended June 30, 2015, outperforming the MSCI EAFE Index which returned -4.22%. Importantly, AADR delivered a positive return in a down year. While our bottom-up structural biases (underweight Financials & Telecom, overweight Tech & Health Care) were a tailwind overall, the majority of our outperformance was driven by positive stock selection. The vast majority of AADR’s outperformance for the fiscal year ended June 30, 2014 was driven by stock selection, which was positive in each of the last four quarters. Noting once more that there are indeed environments — such as the first half of last year — that are hostile to AADR’s approach, we’re pleased to report that we’ve had four successive quarters of ‘‘good’’ conditions. There was no artificial size distinction (in ACWI ex US, Small outperformed Large, but just barely), but there was an unambiguous distinction in favor of profitability: higher ROE outperformed lower ROE. What we wrote nine months ago still holds true: ‘‘. . . mean reversion alone should benefit AADR over the next couple of years.’’ This seems to have gone as hoped and should continue for awhile longer. But best of all it reinforces our conviction that turmoil in the world creates exciting new investment opportunities and refocuses the market on structurally high-quality businesses (those with growing moats and strong long-term tailwinds) rather than mediocre businesses benefitting from temporary/cyclical phenomena. HYPOTHETICAL GROWTH OF $10,000 INVESTMENT For the period July 21, 2010* to June 30, 2015 $17,000 $15,973 $15,934 $15,017 $14,144 $16,000 $15,000 $14,000 $13,000 $12,000 $11,000 $10,000 $9,000 7/20/2010 6/30/2011 6/30/2012 6/30/2013 6/30/2014 6/30/2015 $15,973 AdvisorShares WCM/BNYM Focused Growth ADR ETF NAV $15,934 AdvisorShares WCM/BNYM Focused Growth ADR ETF Market Price $15,017 MSCI EAFE Index $14,144 BNY Mellon Classic ADR Index TR 46
51) HISTORICAL PERFORMANCE Total Return as of June 30, 2015 Year to Date 1 Month AdvisorShares WCM/BNY Mellon Focused Growth ADR ETF NAV . . . . . . . . . . . . AdvisorShares WCM/BNY Mellon Focused Growth ADR ETF Market Price** . . . . . . MSCI EAFE Index (Net) . . . . . . . . . . . . . BNY Mellon Classic ADR Index TR . . . . . . 1 Year 3 Year Since Inception 7/21/2010 3 Month .... -3.20% 0.76% 5.28% 0.36% 11.19% 9.93% .... .... .... -3.37% -2.83% -2.72% 0.58% 0.62% 1.32% 4.93% 5.52% 5.98% 0.19% -4.22% -4.24% 11.13% 11.97% 10.51% 9.88% 8.57% 7.26% Performance data quoted represents past performance and is no guarantee of future results. Current performance may be lower or higher than the performance data quoted. Investment return and principal value will fluctuate so that an investor’s shares, when redeemed, may be worth more or less than original cost. Fund NAV returns are calculated using the Fund’s daily 4:00 p.m. NAV. Returns shown include the reinvestment of all dividends and other distributions. Index returns do not include expenses. As stated in the current prospectus, the Fund’s annual operating expense ratio (gross) is 1.69% and the net expense ratio is 1.27%. (Actual expenses can be referenced in the Financial Highlights section later in this report.) The Fund’s advisor has agreed to waive a portion of its fees and/or reimburse expenses to the extent necessary to keep the Fund’s expenses from exceeding 1.25%. Returns less than one year are not annualized. The performance table and graph do not reflect the deduction of taxes that a shareholder would pay on Fund distributions or the redemption of Fund shares. For the Fund’s most recent month end performance, please call 1-877-843-3831. * ** Commencement of operations. The price used to calculate market return (‘‘Market Price’’) is determined by using the closing price listed on the NYSE Arca and does not represent returns an investor would receive if shares were traded at other times. Total returns are calculated using the daily 4:00 pm midpoint between the bid and offer. Shares are bought and sold at market price, not NAV and are not individually redeemed from the Fund. The MSCI EAFE Index is an unmanaged free float-adjusted market capitalization index that is designed to measure the equity market performance of developed markets, excluding the U.S. & Canada. One cannot invest directly in an index. The BNY Mellon Classic ADR Index combines the over the counter (OTC) traded ADRs with exchangelisted ADRs bringing transparency to the available universe of American Depositary Receipts, including those issued by many of the world’s premier companies. One cannot invest directly in an index. 47
52) ADVISORSHARES TRUST AdvisorShares YieldPro ETF (YPRO) The AdvisorShares YieldPro ETF (NASDAQ: YPRO) provided a total Market Price return of -5.20% and an NAV return of -4.92% over the twelve-month period ending June 30, 2015. This compares to the Barclays Capital U.S. Aggregate Bond Index, which returned 1.86% over the same time period. We have written in the past about the excesses we were observing in a variety of markets, most specifically the loan and high yield markets. We believed that the market was underpricing a variety of risks, including but not limited to, the risks of a rise in interest rates, a resurgence of the European debt crisis, and a potential liquidity crisis in the high yield market and the loan market. On May 18, 2015, the Sub-Advisor appointed new portfolio managers for YPRO. The new managers implemented several changes to YPRO’s portfolio, including: common stock holdings which were replaced with bonds; High yield bond holdings were reduced from 30% to 20%; the average effective duration of the bond holdings was reduced from 8 years to 3.3 years; and interest rate risk would be managed by targeted maturity management, as opposed to through the use of active hedging strategies, which had been the case prior to May 2015. As of June 30th, YPRO’s portfolio was 100% invested in domestic fixed income securities and cash equivalents. As of that date, we evaluated the risk of holding longer-term maturity fixed income securities as relatively high. As a result, we targeted a duration of 3.25 years. The only longer-term holdings in the portfolio, as of June 30th, consisted of a 15% allocation to the municipal bond market. Historically, municipals have tended to be less volatile than other segments of the longer-term bond market. Credit risk is also managed with targeted holdings. As of June 30, YPRO was targeting 20% in the high-yield sector with a specific maturity target of less than 5 years. 81% of the YPRO portfolio was invested in investment grade securities. We intend to continue to watch the Fund’s exposure to high yield bonds, as high yield bonds have historically been highly correlated with equity market volatility. Duration is a measure of the sensitivity of the price (the value of principal) of a fixed-income investment to a change in interest rates. Duration is expressed as a number of years. HYPOTHETICAL GROWTH OF $10,000 INVESTMENT For the period March 4, 2014* to June 30, 2015 $11,000 $10,500 $10,392 $10,000 $9,694 $9,677 $9,500 $9,000 3/4/2014 6/30/2014 12/31/2014 $9,694 AdvisorShares Yield Pro NAV $9,677 AdvisorShares Yield Pro Market Price $10,392 Barclays Capital U.S. Aggregate Bond Index 48 6/30/2015
53) HISTORICAL PERFORMANCE Total Return as of June 30, 2015 1 Month AdvisorShares YieldPro ETF NAV . . . . . . . . . . . . . . AdvisorShares YieldPro ETF Market Price** . . . . . . . Barclays Capital U.S. Aggregate Bond Index . . . . . . 3 Month -0.50% -0.63% -1.09% -1.52% -1.69% -1.68% Year to Date -1.76% -1.68% -0.10% 1 Year -4.92% -5.20% 1.86% Since Inception 3/4/2014 -2.32% -2.45% 2.95% Performance data quoted represents past performance and is no guarantee of future results. Current performance may be lower or higher than the performance data quoted. Investment return and principal value will fluctuate so that an investor’s shares, when redeemed, may be worth more or less than original cost. Fund NAV returns are calculated using the Fund’s daily 4:00 p.m. NAV. Returns shown include the reinvestment of all dividends and other distributions. Index returns do not include expenses. As stated in the current prospectus, the Fund’s annual operating expense ratio (gross) and net expense ratio is 1.51%. (Actual expenses can be referenced in the Financial Highlights section later in this report.) The Fund’s advisor has agreed to waive a portion of its fees and/or reimburse expenses to the extent necessary to keep the Fund’s expenses from exceeding 1.25%. Returns less than one year are not annualized. The performance table and graph do not reflect the deduction of taxes that a shareholder would pay on Fund distributions or the redemption of Fund shares. For the Fund’s most recent month end performance, please call 1-877-843-3831. * ** Commencement of operations. The price used to calculate market return (‘‘Market Price’’) is determined by using the closing price listed on the NYSE Arca and does not represent returns an investor would receive if shares were traded at other times. Total returns are calculated using the daily 4:00 pm midpoint between the bid and offer. Shares are bought and sold at market price, not NAV and are not individually redeemed from the Fund. The Barclays Capital U.S. Aggregate Bond Index is an unmanaged index considered representative of the performance of the U.S. investment grade bond market. One cannot invest directly in an index. 49
54) ADVISORSHARES TRUST Shareholder Expense Examples As a shareholder of the Fund, you incur transaction cost and ongoing costs, including management fees and other Fund expenses. The following example is intended to help you understand your ongoing costs (in dollars and cents) of investing in the Fund and to compare these costs with the ongoing costs of investing in other funds. The examples are based on an initial investment of $1,000 invested at January 1, 2015 and held for the period ended June 30, 2015. Actual Expenses The first line under each Fund in the table below provides information about actual account values and actual expenses. You may use the information, together with the amount you invested, to estimate the expenses that you incurred over the period. Simply divide your account value by $1,000 (for example, an $8,600 account value divided by $1,000 = 8.6), then multiply the result by the number under the heading entitled ‘‘Expenses Paid’’ to estimate the expenses attributable to your account during this period. Hypothetical Example for Comparison Purposes The second line under each Fund in the table provides information about hypothetical account values and hypothetical expenses based on the Fund’s actual expense ratio and an assumed rate of return of 5% per year before expenses, which is not the Fund’s actual return. The hypothetical account values and expenses may not be used to estimate the actual ending account balance or expenses for the period. You may use this information to compare the ongoing costs of investing in the Funds and other ETF funds. To do so, compare this 5% hypothetical example with the 5% hypothetical examples that appear in the shareholder reports of the other funds. Please note that the expenses shown in the table are meant to highlight your ongoing costs only and do not reflect any transactional costs. Therefore, the hypothetical example is useful in comparing ongoing costs only, and will not help you determine the relative total costs of owning different funds. In addition, if these transactional costs were included, your costs would have been higher. Beginning Account Value 1/1/2015 Ending Account Value 6/30/2015 $1,000.00 $ 991.00 1.50% $7.40 $1,000.00 $1,017.36 1.50% $7.50 .... $1,000.00 $ 946.60 0.99% $4.78 .... $1,000.00 $1,019.89 0.99% $4.96 .... $1,000.00 $1,020.00 1.25% $6.26 .... $1,000.00 $1,018.60 1.25% $6.26 .... $1,000.00 $1,059.70 0.65% $3.32 .... $1,000.00 $1,021.57 0.65% $3.26 Fund Name AdvisorShares Accuvest Global Long Short ETF Actual . . . . . . . . . . . . . . . . . . . . . . . . . . . . . . . Hypothetical (assuming a 5% return before expenses) . . . . . . . . . . . . . . . . . . . . . . . . . . . AdvisorShares Athena High Dividend ETF Actual . . . . . . . . . . . . . . . . . . . . . . . . . . . Hypothetical (assuming a 5% return before expenses) . . . . . . . . . . . . . . . . . . . . . . . AdvisorShares EquityPro ETF Actual . . . . . . . . . . . . . . . . . . . . . . . . . . . Hypothetical (assuming a 5% return before expenses) . . . . . . . . . . . . . . . . . . . . . . . AdvisorShares Gartman Gold/Euro ETF Actual . . . . . . . . . . . . . . . . . . . . . . . . . . . Hypothetical (assuming a 5% return before expenses) . . . . . . . . . . . . . . . . . . . . . . . 50 Annualized Expense Ratio for the Period(1) Expenses Paid
55) ADVISORSHARES TRUST Shareholder Expense Examples (continued) Beginning Account Value 1/1/2015 Ending Account Value 6/30/2015 .... $1,000.00 $1,006.10 0.65% $3.23 .... $1,000.00 $1,021.57 0.65% $3.26 .... $1,000.00 $ 998.90 1.50% $7.43 .... $1,000.00 $1,017.36 1.50% $7.50 $1,000.00 $1,017.10 1.25% $6.25 $1,000.00 $1,018.60 1.25% $6.26 .... $1,000.00 $ 988.60 0.95% $4.68 .... $1,000.00 $1,020.08 0.95% $4.76 .... $1,000.00 $1,075.80 1.25% $6.43 .... $1,000.00 $1,018.60 1.25% $6.26 $1,000.00 $1,024.60 1.35% $6.78 $1,000.00 $1,018.10 1.35% $6.76 $1,000.00 $ 985.60 1.25% $6.15 $1,000.00 $1,018.60 1.25% $6.26 $1,000.00 $1,013.40 0.75% $3.74 $1,000.00 $1,021.08 0.75% $3.76 1,004.70 1.10% $3.99 1,019.34 1.10% $5.51 $1,004.10 1.27% $6.31 $1,018.50 1.27% $6.36 $ 979.00 1.49% $7.31 $1,017.41 1.49% $7.45 Fund Name AdvisorShares Gartman Gold/Yen ETF Actual . . . . . . . . . . . . . . . . . . . . . . . . . . . Hypothetical (assuming a 5% return before expenses) . . . . . . . . . . . . . . . . . . . . . . . AdvisorShares Global Echo ETF Actual . . . . . . . . . . . . . . . . . . . . . . . . . . . Hypothetical (assuming a 5% return before expenses) . . . . . . . . . . . . . . . . . . . . . . . AdvisorShares Madrona Domestic ETF Actual . . . . . . . . . . . . . . . . . . . . . . . . . . . . . . . Hypothetical (assuming a 5% return before expenses) . . . . . . . . . . . . . . . . . . . . . . . . . . . AdvisorShares Madrona Global Bond ETF Actual . . . . . . . . . . . . . . . . . . . . . . . . . . . Hypothetical (assuming a 5% return before expenses) . . . . . . . . . . . . . . . . . . . . . . . AdvisorShares Madrona International ETF Actual . . . . . . . . . . . . . . . . . . . . . . . . . . . Hypothetical (assuming a 5% return before expenses) . . . . . . . . . . . . . . . . . . . . . . . AdvisorShares Meidell Tactical Advantage ETF Actual . . . . . . . . . . . . . . . . . . . . . . . . . . . . . . . Hypothetical (assuming a 5% return before expenses) . . . . . . . . . . . . . . . . . . . . . . . . . . . AdvisorShares Morgan Creek Global Tactical ETF Actual . . . . . . . . . . . . . . . . . . . . . . . . . . . . . . . Hypothetical (assuming a 5% return before expenses) . . . . . . . . . . . . . . . . . . . . . . . . . . . AdvisorShares Newfleet Multi-Sector Income ETF Actual . . . . . . . . . . . . . . . . . . . . . . . . . . . . . . . Hypothetical (assuming a 5% return before expenses) . . . . . . . . . . . . . . . . . . . . . . . . . . . AdvisorShares Pacific Asset Enhanced Floating Rate ETF(2) Actual . . . . . . . . . . . . . . . . . . . . . . . . . . . . . . . . $1,000.00 Hypothetical (assuming a 5% return before expenses) . . . . . . . . . . . . . . . . . . . . . . . . . . . $1,000.00 AdvisorShares Peritus High Yield ETF Actual . . . . . . . . . . . . . . . . . . . . . . . . . . . . . . . $1,000.00 Hypothetical (assuming a 5% return before expenses) . . . . . . . . . . . . . . . . . . . . . . . . . . . $1,000.00 AdvisorShares Pring Turner Business Cycle ETF Actual . . . . . . . . . . . . . . . . . . . . . . . . . . . . . . . $1,000.00 Hypothetical (assuming a 5% return before expenses) . . . . . . . . . . . . . . . . . . . . . . . . . . . $1,000.00 51 Annualized Expense Ratio for the Period(1) Expenses Paid
56) ADVISORSHARES TRUST Shareholder Expense Examples (continued) Beginning Account Value 1/1/2015 Ending Account Value 6/30/2015 .... $1,000.00 $1,023.90 1.50% $7.53 .... $1,000.00 $1,017.36 1.50% $7.50 .... $1,000.00 $ 948.60 1.65% $7.97 .... $1,000.00 $1,016.61 1.65% $8.25 $1,000.00 $1,002.40 0.35% $1.74 $1,000.00 $1,023.06 0.35% $1.76 $1,000.00 $1,004.90 1.85% $9.20 $1,000.00 $1,015.62 1.85% $9.25 $1,000.00 $ 976.30 1.75% $8.58 $1,000.00 $1,016.12 1.75% $8.75 $1,031.10 0.99% $4.99 $1,019.89 0.99% $4.96 $1,052.80 1.25% $6.36 $1,018.60 1.25% $6.26 $ 982.40 1.11% $5.46 $1,019.29 1.11% $5.56 Fund Name AdvisorShares QAM Equity Hedge ETF Actual . . . . . . . . . . . . . . . . . . . . . . . . . . . Hypothetical (assuming a 5% return before expenses) . . . . . . . . . . . . . . . . . . . . . . . AdvisorShares Ranger Equity Bear ETF Actual . . . . . . . . . . . . . . . . . . . . . . . . . . . Hypothetical (assuming a 5% return before expenses) . . . . . . . . . . . . . . . . . . . . . . . AdvisorShares Sage Core Reserves ETF Actual . . . . . . . . . . . . . . . . . . . . . . . . . . . . . . . Hypothetical (assuming a 5% return before expenses) . . . . . . . . . . . . . . . . . . . . . . . . . . . AdvisorShares STAR Global Buy-Write ETF Actual . . . . . . . . . . . . . . . . . . . . . . . . . . . . . . . Hypothetical (assuming a 5% return before expenses) . . . . . . . . . . . . . . . . . . . . . . . . . . . AdvisorShares Sunrise Global Multi-Strategy ETF Actual . . . . . . . . . . . . . . . . . . . . . . . . . . . . . . . Hypothetical (assuming a 5% return before expenses) . . . . . . . . . . . . . . . . . . . . . . . . . . . AdvisorShares TrimTabs Float Shrink ETF Actual . . . . . . . . . . . . . . . . . . . . . . . . . . . . . . . $1,000.00 Hypothetical (assuming a 5% return before expenses) . . . . . . . . . . . . . . . . . . . . . . . . . . . $1,000.00 AdvisorShares WCM/BNY Mellon Focused Growth ADR ETF Actual . . . . . . . . . . . . . . . . . . . . . . . . . . . . . . . $1,000.00 Hypothetical (assuming a 5% return before expenses) . . . . . . . . . . . . . . . . . . . . . . . . . . . $1,000.00 AdvisorShares YieldPro ETF Actual . . . . . . . . . . . . . . . . . . . . . . . . . . . . . . . $1,000.00 Hypothetical (assuming a 5% return before expenses) . . . . . . . . . . . . . . . . . . . . . . . . . . . $1,000.00 Annualized Expense Ratio for the Period(1) Expenses Paid (1) Expense ratios reflect expense caps through the period ended June 30, 2015. (2) Fund commenced operations on February 18, 2015. Expenses are calculated using the Fund’s annualized expense ratio, multiplied by the ending value for the period, multiplied by 132/365 (to reflect commencement of operation). 52
57) ADVISORSHARES ACCUVEST GLOBAL LONG SHORT ETF Schedule of Investments June 30, 2015 Investments Shares Value SUMMARY OF SCHEDULE OF INVESTMENTS EXCHANGE TRADED FUNDS — 78.1% Equity Fund — 78.1% Deutsche X-trackers MSCI Germany Hedged Equity ETF Deutsche X-trackers MSCI Japan Hedged Equity ETF(a) First Trust Large Cap Core AlphaDEX Fund(a) iShares Core S&P 500 ETF(a) iShares MSCI China ETF(a) iShares MSCI Hong Kong ETF(a) iShares MSCI Israel Capped ETF(a) iShares MSCI South Korea Capped ETF iShares MSCI Sweden ETF(a) iShares MSCI Taiwan ETF Total Exchange Traded Funds (Cost $11,054,011) 20,450 $ 513,295 28,371 1,185,340 59,411 4,590 28,805 65,154 18,819 2,723,401 951,140 1,614,232 1,469,874 967,861 6,200 21,137 26,233 % of Net Assets 78.1% 18.7 96.8 3.2 100.0% Equity Fund Money Market Fund Total Investments Other Assets in Excess of Liabilities Net Assets 341,682 671,522 413,957 10,852,304 MONEY MARKET FUND — 18.7% Dreyfus Cash Management — Investor Class, 0.00%(b) (Cost $2,591,519) 2,591,519 2,591,519 Total Investments — 96.8% (Cost $13,645,530) 13,443,823 Other Assets in Excess of Liabilities — 3.2% 448,572 Net Assets — 100.0% $13,892,395 ETF — Exchange Traded Fund (a) All or a portion of this security has been segregated as collateral for swap contracts. The aggregate market value of the collateral posted was $5,615,680 which includes cash in the amount of $367,724 as of June 30, 2015. (b) Rate shown reflects the 7-day yield as of June 30, 2015. Total Return Swaps contracts outstanding as of June 30, 2015: Number of Contracts Reference Entity iShares MSCI Austria Capped ETF iShares MSCI Brazil Capped ETF iShares MSCI Chile Capped ETF iShares MSCI Indonesia ETF iShares MSCI Malaysia ETF iShares MSCI Mexico Capped ETF iShares MSCI Singapore ETF iShares MSCI Switzerland Capped ETF Net Unrealized Appreciation (43,200) (21,380) (35,545) (29,053) (110,815) (12,082) (54,225) (20,060) Annual Financing Rate Received (Paid) (4.75)% (0.99) (2.00) (3.99) (0.99) (0.99) (1.24) (1.74) Termination Date 6/08/2017 6/08/2017 6/08/2017 6/08/2017 6/08/2017 6/08/2017 6/08/2017 6/08/2017 Notional Amounts Fair Value $ (711,081) $ (694,603) (701,050) (714,131) (1,406,110) (1,376,208) (712,089) (683,931) (1,397,377) (1,360,500) (697,131) (695,470) (691,911) (691,941) (708,519) (673,826) Unrealized Appreciation/ (Depreciation) $ 16,478 (13,081) 29,902 28,158 36,877 1,661 (30) 34,693 $134,658 Morgan Stanley acts as the counterparty to the total return swap contracts listed above. The Fund either receives fees from, or pays fees to, the counterparty, depending upon the total return of the benchmark, and the agreed-upon financing rate. See accompanying Notes to Financial Statements. 53
58) ADVISORSHARES ATHENA HIGH DIVIDEND ETF Schedule of Investments June 30, 2015 Investments Shares Value COMMON STOCKS — 99.3% Investments Value COMMON STOCKS (continued) Agriculture — 2.0% Philip Morris International, Inc. 3,869 Banks — 2.7% Banco de Chile (Chile)(a)(b) $ 310,178 6,175 426,516 870,835 3,887 321,183 9,630 49,422 429,787 605,419 7,373 Electric — 9.3% Brookfield Infrastructure Partners LP CPFL Energia SA (Brazil)(a)(b) Huaneng Power International, Inc. (China)(a)(b) Total Electric 444,319 26,624 Commercial Services — 2.1% Macquarie Infrastructure Corp. 406,809 51,307 Chemicals — 5.7% Braskem SA (Brazil)(b) Sociedad Quimica y Minera de Chile SA (Chile)(b) Total Chemicals 389,147 1,424,353 Private Equity — 6.8% Apollo Global Management LLC, Class A Carlyle Group LP (The) KKR & Co. LP Total Private Equity Engineering & Construction — 1.9% Grupo Aeroportuario del Pacifico 4,156 SAB de CV (Mexico)(b) 284,644 Internet — 2.9% SouFun Holdings Ltd. (China)(a)(b) 52,197 438,977 Investment Companies — 2.6% Prospect Capital Corp. 53,610 395,106 Toys/Games/Hobbies — 2.4% Mattel, Inc. Iron/Steel — 3.3% Vale SA (Brazil)(a)(b) 84,486 497,623 Transportation — 2.0% Golar LNG Ltd. (Bermuda) 6,328 332,663 Oil & Gas — 11.9% CNOOC Ltd. (China)(b) Ecopetrol SA (Colombia)(a)(b) LinnCo LLC Sasol Ltd. (South Africa)(b) Total Oil & Gas 2,823 46,096 37,237 12,269 400,640 611,233 351,890 454,689 1,818,452 Pipelines — 12.8% Energy Transfer Partners LP Kinder Morgan, Inc. MarkWest Energy Partners LP NGL Energy Partners LP(a) ONEOK Partners LP ONEOK, Inc. Total Pipelines 8,633 7,668 6,071 8,415 7,254 9,400 450,642 294,375 342,283 255,227 246,636 371,112 1,960,275 13,533 16,543 11,911 Real Estate Investment Trusts — 11.9% Communications Sales & Leasing, Inc. 11,043 Digital Realty Trust, Inc. 5,021 Geo Group, Inc. (The) 12,070 Lamar Advertising Co., Class A 5,153 Senior Housing Properties Trust 28,376 Total Real Estate Investment Trusts Telecommunications — 14.5% AT&T, Inc. CenturyLink, Inc. Frontier Communications Corp.(a) Telecom Argentina SA (Argentina)(b) Verizon Communications, Inc. Windstream Holdings, Inc. Total Telecommunications Lodging — 2.2% Las Vegas Sands Corp. Shares/ Principal Water — 2.3% Cia de Saneamento Basico do Estado de Sao Paulo (Brazil)(b) Total Common Stocks (Cost $16,162,136) MONEY MARKET FUND — 0.5% Goldman Sachs Financial Square Fund, 0.11%(c) (Cost $80,184) $ 299,756 465,686 272,166 1,037,608 272,983 334,800 412,311 296,194 498,000 1,814,288 9,852 13,162 349,943 386,700 53,062 262,657 28,583 6,077 64,556 514,207 283,249 411,867 2,208,623 14,461 371,503 6,573 307,616 68,265 353,613 15,154,349 80,184 80,184 REPURCHASE AGREEMENTS — 13.1%(d) Citibank NA, dated 06/30/15, due 07/01/15, 0.14%, total to be received $300,081, (collateralized by various U.S. Government Agency Obligations, 0.63% − 6.50%, 11/15/16 − 07/01/45, totaling $306,082) $300,080 300,080 See accompanying Notes to Financial Statements. 54
59) ADVISORSHARES ATHENA HIGH DIVIDEND ETF Schedule of Investments (continued) June 30, 2015 Investments Principal REPURCHASE AGREEMENTS (continued) HSBC Securities USA, Inc., dated 06/30/15, due 07/01/15, 0.10%, total to be received $465,625, (collateralized by various U.S. Government Agency Obligations, 0.00% − 9.38%, 07/15/15 − 01/15/37, totaling $474,938) $465,624 Mizuho Securities USA, Inc., dated 06/30/15, due 07/01/15, 0.14%, total to be received $465,626, (collateralized by various U.S. Government Agency Obligations, 0.00% − 8.50%, 06/13/16 − 04/20/44, totaling $474,937) 465,624 Morgan Stanley & Co. LLC, dated 06/30/15, due 07/01/15, 0.09%, total to be received $465,625, (collateralized by various U.S. Government Agency Obligations, 0.75% − 9.50%, 02/16/16 − 05/01/45, totaling $474,936) 465,624 RBC Capital Markets LLC, dated 06/30/15, due 07/01/15, 0.10%, total to be received $303,579, (collateralized by various U.S. Government Agency Obligations, 2.38% − 6.50%, 03/01/19 − 02/20/65, totaling $309,650) 303,578 Total Repurchase Agreements (Cost $2,000,530) Total Investments — 112.9% (Cost $18,242,850) Liabilities in Excess of Other Assets — (12.9)% Net Assets — 100.0% Value SUMMARY OF SCHEDULE OF INVESTMENTS $ 465,624 465,624 465,624 Agriculture Banks Chemicals Commercial Services Electric Engineering & Construction Internet Investment Companies Iron/Steel Lodging Oil & Gas Pipelines Private Equity Real Estate Investment Trusts Telecommunications Toys/Games/Hobbies Transportation Water Money Market Fund Repurchase Agreements Total Investments Liabilities in Excess of Other Assets Net Assets 303,578 2,000,530 17,235,063 (1,970,311) $15,264,752 LP — Limited Partnership (a) All or a portion of security is on loan. The aggregate market value of the securities on loan is $1,960,360; the aggregate market value of the collateral held by the fund is $2,035,998. The aggregate market value of the collateral includes non-cash U.S. Treasury securities collateral having a value of $35,468. (b) American Depositary Receipt. (c) Rate shown reflects the 7-day yield as of June 30, 2015. (d) Collateral received from brokers for securities lending was invested in these short-term investments. See accompanying Notes to Financial Statements. 55 % of Net Assets 2.0% 2.7 5.7 2.1 9.3 1.9 2.9 2.6 3.3 2.2 11.9 12.8 6.8 11.9 14.5 2.4 2.0 2.3 0.5 13.1 112.9 (12.9) 100.0%
60) ADVISORSHARES EQUITYPRO ETF Schedule of Investments June 30, 2015 Shares/ Principal Investments Value EXCHANGE TRADED FUNDS — 97.6% Equity Fund — 97.6% Alerian MLP ETF(a) Energy Select Sector SPDR Fund Guggenheim S&P 500 Equal Weight Consumer Staples ETF(a) Guggenheim S&P 500 Pure Growth ETF(a) Health Care Select Sector SPDR Fund Industrial Select Sector SPDR Fund(a) iShares MSCI EAFE ETF PowerShares Dynamic Pharmaceuticals Portfolio(a) SPDR S&P World ex-US ETF Technology Select Sector SPDR Fund Vanguard Total International Stock ETF Total Exchange Traded Funds (Cost $19,335,273) 47,274 10,015 $ 735,583 752,727 21,774 2,303,471 42,586 3,456,706 13,222 983,585 27,986 23,405 1,512,923 1,485,983 20,495 34,414 1,605,578 967,722 86,999 3,601,759 26,002 1,308,681 Investments Principal REPURCHASE AGREEMENTS (continued) Morgan Stanley & Co. LLC, dated 06/30/15, due 07/01/15, 0.09%, total to be received $548,799, (collateralized by various U.S. Government Agency Obligations, 0.75% − 9.50%, 02/16/16 − 05/01/45, totaling $559,774) $548,798 RBC Capital Markets LLC, dated 06/30/15, due 07/01/15, 0.10%, total to be received $357,803, (collateralized by various U.S. Government Agency Obligations, 2.38% − 6.50%, 03/01/19 − 02/20/65, totaling $364,958) 357,802 Total Repurchase Agreements (Cost $2,357,879) Total Investments — 112.3% (Cost $22,157,719) Liabilities in Excess of Other Assets — (12.3)% Net Assets — 100.0% Value $ 548,798 357,802 2,357,879 21,537,164 (2,358,229) $19,178,935 18,714,718 MONEY MARKET FUND — 2.4% Wells Fargo Advantage Government Money Market Fund — Institutional Class, 0.01%(b) (Cost $464,567) ETF — Exchange Traded Fund 464,567 REPURCHASE AGREEMENTS — 12.3%(c) Citibank NA, dated 06/30/15, due 07/01/15, 0.14%, total to be received $353,684, (collateralized by various U.S. Government Agency Obligations, 0.63% − 6.50%, 11/15/16 − 07/01/45, totaling $360,757) $353,683 HSBC Securities USA, Inc., dated 06/30/15, due 07/01/15, 0.10%, total to be received $548,800, (collateralized by various U.S. Government Agency Obligations, 0.00% − 9.38%, 07/15/15 − 01/15/37, totaling $559,776) 548,798 Mizuho Securities USA, Inc., dated 06/30/15, due 07/01/15, 0.14%, total to be received $548,800, (collateralized by various U.S. Government Agency Obligations, 0.00% − 8.50%, 06/13/16 − 04/20/44, totaling $559,774) 548,798 464,567 (a) All or a portion of security is on loan. The aggregate market value of the securities on loan is $2,305,926; the aggregate market value of the collateral held by the fund is $2,357,879. (b) Rate shown reflects the 7-day yield as of June 30, 2015. (c) Collateral received from brokers for securities lending was invested in these short-term investments. SUMMARY OF SCHEDULE OF INVESTMENTS 353,683 548,798 Equity Fund Money Market Fund Repurchase Agreements Total Investments Liabilities in Excess of Other Assets Net Assets 548,798 See accompanying Notes to Financial Statements. 56 % of Net Assets 97.6% 2.4 12.3 112.3 (12.3) 100.0%
61) ADVISORSHARES GARTMAN GOLD/EURO ETF Schedule of Investments (Consolidated)† June 30, 2015 Investments Shares Value MONEY MARKET FUND — 65.8% BNY Mellon Cash Reserve, 0.01% (Cost $11,026,789) 11,026,789 $ 11,026,789 Total Investments — 65.8% (Cost $11,026,789) 11,026,789 Other Assets in Excess of Liabilities — 34.2% 5,731,066 Net Assets — 100.0% $16,757,855 Futures contracts outstanding as of June 30, 2015: Type EURO Currency Gold 100 Oz. Broker Interactive Brokers LLC Interactive Brokers LLC Expiration Date Number of Contracts Value at Trade Date Value at June 30, 2015 Unrealized Appreciation (Depreciation) September 2015 (124) $(17,559,557) $(17,291,800) $ 267,757 August 2015 149 17,714,954 17,459,820 (255,134) $ 12,623 Cash posted as collateral to broker for futures contracts was $5,757,933 at June 30, 2015. † The Consolidated Schedule of Investments included the accounts of the wholly owned subsidiary. All inter-company accounts and transactions have been eliminated in consolidation. See the Notes to Financial Statements. See accompanying Notes to Financial Statements. 57
62) ADVISORSHARES GARTMAN GOLD/YEN ETF Schedule of Investments (Consolidated)† June 30, 2015 Investments Shares Value MONEY MARKET FUND — 67.2% BNY Mellon Cash Reserve, 0.01% (Cost $15,460,955) 15,460,955 $ 15,460,955 Total Investments — 67.2% (Cost $15,460,955) 15,460,955 Other Assets in Excess of Liabilities — 32.8% 7,560,698 Net Assets — 100.0% $23,021,653 Futures contracts outstanding as of June 30, 2015: Type Gold 100 Oz. Japanese Yen Currency Broker Interactive Brokers LLC Interactive Brokers LLC Expiration Date Number of Contracts Value at Trade Date Value at June 30, 2015 Unrealized Appreciation (Depreciation) August 2015 206 $ 24,480,016 $ 24,139,080 $(340,936) September 2015 (237) (24,173,417) (24,240,656) (67,239) $(408,175) Cash posted as collateral from broker for futures contracts was $7,591,526 at June 30, 2015. † The Consolidated Schedule of Investments included the accounts of the wholly owned subsidiary. All inter-company accounts and transactions have been eliminated in consolidation. See the Notes to Financial Statements. See accompanying Notes to Financial Statements. 58
63) ADVISORSHARES GLOBAL ECHO ETF Schedule of Investments June 30, 2015 Investments Shares Value COMMON STOCKS — 67.0% Investments Shares Value COMMON STOCKS (continued) Apparel — 1.7% Hanesbrands, Inc. NIKE, Inc., Class B VF Corp. Total Apparel 900 260 1,081 Auto Parts & Equipment — 1.2% Johnson Controls, Inc. Total Auto Parts & Equipment 1,923 Banks — 2.7% Northern Trust Corp. PNC Financial Services Group, Inc. (The) Tompkins Financial Corp. Total Banks $ 29,988 28,085 75,389 133,462 95,246 95,246 1,224 949 499 Beverages — 0.6% Reed’s, Inc.*(a) 93,587 90,772 26,806 211,165 7,660 47,722 Biotechnology — 2.7% Amgen, Inc. Illumina, Inc.* Isis Pharmaceuticals, Inc.*(a) Total Biotechnology 331 603 581 50,815 131,671 33,437 215,923 Building Materials — 0.9% Geberit AG (Switzerland)(b) Masco Corp. Total Building Materials 546 1,988 18,286 53,020 71,306 Chemicals — 3.2% Air Products & Chemicals, Inc. Minerals Technologies, Inc. Novozymes A/S (Denmark)(b) Total Chemicals 265 930 3,128 36,260 63,361 148,549 248,170 870 775 890 15,971 69,800 26,947 83,197 42,004 221,948 Commercial Services — 2.8% Automatic Data Processing, Inc. Korn/Ferry International MasterCard, Inc., Class A Where Food Comes From, Inc.* Total Commercial Services Computers — 3.0% Apple, Inc. EMC Corp. Hewlett-Packard Co. Stratasys Ltd. (Israel)*(a) Total Computers 920 2,793 663 848 Cosmetics/Personal Care — 1.4% Estee Lauder Cos., Inc. (The), Class A Procter & Gamble Co. (The) Total Cosmetics/Personal Care 480 870 115,391 73,707 19,897 29,621 238,616 41,597 68,069 109,666 Diversified Financial Services — 3.1% Ameriprise Financial, Inc. 694 Hannon Armstrong Sustainable Infrastructure Capital, Inc. 1,653 MarketAxess Holdings, Inc. 312 Stifel Financial Corp.* 1,580 Total Diversified Financial Services Electronics — 0.8% Rogers Corp.* Waters Corp.* Total Electronics 293 326 Energy — Alternate Sources — 0.5% 5,300 Enphase Energy, Inc.*(a) $ 86,701 33,143 28,944 91,230 240,018 19,379 41,852 61,231 40,333 Environmental Control — 1.4% Tomra Systems ASA (Norway)(b) Total Environmental Control 11,638 107,302 107,302 Food — 4.2% Boulder Brands, Inc.* Kroger Co. (The) Nestle SA (Switzerland)(b) Sprouts Farmers Market, Inc.* SunOpta, Inc.* Unilever PLC (United Kingdom)(b) WhiteWave Foods Co. (The)* Total Food 3,040 1,038 576 2,001 5,918 950 628 21,098 75,265 41,564 53,987 63,500 40,812 30,697 326,923 Healthcare — Products — 2.9% Becton, Dickinson and Co. Boston Scientific Corp.* Hologic, Inc.* Sirona Dental Systems, Inc.* Total Healthcare — Products 274 4,064 2,224 325 38,812 71,933 84,645 32,637 228,027 504 20,024 2,013 54,217 651 52,816 1,220 56,693 446 900 105 53,676 44,019 56,704 154,399 1,090 24,907 Healthcare — Services — 0.3% Amedisys, Inc.* Home Furnishings — 0.7% Dorel Industries, Inc., Class B (Canada) Household Products/Wares — 0.7% Church & Dwight Co., Inc. Insurance — 0.7% Voya Financial, Inc. Internet — 2.0% F5 Networks, Inc.* FireEye, Inc.*(a) Google, Inc., Class A* Total Internet Lodging — 0.3% Interval Leisure Group, Inc. See accompanying Notes to Financial Statements. 59
64) ADVISORSHARES GLOBAL ECHO ETF Schedule of Investments (continued) June 30, 2015 Investments Shares Value COMMON STOCKS (continued) Machinery — Diversified — 2.2% Rockwell Automation, Inc. Wabtec Corp. Xylem, Inc. Total Machinery — Diversified Pharmaceuticals — 4.7% Cardinal Health, Inc. Johnson & Johnson Novartis AG (Switzerland)(b) Perrigo Co. PLC (Ireland) Teva Pharmaceutical Industries Ltd. (Israel)(b) Total Pharmaceuticals Real Estate — 2.0% CBRE Group, Inc., Class A* Jones Lang LaSalle, Inc. Total Real Estate Retail — 5.1% Chipotle Mexican Grill, Inc.* Costco Wholesale Corp. CVS Health Corp. Kingfisher PLC (United Kingdom)(b) Starbucks Corp. Target Corp. Total Retail Semiconductors — 4.3% Broadcom Corp., Class A Intel Corp. IPG Photonics Corp.*(a) NXP Semiconductors NV (Netherlands)* QUALCOMM, Inc. Xilinx, Inc. Total Semiconductors Shares/ Principal Value COMMON STOCKS (continued) 574 278 2,031 Miscellaneous Manufacturing — 3.5% 3M Co. 155 AO Smith Corp. 400 AptarGroup, Inc. 1,248 CLARCOR, Inc. 400 Illinois Tool Works, Inc. 272 Ingersoll-Rand PLC (Ireland) 770 Raven Industries, Inc. 2,069 Total Miscellaneous Manufacturing Packaging & Containers — 0.7% Sealed Air Corp. Investments $ 71,543 26,199 75,289 173,031 23,917 28,792 79,585 24,896 24,967 51,913 42,063 276,133 1,070 54,977 795 565 930 419 66,502 55,065 91,455 77,444 1,328 78,484 368,950 1,878 534 69,486 91,314 160,800 78 480 1,039 47,189 64,829 108,969 3,750 1,100 1,065 40,950 58,977 86,936 407,850 744 693 776 38,309 21,078 66,096 726 1,111 1,544 Software — 2.6% Adobe Systems, Inc.* Fiserv, Inc.* Microsoft Corp. Total Software 993 1,198 534 Telecommunications — 2.0% Cisco Systems, Inc. LogMeIn, Inc.* Sierra Wireless, Inc. (Canada)*(a) Telenor ASA (Norway)(b) Total Telecommunications 900 506 2,824 436 24,714 32,632 70,204 28,604 156,154 684 660 141 39,501 21,549 24,026 85,076 1,020 255 38,137 12,401 970 31,742 82,280 Transportation — 1.1% Canadian National Railway Co. (Canada) CSX Corp. FedEx Corp. Total Transportation Water — 1.0% American States Water Co. American Water Works Co., Inc. Severn Trent PLC (United Kingdom)(a)(b) Total Water Total Common Stocks (Cost $4,775,907) 71,292 69,582 68,183 334,540 See accompanying Notes to Financial Statements. 60 80,443 99,230 23,576 203,249 5,263,154 ASSET BACKED SECURITIES — 14.9% $127,652 SBA, 4.08%, 07/25/38@ 171,679 SBA, 4.15%, 02/25/39@ SBAP, Class 1, Series 2009-20H, 4.45%, 08/01/29 180,027 SBAP, Class 1, Series 2010-20A, 4.38%, 01/01/30 141,428 SBAP, Class 1, Series 2010-20B, 4.14%, 02/01/30 273,792 U.S. SBA, Class 1, Series 2010-10A, 4.11%, 03/ 10/20 166,591 Total Asset Backed Securities (Cost $1,169,020) MUNICIPAL BOND — 3.8% Allegheny County Residential Finance Authority, 0.16%, 11/01/35@ (Cost $300,000) $ 300,000 148,113 198,564 196,752 154,274 297,817 174,859 1,170,379 300,000
65) ADVISORSHARES GLOBAL ECHO ETF Schedule of Investments (continued) June 30, 2015 Shares/ Principal Investments Value U.S. GOVERNMENT AGENCY SECURITIES — 10.1% Federal National Mortgage Association, 3.76%, 05/01/43 339,677 $ Government National Mortgage Association, Class AC, Series 2011-109, 3.25%, 04/16/43 250,000 Government National Mortgage Association, Class AE, Series 2015-41, 2.90%, 09/16/56 189,637 Total U.S. Government Agency Securities (Cost $819,493) MONEY MARKET FUNDS — 4.1% Fidelity Institutional Money Market Government Portfolio — Class I, 0.01%(c) Fidelity Institutional Money Market Portfolio — Institutional Class, 0.01%(c) Total Money Market Funds (Cost $324,692) 348,845 256,726 191,699 797,270 185,920 185,920 138,772 138,772 REPURCHASE AGREEMENT — 2.3%(d) RBC Capital Markets LLC, dated 06/30/15, due 07/01/15, 0.10%, total to be received $179,837, (collateralized by various U.S. Government Agency Obligations, 2.38% − 6.50%, 03/01/19 − 02/20/65, totaling $183,433) (Cost $179,836) $179,836 Total Investments — 102.2% (Cost $7,568,948) Liabilities in Excess of Other Assets — (2.2)% Net Assets — 100.0% 324,692 179,836 8,035,331 (176,459) $7,858,872 PLC — Public Limited Company * Non-income producing security. @ Variable rate instrument. The interest rate shown reflects the rate in effect at June 30, 2015. (a) All or a portion of security is on loan. The aggregate market value of the securities on loan is $280,465; the aggregate market value of the collateral held by the fund is $287,035. The aggregate market value of the collateral includes non-cash U.S. Treasury securities collateral having a value of $107,199. SUMMARY OF SCHEDULE OF INVESTMENTS Apparel Asset Backed Securities Auto Parts & Equipment Banks Beverages Biotechnology Building Materials Chemicals Commercial Services Computers Cosmetics/Personal Care Diversified Financial Services Electronics Energy − Alternate Sources Environmental Control Food Healthcare − Products Healthcare − Services Home Furnishings Household Products/Wares Insurance Internet Lodging Machinery − Diversified Miscellaneous Manufacturing Municipal Packaging & Containers Pharmaceuticals Real Estate Retail Semiconductors Software Telecommunications Transportation U.S. Government Agency Securities Water Money Market Fund Repurchase Agreements Total Investments Liabilities in Excess of Other Assets Net Assets (b) American Depositary Receipt. (c) Rate shown reflects the 7-day yield as of June 30, 2015. (d) Collateral received from broker for securities lending was invested in this short-term investment. See accompanying Notes to Financial Statements. 61 % of Net Assets 1.7% 14.9 1.2 2.7 0.6 2.7 0.9 3.2 2.8 3.0 1.4 3.1 0.8 0.5 1.4 4.2 2.9 0.3 0.7 0.7 0.7 2.0 0.3 2.2 3.5 3.8 0.7 4.7 2.0 5.1 4.3 2.6 2.0 1.1 10.1 1.0 4.1 2.3 102.2 (2.2) 100.0%
66) ADVISORSHARES MADRONA DOMESTIC ETF Schedule of Investments June 30, 2015 Investments Shares Value Investments COMMON STOCKS — 99.0% Banks — 5.1% Bank of America Corp. Bank of New York Mellon Corp. (The) BB&T Corp. Capital One Financial Corp. Citigroup, Inc. Comerica, Inc. Fifth Third Bancorp Goldman Sachs Group, Inc. (The) Huntington Bancshares, Inc. JPMorgan Chase & Co. KeyCorp M&T Bank Corp. Morgan Stanley Northern Trust Corp. PNC Financial Services Group, Inc. (The) Regions Financial Corp. State Street Corp. SunTrust Banks, Inc. US Bancorp Wells Fargo & Co. Total Banks Value COMMON STOCKS (continued) Advertising — 0.4% Interpublic Group of Cos., Inc. (The) Omnicom Group, Inc. Total Advertising Shares 4,397 432 Aerospace/Defense — 1.1% Boeing Co. (The) General Dynamics Corp. Harris Corp. L-3 Communications Holdings, Inc. Lockheed Martin Corp. Northrop Grumman Corp. Raytheon Co. Rockwell Collins, Inc. United Technologies Corp. Total Aerospace/Defense $ 84,730 30,020 114,750 458 312 80 63,534 44,207 6,153 88 353 226 389 452 438 9,977 65,623 35,850 37,220 41,742 48,587 352,893 Agriculture — 0.7% Altria Group, Inc. Archer-Daniels-Midland Co. Philip Morris International, Inc. Reynolds American, Inc. Total Agriculture 734 2,141 173 743 35,900 103,240 13,869 55,472 208,481 Airlines — 1.6% American Airlines Group, Inc. Delta Air Lines, Inc. Southwest Airlines Co. Total Airlines 4,050 4,320 4,636 161,737 177,466 153,405 492,608 Apparel — 1.3% Hanesbrands, Inc. Michael Kors Holdings Ltd.* NIKE, Inc., Class B Ralph Lauren Corp. Under Armour, Inc., Class A*(a) VF Corp. Total Apparel 2,716 3,068 399 434 332 708 Auto Manufacturers — 1.5% Ford Motor Co. General Motors Co. PACCAR, Inc. Total Auto Manufacturers 12,453 5,575 1,539 186,919 185,815 98,204 470,938 1,880 106,859 1,853 2,971 Beverages — 0.7% Brown-Forman Corp., Class B Coca-Cola Co. (The) Coca-Cola Enterprises, Inc. Constellation Brands, Inc., Class A Dr Pepper Snapple Group, Inc. Keurig Green Mountain, Inc. Molson Coors Brewing Co., Class B Monster Beverage Corp.* PepsiCo, Inc. Total Beverages 157,672 147,154 411,685 Auto Parts & Equipment — 1.3% BorgWarner, Inc. Delphi Automotive PLC (United Kingdom) Johnson Controls, Inc. Total Auto Parts & Equipment 90,497 129,132 43,100 57,444 27,702 49,376 397,251 Biotechnology — 2.3% Alexion Pharmaceuticals, Inc.* Amgen, Inc. Biogen, Inc.* Celgene Corp.* Gilead Sciences, Inc. Regeneron Pharmaceuticals, Inc.* Total Biotechnology See accompanying Notes to Financial Statements. 62 5,727 $ 97,474 4,003 1,972 742 3,564 717 1,658 346 4,385 689 2,359 998 5,001 724 168,006 79,491 65,274 196,875 36,796 34,520 72,241 49,594 46,687 35,432 124,680 193,989 55,357 380 3,635 565 3,797 776 782 36,347 37,659 43,505 163,347 33,678 43,980 1,614,932 175 357 272 17,532 14,005 11,816 333 421 718 38,635 30,691 55,019 114 270 181 7,958 36,185 16,895 228,736 659 379 286 1,608 1,843 80 119,127 58,184 115,527 186,102 215,779 40,810 735,529
67) ADVISORSHARES MADRONA DOMESTIC ETF Schedule of Investments (continued) June 30, 2015 Investments Shares Value COMMON STOCKS (continued) Building Materials — 0.7% Martin Marietta Materials, Inc. Masco Corp. Vulcan Materials Co. Total Building Materials Chemicals — 3.5% Air Products & Chemicals, Inc. Airgas, Inc. CF Industries Holdings, Inc. Dow Chemical Co. (The) E.I. du Pont de Nemours & Co. Eastman Chemical Co. Ecolab, Inc. FMC Corp. International Flavors & Fragrances, Inc. LyondellBasell Industries NV, Class A Monsanto Co. Mosaic Co. (The) PPG Industries, Inc. Praxair, Inc. Sherwin-Williams Co. (The) Sigma-Aldrich Corp. Total Chemicals Coal — 0.0%** CONSOL Energy, Inc.(a) Commercial Services — 3.1% ADT Corp. (The)(a) Automatic Data Processing, Inc. Cintas Corp. Equifax, Inc. H&R Block, Inc. MasterCard, Inc., Class A McGraw Hill Financial, Inc. Moody’s Corp. Quanta Services, Inc.* Robert Half International, Inc. Total System Services, Inc. United Rentals, Inc.* Western Union Co. (The) Total Commercial Services Computers — 3.6% Accenture PLC, Class A (Ireland) Apple, Inc. Cognizant Technology Solutions Corp., Class A* Computer Sciences Corp. EMC Corp. Investments Shares Value COMMON STOCKS (continued) 645 2,999 438 $ 91,275 79,983 36,761 208,019 515 390 3,080 654 472 1,643 487 751 70,467 41,254 197,983 33,465 30,184 134,430 55,065 39,465 296 32,350 345 661 4,072 340 358 261 93 35,714 70,456 190,774 39,005 42,799 71,780 12,960 1,098,151 628 13,653 707 353 514 400 2,645 978 663 414 4,749 2,333 1,390 1,845 3,236 23,734 28,321 43,479 38,836 78,424 91,423 66,598 44,695 136,867 129,482 58,060 161,660 65,788 967,367 398 1,306 38,518 163,806 2,114 952 4,564 129,144 62,489 120,444 Computers (continued) Hewlett-Packard Co. International Business Machines Corp. NetApp, Inc. SanDisk Corp. Seagate Technology PLC (Ireland) Teradata Corp.*(a) Western Digital Corp. Total Computers Cosmetics/Personal Care — 0.2% Colgate-Palmolive Co. Estee Lauder Cos., Inc. (The), Class A Procter & Gamble Co. (The) Total Cosmetics/Personal Care Distribution/Wholesale — 0.9% Fastenal Co. Fossil Group, Inc.*(a) Genuine Parts Co. W.W. Grainger, Inc. Total Distribution/Wholesale 1,016 See accompanying Notes to Financial Statements. 63 30,490 882 4,273 2,285 1,344 1,048 871 143,466 134,856 133,033 63,840 38,776 68,304 1,127,166 289 18,903 327 250 28,338 19,560 66,801 2,042 1,684 413 199 86,132 116,802 36,976 47,093 287,003 Diversified Financial Services — 6.0% Affiliated Managers Group, Inc.* 707 Alliance Data Systems Corp.* 436 American Express Co. 1,883 Ameriprise Financial, Inc. 1,464 BlackRock, Inc. 264 Charles Schwab Corp. (The) 3,268 CME Group, Inc. 442 Discover Financial Services 1,630 E*TRADE Financial Corp.* 5,057 Franklin Resources, Inc. 1,990 Intercontinental Exchange, Inc. 624 Invesco Ltd. 3,015 Legg Mason, Inc. 3,451 NASDAQ OMX Group, Inc. (The) 1,422 T. Rowe Price Group, Inc. 1,325 Visa, Inc., Class A 1,382 Total Diversified Financial Services Electric — 1.5% AES Corp. (The) Ameren Corp. American Electric Power Co., Inc. CMS Energy Corp. Consolidated Edison, Inc. Dominion Resources, Inc. DTE Energy Co. $ 2,149 794 320 860 188 318 246 154,550 127,286 146,347 182,897 91,339 106,700 41,133 93,921 151,457 97,570 139,533 113,032 177,830 69,408 102,992 92,801 1,888,796 28,496 29,918 16,950 27,382 10,881 21,265 18,361
68) ADVISORSHARES MADRONA DOMESTIC ETF Schedule of Investments (continued) June 30, 2015 Investments Shares Value COMMON STOCKS (continued) Electric (continued) Duke Energy Corp. Edison International Eversource Energy Exelon Corp. NextEra Energy, Inc. Pepco Holdings, Inc. PG&E Corp. Pinnacle West Capital Corp. PPL Corp. Public Service Enterprise Group, Inc. SCANA Corp. Southern Co. (The) Talen Energy Corp.* TECO Energy, Inc. WEC Energy Group, Inc. Xcel Energy, Inc. Total Electric 570 398 331 60 1,414 564 614 Electrical Components & Equipment — 0.3% AMETEK, Inc. 1,126 Emerson Electric Co. 685 Total Electrical Components & Equipment $ 16,172 12,672 25,838 14,328 24,606 22,064 33,682 21,049 14,234 22,390 20,159 13,869 1,030 24,971 25,363 19,759 465,439 61,682 37,970 99,652 984 539 485 2,728 3,746 994 717 833 37,963 32,415 28,115 53,823 115,453 43,666 73,112 43,849 1,390 768 2,374 278 89,377 99,656 91,352 35,690 744,471 Engineering & Construction — 0.7% Fluor Corp. 2,157 Jacobs Engineering Group, Inc.* 2,914 Total Engineering & Construction Environmental Control — 0.3% Republic Services, Inc. Stericycle, Inc.* Waste Management, Inc. Total Environmental Control Shares Value COMMON STOCKS (continued) 229 228 569 456 251 819 686 370 483 Electronics — 2.4% Agilent Technologies, Inc. Allegion PLC (Ireland) Amphenol Corp., Class A Corning, Inc. FLIR Systems, Inc. Garmin Ltd. (Switzerland) Honeywell International, Inc. PerkinElmer, Inc. TE Connectivity Ltd. (Switzerland) Thermo Fisher Scientific, Inc. Tyco International PLC Waters Corp.* Total Electronics Investments 374 317 523 114,343 118,366 232,709 14,650 42,449 24,241 81,340 Food — 1.6% Campbell Soup Co. ConAgra Foods, Inc. General Mills, Inc. Hershey Co. (The) Hormel Foods Corp. JM Smucker Co. (The) Kellogg Co. Kraft Foods Group, Inc. Kroger Co. (The) McCormick & Co., Inc. Mondelez International, Inc., Class A Safeway, Inc PDC, LLC CVR. Safeway, Inc SCRP. Sysco Corp. Tyson Foods, Inc., Class A Whole Foods Market, Inc. Total Food Forest Products & Paper — 0.5% International Paper Co. 233 963 347 378 396 203 205 165 542 350 $ 11,102 42,102 19,335 33,578 22,323 22,007 12,854 14,048 39,300 28,333 888 447 447 860 3,943 757 36,532 22 454 31,046 168,090 29,856 510,982 3,047 145,007 Gas — 0.2% AGL Resources, Inc. CenterPoint Energy, Inc. NiSource, Inc. Sempra Energy Total Gas 157 540 540 304 7,310 10,276 24,619 30,077 72,282 Hand/Machine Tools — 0.3% Snap-on, Inc. Stanley Black & Decker, Inc. Total Hand/Machine Tools 376 386 59,878 40,623 100,501 440 285 2,303 240 1,175 704 308 261 72 453 875 640 392 408 628 30,769 40,370 40,763 40,968 100,569 36,291 43,868 37,093 34,884 33,567 42,569 46,765 37,463 34,407 68,597 668,943 Healthcare − Products — 2.1% Baxter International, Inc. Becton Dickinson and Co. Boston Scientific Corp.* C.R. Bard, Inc. Danaher Corp. DENTSPLY International, Inc. Edwards Lifesciences Corp.* Henry Schein, Inc.* Intuitive Surgical, Inc.* Medtronic PLC Patterson Cos., Inc. St. Jude Medical, Inc. Stryker Corp. Varian Medical Systems, Inc.* Zimmer Biomet Holdings, Inc. Total Healthcare − Products See accompanying Notes to Financial Statements. 64
69) ADVISORSHARES MADRONA DOMESTIC ETF Schedule of Investments (continued) June 30, 2015 Investments Shares Value COMMON STOCKS (continued) 839 562 1,027 482 1,794 424 $ 106,939 92,247 166,373 38,305 162,751 81,103 836 1,160 704 677 101,340 84,123 40,748 82,594 378 53,714 1,010,237 Home Builders — 0.8% D.R. Horton, Inc. Lennar Corp., Class A PulteGroup, Inc. Total Home Builders 5,449 1,456 1,427 149,085 74,314 28,754 252,153 Home Furnishings — 1.2% Harman International Industries, Inc. Leggett & Platt, Inc. Whirlpool Corp. Total Home Furnishings 1,293 1,039 1,033 153,789 50,579 178,761 383,129 Household Products/Wares — 0.3% Avery Dennison Corp. Clorox Co. (The) Kimberly-Clark Corp. Total Household Products/Wares 738 158 202 44,974 16,435 21,406 82,815 1,075 Insurance — 6.9% ACE Ltd. (Switzerland) Aflac, Inc. Allstate Corp. (The) American International Group, Inc. Aon PLC Assurant, Inc. Berkshire Hathaway, Inc., Class B* Chubb Corp. (The) Genworth Financial, Inc., Class A* Hartford Financial Services Group, Inc. (The) Shares Value COMMON STOCKS (continued) Healthcare − Services — 3.2% Aetna, Inc. Anthem, Inc. Cigna Corp. DaVita HealthCare Partners, Inc.* HCA Holdings, Inc.* Humana, Inc. Laboratory Corp. of America Holdings* Quest Diagnostics, Inc. Tenet Healthcare Corp.* UnitedHealth Group, Inc. Universal Health Services, Inc., Class B Total Healthcare − Services Housewares — 0.1% Newell Rubbermaid, Inc. Investments 44,193 1,083 953 1,284 110,119 59,277 83,293 2,577 1,073 631 289 1,076 159,310 106,957 42,277 39,336 102,371 14,034 106,237 4,044 168,109 Insurance (continued) Lincoln National Corp. Marsh & McLennan Cos., Inc. MetLife, Inc. Principal Financial Group, Inc. Progressive Corp. (The) Prudential Financial, Inc. Torchmark Corp. Travelers Cos., Inc. (The) Unum Group XL Group PLC (Ireland) Total Insurance 2,957 1,501 2,875 2,987 1,647 2,242 1,171 1,012 4,882 954 Internet — 3.0% eBay, Inc.* Expedia, Inc. F5 Networks, Inc.* Facebook, Inc., Class A* Google, Inc., Class A* Google, Inc., Class C* Priceline Group, Inc. (The)* Symantec Corp. TripAdvisor, Inc.* VeriSign, Inc.*(a) Total Internet 1,151 844 1,178 1,520 223 236 90 1,285 1,034 776 69,336 92,291 141,773 130,363 120,429 122,840 103,623 29,876 90,103 47,895 948,529 Iron/Steel — 0.3% Allegheny Technologies, Inc. Nucor Corp. Total Iron/Steel 1,644 843 49,649 37,151 86,800 4,063 2,782 200,672 156,766 2,804 220,646 578,084 901 67,025 239 611 632 19,381 50,047 62,359 198,812 Leisure Time — 1.8% Carnival Corp. (Panama) Harley-Davidson, Inc. Royal Caribbean Cruises Ltd. (Liberia) Total Leisure Time Lodging — 0.6% Marriott International, Inc., Class A(a) Starwood Hotels & Resorts Worldwide, Inc. Wyndham Worldwide Corp. Wynn Resorts Ltd. Total Lodging Machinery − Construction & Mining — 0.3% Caterpillar, Inc. 466 1,738 Joy Global, Inc.(a) Total Machinery − Construction & Mining See accompanying Notes to Financial Statements. 65 $ 175,113 85,107 160,971 153,203 45,836 196,219 68,176 97,820 174,531 35,489 2,169,751 39,526 62,916 102,442
70) ADVISORSHARES MADRONA DOMESTIC ETF Schedule of Investments (continued) June 30, 2015 Investments Shares Value COMMON STOCKS (continued) Machinery − Diversified — 1.3% Cummins, Inc. Deere & Co. Flowserve Corp. Rockwell Automation, Inc. Roper Industries, Inc. Xylem, Inc. Total Machinery − Diversified Media — 4.6% Cablevision Systems Corp., Class A CBS Corp., Class B Comcast Corp., Class A DIRECTV* Discovery Communications, Inc., Class A*(a) Discovery Communications, Inc., Class C* Gannett Co., Inc.* News Corp., Class A* Nielsen N.V. Scripps Networks Interactive, Inc., Class A TEGNA, Inc. Time Warner Cable, Inc. Time Warner, Inc. Twenty-First Century Fox, Inc., Class A Viacom, Inc., Class B Walt Disney Co. (The) Total Media Mining — 0.7% Alcoa, Inc. Freeport-McMoRan, Inc. Newmont Mining Corp. Total Mining Shares Value COMMON STOCKS (continued) 1,057 588 1,761 331 264 1,085 $ 138,669 57,065 92,734 41,256 45,529 40,221 415,474 911 2,312 2,053 586 21,809 128,316 123,467 54,375 5,217 173,518 5,578 485 1,351 2,189 173,364 6,785 19,711 98,002 1,177 970 237 1,846 76,940 31,108 42,226 161,359 4,225 2,370 577 137,503 153,197 65,859 1,467,539 532 106,331 4,426 7,996 944 Metal Fabricate/Hardware — 0.3% Precision Castparts Corp. Investments 49,350 148,885 22,052 220,287 Miscellaneous Manufacturing — 2.2% 3M Co. 246 Dover Corp. 841 Eaton Corp. PLC (Ireland) 1,110 General Electric Co. 1,327 Illinois Tool Works, Inc. 447 Ingersoll-Rand PLC (Ireland) 1,483 Pall Corp. 393 Parker-Hannifin Corp. 741 Pentair PLC (United Kingdom) 954 37,958 59,021 74,914 35,258 41,030 99,984 48,909 86,201 65,588 Miscellaneous Manufacturing (continued) Textron, Inc. 3,111 Total Miscellaneous Manufacturing $ 138,843 687,706 Office/Business Equipment — 0.8% Pitney Bowes, Inc. 6,188 Xerox Corp. 11,715 Total Office/Business Equipment 128,772 124,648 253,420 Oil & Gas — 1.9% Cabot Oil & Gas Corp. Devon Energy Corp. EQT Corp. Marathon Petroleum Corp. Newfield Exploration Co.* Phillips 66 Range Resources Corp. Tesoro Corp. Valero Energy Corp. Total Oil & Gas 549 104 406 1,602 286 1,096 108 2,055 3,070 17,315 6,187 33,024 83,801 10,330 88,294 5,333 173,463 192,182 609,929 539 888 608 22,363 38,246 52,404 113,013 654 579 3,174 895 45,878 27,323 72,812 45,985 191,998 843 2,398 589 651 403 514 481 532 1,321 389 250 1,529 622 311 491 1,303 41,374 161,122 178,738 69,227 26,816 42,996 40,159 42,374 117,490 34,508 24,365 179,993 139,832 28,058 27,953 88,422 Oil & Gas Services — 0.4% FMC Technologies, Inc.* Halliburton Co. Schlumberger Ltd. Total Oil & Gas Services Packaging & Containers — 0.6% Ball Corp. MeadWestvaco Corp. Owens-Illinois, Inc.* Sealed Air Corp. Total Packaging & Containers Pharmaceuticals — 4.1% Abbott Laboratories AbbVie, Inc. Allergan PLC* AmerisourceBergen Corp. Bristol-Myers Squibb Co. Cardinal Health, Inc. Eli Lilly & Co. Endo International PLC* Express Scripts Holding Co.*(a) Hospira, Inc.* Johnson & Johnson Mallinckrodt PLC (Ireland)* McKesson Corp. Mead Johnson Nutrition Co. Merck & Co., Inc. Mylan NV* See accompanying Notes to Financial Statements. 66
71) ADVISORSHARES MADRONA DOMESTIC ETF Schedule of Investments (continued) June 30, 2015 Investments Shares Value COMMON STOCKS (continued) Shares Value COMMON STOCKS (continued) Pharmaceuticals (continued) Perrigo Co. PLC (Ireland) Pfizer, Inc. Total Pharmaceuticals 242 448 Pipelines — 0.1% Kinder Morgan, Inc. Spectra Energy Corp. Williams Cos., Inc. (The) Total Pipelines 319 279 322 12,246 9,095 18,480 39,821 Real Estate — 0.2% CBRE Group, Inc., Class A* Investments $ 44,729 15,021 1,303,177 1,868 69,116 Real Estate Investment Trust — 0.8% American Tower Corp. 331 AvalonBay Communities, Inc. 56 Equinix, Inc. 98 Equity Residential 122 General Growth Properties, Inc. 315 HCP, Inc. 243 Health Care REIT, Inc. 124 Host Hotels & Resorts, Inc. 598 Iron Mountain, Inc. 1,047 Kimco Realty Corp. 274 Plum Creek Timber Co., Inc. 589 Prologis, Inc. 202 Public Storage 57 Simon Property Group, Inc. 69 SL Green Realty Corp. 60 Ventas, Inc. 112 Vornado Realty Trust 92 Weyerhaeuser Co. 424 Total Real Estate Investment Trust 30,879 8,953 24,892 8,561 8,083 8,862 8,138 11,858 32,457 6,176 23,896 7,494 10,509 11,938 6,593 6,954 8,734 13,356 238,333 Retail — 8.3% AutoNation, Inc.* AutoZone, Inc.* Bed Bath & Beyond, Inc.* Best Buy Co., Inc. CarMax, Inc.* Chipotle Mexican Grill, Inc.* Coach, Inc. Costco Wholesale Corp. CVS Health Corp. Darden Restaurants, Inc. Dollar General Corp. Dollar Tree, Inc.* Family Dollar Stores, Inc. GameStop Corp., Class A(a) Gap, Inc. (The) Home Depot, Inc. (The) 164,819 99,368 42,423 139,571 74,817 52,634 36,583 29,443 114,634 98,019 97,952 77,252 6,226 191,944 86,837 93,016 2,617 149 615 4,280 1,130 87 1,057 218 1,093 1,379 1,260 978 79 4,468 2,275 837 Retail (continued) Kohl’s Corp. L Brands, Inc. Lowe’s Cos., Inc. Macy’s, Inc. McDonald’s Corp. Nordstrom, Inc. O’Reilly Automotive, Inc.* PVH Corp. Ross Stores, Inc. Starbucks Corp. Target Corp. Tiffany & Co. TJX Cos., Inc. (The) Tractor Supply Co. Urban Outfitters, Inc.* Walgreens Boots Alliance, Inc. Wal-Mart Stores, Inc. Yum! Brands, Inc. Total Retail Savings & Loans — 0.1% People’s United Financial, Inc. Semiconductors — 4.7% Altera Corp. Analog Devices, Inc. Applied Materials, Inc. Avago Technologies Ltd. (Singapore) Broadcom Corp., Class A Intel Corp. KLA-Tencor Corp. Lam Research Corp. Linear Technology Corp. Microchip Technology, Inc.(a) Micron Technology, Inc.* NVIDIA Corp. QUALCOMM, Inc. Skyworks Solutions, Inc. Texas Instruments, Inc. Xilinx, Inc. Total Semiconductors Software — 1.9% Adobe Systems, Inc.* Akamai Technologies, Inc.* Autodesk, Inc.* Cerner Corp.* Citrix Systems, Inc.* Dun & Bradstreet Corp. (The) See accompanying Notes to Financial Statements. 67 882 404 1,996 1,822 245 565 378 1,289 872 1,249 974 350 716 518 2,763 773 223 410 $ 55,222 34,635 133,672 122,930 23,292 42,093 85,420 148,493 42,388 66,965 79,508 32,130 47,378 46,589 96,705 65,272 15,817 36,933 2,580,980 2,750 44,578 452 682 5,090 23,142 43,774 97,830 1,551 3,715 1,266 1,387 1,367 915 1,342 6,463 4,142 1,947 1,765 760 881 206,175 191,285 38,505 77,963 111,205 40,470 63,644 121,763 83,296 121,941 183,737 39,148 38,905 1,482,783 507 576 296 582 1,507 268 41,072 40,216 14,822 40,193 105,732 32,696
72) ADVISORSHARES MADRONA DOMESTIC ETF Schedule of Investments (continued) June 30, 2015 Investments Shares Value 868 917 553 299 789 839 654 379 218 Telecommunications — 1.2% AT&T, Inc. Cisco Systems, Inc. Frontier Communications Corp.(a) Juniper Networks, Inc. Level 3 Communications, Inc.* Verizon Communications, Inc. Total Telecommunications $ 57,722 56,671 45,805 30,130 34,834 33,812 30,660 28,777 15,179 608,321 525 1,536 75,787 555 1,035 Transportation — 2.0% C.H. Robinson Worldwide, Inc. CSX Corp. Expeditors International of Washington, Inc. FedEx Corp. Kansas City Southern Norfolk Southern Corp. Ryder System, Inc. Union Pacific Corp. United Parcel Service, Inc., Class B Total Transportation Total Common Stocks (Cost $28,087,231) 16,815 156,261 35,974 108,135 378,012 397 Toys/Games/Hobbies — 0.2% Hasbro, Inc. Mattel, Inc. Total Toys/Games/Hobbies 18,648 42,179 3,397 6,017 683 2,320 Textiles — 0.2% Mohawk Industries, Inc.* 41,509 26,589 68,098 629 1,488 39,243 48,583 618 1,030 502 428 1,414 1,133 28,493 175,513 45,782 37,390 123,541 108,054 370 REPURCHASE AGREEMENTS — 2.4% Citibank NA, dated 06/30/15, due 07/01/15, 0.14%, total to be received $115,382, (collateralized by various U.S. Government Agency Obligations, 0.63% − 6.50%, 11/15/16 − 07/01/45, totaling $117,690) $115,382 HSBC Securities USA, Inc., dated 06/30/15, due 07/01/15, 0.12%, total to be received $153,831, (collateralized by various U.S. Government Agency Obligations, 2.50% − 6.50%, 07/01/18 − 07/01/45, totaling $156,907) 153,830 Mizuho Securities USA, Inc., dated 06/30/15, due 07/01/15, 0.14%, total to be received $250,001, (collateralized by various U.S. Government Agency Obligations, 0.00% − 8.50%, 06/13/16 − 04/20/44, totaling $255,000) 250,000 Morgan Stanley & Co. LLC, dated 06/30/15, due 07/01/15, 0.09%, total to be received $250,001, (collateralized by various U.S. Government Agency Obligations, 0.75% − 9.50%, 02/16/16 − 05/01/45, totaling $255,000) 250,000 Total Repurchase Agreements (Cost $769,212) Total Investments — 102.5% (Cost $29,201,833) Liabilities in Excess of Other Assets — (2.5)% Net Assets — 100.0% Value 35,857 642,456 $ 115,382 153,830 250,000 250,000 769,212 32,374,791 (800,300) $31,574,491 PLC — Public Limited Company * Non-income producing security. ** Less than 0.05% (a) All or a portion of security is on loan. The aggregate market value of the securities on loan is $905,203; the aggregate market value of the collateral held by the fund is $928,924. The aggregate market value of the collateral includes non-cash U.S. Treasury securities collateral having a value of $159,712. (b) Rate shown reflects the 7-day yield as of June 30, 2015. (c) Collateral received from brokers for securities lending was invested in these short-term investments. 31,260,189 MONEY MARKET FUND — 1.1% Fidelity Institutional Prime Money Market Portfolio − Class I, 0.07%(b) (Cost $345,390) Principal (c) COMMON STOCKS (continued) Software (continued) Electronic Arts, Inc.* Fidelity National Information Services, Inc. Fiserv, Inc.* Intuit, Inc. Microsoft Corp. Oracle Corp. Paychex, Inc. Red Hat, Inc.* salesforce.com, Inc.* Total Software Investments 345,390 345,390 See accompanying Notes to Financial Statements. 68
73) ADVISORSHARES MADRONA DOMESTIC ETF Schedule of Investments (continued) June 30, 2015 SUMMARY OF SCHEDULE OF INVESTMENTS Advertising Aerospace/Defense Agriculture Airlines Apparel Auto Manufacturers Auto Parts & Equipment Banks Beverages Biotechnology Building Materials Chemicals Coal Commercial Services Computers Cosmetics/Personal Care Distribution/Wholesale Diversified Financial Services Electric Electrical Components & Equipment Electronics Engineering & Construction Environmental Control Food Forest Products & Paper Gas Hand/Machine Tools Healthcare − Products Healthcare − Services Home Builders Home Furnishings Household Products/Wares Housewares % of Net Assets 0.4% 1.1 0.7 1.6 1.3 1.5 1.3 5.1 0.7 2.3 0.7 3.5 0.0** 3.1 3.6 0.2 0.9 6.0 1.5 0.3 2.4 0.7 0.3 1.6 0.5 0.2 0.3 2.1 3.2 0.8 1.2 0.3 0.1 Insurance Internet Iron/Steel Leisure Time Lodging Machinery − Construction & Mining Machinery − Diversified Media Metal Fabricate/Hardware Mining Miscellaneous Manufacturing Office/Business Equipment Oil & Gas Oil & Gas Services Packaging & Containers Pharmaceuticals Pipelines Real Estate Real Estate Investment Trust Retail Savings & Loans Semiconductors Software Telecommunications Textiles Toys/Games/Hobbies Transportation Money Market Fund Repurchase Agreements Total Investments Liabilities in Excess of Other Assets Net Assets See accompanying Notes to Financial Statements. 69 % of Net Assets 6.9% 3.0 0.3 1.8 0.6 0.3 1.3 4.6 0.3 0.7 2.2 0.8 1.9 0.4 0.6 4.1 0.1 0.2 0.8 8.3 0.1 4.7 1.9 1.2 0.2 0.2 2.0 1.1 2.4 102.5 (2.5) 100.0%
74) ADVISORSHARES MADRONA GLOBAL BOND ETF Schedule of Investments June 30, 2015 Investments Shares Value MONEY MARKET FUND — 1.2% Fidelity Institutional Prime Money Market Portfolio − Class I, 0.07%(b) (Cost $326,686) 28,330 $ 3,278,348 12,308 27,149 1,105,135 1,351,613 10,960 572,331 47,222 1,359,049 59,377 1,645,337 154,898 2,814,497 44,508 1,128,723 52,796 1,396,454 45,556 1,126,144 59,908 1,425,211 52,864 2,514,740 36,285 1,394,433 15,228 836,169 20,068 1,112,369 13,147 847,719 10,821 790,582 37,560 158 1,984,295 12,670 15,497 1,117,024 27,812,843 326,686 Principal Value (c) EXCHANGE TRADED FUNDS — 99.0% Debt Fund — 99.0% iShares iBoxx $Investment Grade Corporate Bond ETF iShares International Treasury Bond ETF iShares Utilities Bond ETF PIMCO 1 − 5 Year U.S. TIPS Index ETF(a) PowerShares Build America Bond Portfolio(a) PowerShares Emerging Markets Sovereign Debt Portfolio PowerShares Financial Preferred Portfolio(a) PowerShares Fundamental Investment Grade Corporate Bond Portfolio PowerShares International Corporate Bond Portfolio(a) PowerShares National AMT-Free Municipal Bond Portfolio(a) PowerShares Senior Loan Portfolio(a) SPDR Barclays Convertible Securities ETF(a) SPDR Barclays High Yield Bond ETF(a) SPDR DB International Government Inflation-Protected Bond ETF(a) SPDR Nuveen S&P High Yield Municipal Bond ETF Vanguard Intermediate-Term Government Bond ETF(a) Vanguard Long-Term Government Bond ETF(a) Vanguard Mortgage-Backed Securities ETF(a) Vanguard Short-Term Bond ETF WisdomTree Emerging Markets Corporate Bond Fund Total Exchange Traded Funds (Cost $28,048,695) Investments 326,686 REPURCHASE AGREEMENTS — 29.6% Citibank NA, dated 06/30/15, due 07/01/15, 0.14%, total to be received $1,249,163, (collateralized by various U.S. Government Agency Obligations, 0.63% − 6.50%, 11/15/16 − 07/01/45, totaling $1,274,141) $1,249,158 $ 1,249,158 Mizuho Securities USA, Inc., dated 06/30/15, due 07/01/15, 0.14%, total to be received $1,938,285, (collateralized by various U.S. Government Agency Obligations, 0.00% − 8.50%, 06/13/16 − 04/20/44, totaling $1,977,042) 1,938,277 1,938,277 Morgan Stanley & Co. LLC, dated 06/30/15, due 07/01/15, 0.09%, total to be received $1,938,282, (collateralized by various U.S. Government Agency Obligations, 0.75% − 9.50%, 02/16/16 − 05/01/45, totaling $1,977,043) 1,938,277 1,938,277 HSBC Securities USA, Inc., dated 06/30/15, due 07/01/15, 0.10%, total to be received $1,938,282, (collateralized by various U.S. Government Agency Obligations, 0.00% − 9.38%, 07/15/15 − 01/15/37, totaling $1,977,050) 1,938,277 1,938,277 RBC Capital Markets LLC, dated 06/30/15, due 07/01/15, 0.10%, total to be received $1,263,712, (collateralized by various U.S. Government Agency Obligations, 2.38% − 6.50%, 03/01/19 − 02/20/65, totaling $1,288,982) 1,263,708 1,263,708 Total Repurchase Agreements (Cost $8,327,697) 8,327,697 Total Investments — 129.8% (Cost $36,703,078) 36,467,226 Liabilities in Excess of Other Assets — (29.8)% (8,371,507) Net Assets — 100.0% $28,095,719 ETF — Exchange Traded Fund TIPS — Treasury Inflation Protected Securities (a) All or a portion of security is on loan. The aggregate market value of the securities on loan is $8,092,592; the aggregate market value of the collateral held by the fund is $8,327,697. (b) Rate shown reflects the 7-day yield as of June 30, 2015. (c) Collateral received from brokers for securities lending was invested in these short-term investments. See accompanying Notes to Financial Statements. 70
75) ADVISORSHARES MADRONA GLOBAL BOND ETF Schedule of Investments (continued) June 30, 2015 SUMMARY OF SCHEDULE OF INVESTMENTS Debt Fund Money Market Fund Repurchase Agreements Total Investments Liabilities in Excess of Other Assets Net Assets % of Net Assets 99.0% 1.2 29.6 129.8 (29.8) 100.0% See accompanying Notes to Financial Statements. 71
76) ADVISORSHARES MADRONA INTERNATIONAL ETF Schedule of Investments June 30, 2015 Investments Shares Value COMMON STOCKS — 97.1% Investments Shares Value COMMON STOCKS (continued) ARGENTINA — 1.3% Petrobras Argentina SA(a) Telecom Argentina SA(a) Total Argentina 19,436 5,971 AUSTRALIA — 1.8% Alumina Ltd.(a) Cochlear Ltd.(a) CSL Ltd.(a) National Australia Bank Ltd.(a) Newcrest Mining Ltd.*(a)(b) QBE Insurance Group Ltd.(a) Total Australia 26,237 118 740 3,403 11,533 4,611 122,527 3,646 24,642 43,286 116,253 48,646 359,000 AUSTRIA — 0.7% Andritz AG(a) Erste Group Bank AG*(a) Total Austria 1,402 9,936 15,512 142,185 157,697 BELGIUM — 0.8% Delhaize Group(a) KBC Groep NV(a) Total Belgium 1,196 4,054 BERMUDA — 0.1% Brookfield Infrastructure Partners LP(b) 407 BRAZIL — 5.6% Banco Bradesco SA(a) Banco do Brasil SA(a)(b) BB Seguridade Participacoes SA(a) BRF SA(a) Cia Brasileira de Distribuicao Grupo Pao de Acucar(a)(b) Cia de Saneamento Basico do Estado de Sao Paulo(a) Cia Paranaense de Energia(a) Cyrela Brazil Realty SA Empreendimentos e Participacoes(a) Estacio Participacoes SA(a) Fibria Celulose SA(a)(b) Gerdau SA(a) Hypermarcas SA*(a) Itau Unibanco Holding SA(a) Kroton Educacional SA(a)(b) Localiza Rent A Car SA(a) Total Brazil $ 129,638 107,418 237,056 24,673 135,972 160,645 18,164 11,084 15,568 5,317 3,517 101,529 121,119 58,859 73,540 2,863 67,767 18,951 8,901 98,166 97,911 6,747 22,897 2,850 4,166 4,037 8,371 33,169 686 21,388 132,803 38,789 10,040 29,470 91,662 129,359 6,750 1,079,152 CANADA — 4.8% Agrium, Inc.(b) Bank of Montreal Canadian National Railway Co. Canadian Pacific Railway Ltd. Gildan Activewear, Inc.(b) Magna International, Inc. Manulife Financial Corp. Methanex Corp. Mitel Networks Corp.* Silver Wheaton Corp. Teck Resources Ltd., Class B Toronto-Dominion Bank (The) Valeant Pharmaceuticals International, Inc.* Total Canada CHILE — 0.7% Cencosud SA(a)(b) Empresa Nacional de Electricidad SA(a) Sociedad Quimica y Minera de Chile SA(a) Total Chile CHINA — 5.3% Agricultural Bank of China Ltd.(a) Autohome, Inc.*(a) Baidu, Inc.*(a) Bank of China Ltd.(a)(b) China Construction Bank Corp.(a) China Life Insurance Co., Ltd.(a) China Southern Airlines Co. Ltd.*(a) China Telecom Corp. Ltd.(a) Huaneng Power International, Inc.(a)(b) Industrial & Commercial Bank of China Ltd.(a)(b) NetEase, Inc.(a) Ping An Insurance Group Co., of China Ltd.(a) Qihoo 360 Technology Co., Ltd.*(a) Semiconductor Manufacturing International Corp.*(a) Tencent Holdings Ltd.(a) Total China See accompanying Notes to Financial Statements. 72 703 990 607 506 1,398 1,769 4,427 1,244 14,159 3,336 8,768 493 $ 74,483 58,687 35,054 81,076 46,469 99,222 82,298 69,241 125,024 57,846 86,891 20,957 608 135,067 972,315 11,506 82,958 1,134 47,004 1,096 17,558 147,520 7,230 790 428 4,257 4,912 4,176 92,544 39,927 85,206 68,708 89,644 90,870 1,322 218 77,125 12,869 1,439 75,950 3,555 250 56,311 36,216 3,161 84,494 2,099 142,081 4,408 1,306 23,847 26,185 1,001,977
77) ADVISORSHARES MADRONA INTERNATIONAL ETF Schedule of Investments (continued) June 30, 2015 Investments Shares Value COMMON STOCKS (continued) DENMARK — 1.6% Danske Bank A/S(a) Novo Nordisk A/S(a) Pandora A/S(a) Vestas Wind Systems A/S(a) Total Denmark EGYPT — 0.7% Commercial International Bank Egypt SAE(a) FINLAND — 1.3% Nokia OYJ(a) Stora Enso OYJ(a) UPM-Kymmene OYJ(a) Total Finland FRANCE — 9.5% Airbus Group SE(a) Alcatel-Lucent*(a) Arkema SA(a) Atos Se(a)(b) AXA SA(a) BNP Paribas SA(a) Cap Gemini SA(a)(b) Carrefour SA(a)(b) Cie de Saint-Gobain(a) Cie Generale des Etablissements Michelin(a) Credit Agricole SA(a)(b) Ingenico Group(a) Kering(a) Orange SA(a) Pernod Ricard SA(a) Publicis Groupe SA(a) Renault SA(a)(b) Safran SA(a) Schneider Electric SE(a) Societe Generale SA(a)(b) Suez Environnement Co.(a) Valeo SA(a) Veolia Environnement SA(a)(b) Total France GERMANY — 6.4% adidas AG(a) Bayer AG(a) Bayerische Motoren Werke AG(a) Commerzbank AG*(a)(b) Continental AG(a) Daimler AG(a) Deutsche Boerse AG(a) Investments Shares Value 10,069 319 3,620 2,173 405 7,185 7,729 15,358 857 2,243 2,579 $ 130,897 9,398 62,318 35,007 18,241 114,385 96,767 129,314 10,618 34,879 119,433 1,212,041 22,060 100,761 1,140 10,941 95,122 134,356 1,237 2,086 3,444 110,514 32,750 67,296 12,018 2,862 9,557 75,113 79,392 120,991 4,689 5,002 77,697 66,427 859,658 1,279 8,012 616 3,288 1,825 77,418 83,485 9,764 113,337 21,845 305,849 9,268 69,695 3,636 55,813 125,508 3,379 2,184 155 94,984 155,829 37,431 288,244 COMMON STOCKS (continued) 10,307 625 4,877 1,220 $ 151,308 34,225 130,898 20,362 336,793 17,986 132,557 8,250 14,344 2,849 56,513 147,456 50,456 254,425 4,987 36,529 1,114 5,959 1,189 3,367 184 9,603 11,607 81,164 132,235 80,564 89,623 30,022 102,592 8,171 61,939 105,043 4,257 16,436 2,649 3,128 8,471 1,167 2,064 7,437 2,942 3,132 12,368 4,162 1,250 5,500 89,440 122,448 61,987 55,960 130,115 26,806 38,308 157,517 49,896 43,425 116,630 38,748 99,050 112,310 1,833,993 1,005 222 1,751 10,296 1,318 1,174 1,607 38,649 31,299 64,314 132,613 62,994 107,609 13,306 GERMANY (continued) Deutsche Lufthansa AG*(a) Deutsche Post AG(a) Deutsche Telekom AG(a)(b) Fresenius SE & Co. KGaA(a)(b) GEA Group AG(a) HeidelbergCement AG(a) Infineon Technologies AG(a) Porsche Automobil Holding SE(a) ProSiebenSat.1 Media AG(a) Symrise AG(a) Volkswagen AG(a) Total Germany GREECE — 0.5% Hellenic Telecommunications Organization SA(a) HONG KONG — 4.5% BOC Hong Kong Holdings Ltd.(a)(b) Cathay Pacific Airways Ltd.(a) China State Construction International Holdings Ltd.(a) China Unicom Hong Kong Ltd.(a) Hang Seng Bank Ltd.(a) Hutchison Telecommunications Hong Kong Holdings Ltd.(a)(b) Lenovo Group Ltd.(a) Swire Pacific Ltd., Class A(a) Techtronic Industries Co., Ltd.(a)(b) Wharf Holdings Ltd.(a)(b) Total Hong Kong INDIA — 1.6% HDFC Bank Ltd.(a) ICICI Bank Ltd.(a) Infosys Ltd.(a)(b) Tata Motors Ltd.(a) Wipro Ltd.(a) Total India INDONESIA — 0.7% PT Bank Mandiri Persero Tbk(a)(b) PT Bank Rakyat Indonesia Persero Tbk(a) Total Indonesia IRELAND — 1.5% CRH PLC(a) Ryanair Holdings PLC(a) Shire PLC(a) Total Ireland See accompanying Notes to Financial Statements. 73
78) ADVISORSHARES MADRONA INTERNATIONAL ETF Schedule of Investments (continued) June 30, 2015 Investments Shares Value Investments Shares Value 11,792 $ 91,978 38,202 119,572 1,998 852 54,875 33,075 207,522 NETHERLANDS — 2.6% Aegon NV(c) Akzo Nobel NV(a) ASML Holding N.V.(c) Heineken NV(a) ING Groep NV(a) Koninklijke Ahold NV(a) Koninklijke Philips NV(c) Reed Elsevier NV(a) TNT Express NV(a) Wolters Kluwer NV(a) Total Netherlands 15,538 3,610 800 116 3,421 314 3,677 149 6,778 438 114,981 87,795 83,304 4,428 56,720 5,925 93,616 6,981 57,206 13,079 524,035 NORWAY — 3.1% Marine Harvest ASA(a)(b) Norsk Hydro ASA(a) Orkla ASA(a) Telenor ASA(a) Yara International ASA(a) Total Norway 12,101 29,943 14,167 1,541 2,312 138,194 124,263 112,452 101,097 120,340 596,346 RUSSIA — 2.3% Gazprom Neft OAO(a) Gazprom OAO(a) Lukoil OAO(a) MMC Norilsk Nickel OJSC(a) Total Russia 10,766 20,437 2,287 7,014 131,345 107,703 102,709 118,887 460,644 1,163 71,629 1,185 5,753 3,619 2,072 22,355 70,187 57,216 71,349 292,736 COMMON STOCKS (continued) COMMON STOCKS (continued) ISRAEL — 0.1% Bezeq The Israeli Telecommunication Corp. Ltd.(a) LUXEMBOURG — 0.5% Oriflame Cosmetics SA*(a) 1,325 ITALY — 1.0% Atlantia SpA(a) Intesa Sanpaolo SpA(a)(b) Luxottica Group SpA(a)(b) Telecom Italia SpA*(a) Total Italy 4,060 6,276 282 227 JAPAN — 11.7% Asahi Glass Co. Ltd.(a)(b) Astellas Pharma, Inc.(a) Bridgestone Corp.(a) East Japan Railway Co.(a)(b) Fast Retailing Co. Ltd.(a) Fuji Heavy Industries Ltd.(a) FUJIFILM Holdings Corp.(a)(b) Hitachi Ltd.(a) Honda Motor Co., Ltd.(a) Hoya Corp.(a) Isuzu Motors Ltd.(a)(b) ITOCHU Corp.(a)(b) JGC Corp.(a)(b) KDDI Corp.(a) Kubota Corp.(a)(b) Makita Corp.(a) Mazda Motor Corp.(a)(b) MS&AD Insurance Group Holdings, Inc.(a)(b) Nidec Corp.(a)(b) Nissan Motor Co., Ltd.(a) NSK Ltd.(a)(b) ORIX Corp.(a)(b) Panasonic Corp.(a)(b) Santen Pharmaceutical Co. Ltd.(a) Sumitomo Metal Mining Co., Ltd.(a) Sumitomo Mitsui Trust Holdings, Inc.(a)(b) TDK Corp.(a)(b) Tokio Marine Holdings, Inc.(a) Toray Industries, Inc.(a) Toyota Motor Corp.(a) Total Japan $ 11,355 50,263 137,006 18,739 2,887 208,895 2,550 3,728 2,287 1,735 795 1,814 816 918 3,052 1,551 6,872 5,788 2,404 7,848 269 762 14,486 15,300 53,161 42,287 25,912 36,157 134,145 29,148 60,465 98,885 62,490 90,229 153,324 90,967 94,294 21,410 41,559 141,818 7,304 3,104 4,834 4,505 1,036 5,849 4,316 113,504 57,983 101,079 139,700 77,203 80,248 60,953 2,922 44,385 8,109 1,769 2,133 592 617 37,220 136,355 89,053 50,225 82,524 2,261,983 MEXICO — 1.1% Empresas ICA SAB de CV*(a)(b) Grupo Financiero Banorte SAB de CV(a) Grupo Televisa SAB(a) Total Mexico SINGAPORE — 1.6% DBS Group Holdings Ltd.(a) Global Logistic Properties Ltd.(a)(b) Keppel Corp. Ltd.(a) Singapore Airlines Ltd.(a) United Overseas Bank Ltd.(a) Total Singapore See accompanying Notes to Financial Statements. 74
79) ADVISORSHARES MADRONA INTERNATIONAL ETF Schedule of Investments (continued) June 30, 2015 Investments Shares Value Investments COMMON STOCKS (continued) TAIWAN — 2.4% Advanced Semiconductor Engineering, Inc.(a) AU Optronics Corp.(a)(b) Siliconware Precision Industries Co., Ltd.(a) Taiwan Semiconductor Manufacturing Co., Ltd.(a) United Microelectronics Corp.(a) Total Taiwan Value COMMON STOCKS (continued) SOUTH AFRICA — 1.4% Impala Platinum Holdings Ltd.*(a)(b) Imperial Holdings Ltd.(a)(b) Nampak Ltd.(a) Nedbank Group Ltd.(a) Sanlam Ltd.(a) Standard Bank Group Ltd.(a)(b) Total South Africa Shares SOUTH KOREA — 3.2% KB Financial Group, Inc.(a) Korea Electric Power Corp.(a) KT Corp.(a) LG Display Co., Ltd.(a)(b) POSCO(a) Shinhan Financial Group Co., Ltd.(a) SK Telecom Co., Ltd.(a) Total South Korea SPAIN — 2.0% Banco Bilbao Vizcaya Argentaria SA(a) Banco Popular Espanol SA*(a) Banco Santander SA(a) Grifols SA(a) Total Spain SWEDEN — 3.5% Atlas Copco AB, Class A(a) Electrolux AB(a) Elekta AB, Class B(a) Meda AB(a) Nordea Bank AB(a)(b) Sandvik AB(a)(b) SKF AB(a)(b) Telefonaktiebolaget LM Ericsson(a) Volvo AB(a) Total Sweden SWITZERLAND — 3.4% ABB Ltd.*(a) Adecco SA*(a)(b) Credit Suisse Group AG*(a) Glencore PLC(a) Holcim Ltd.*(a) Julius Baer Group Ltd.*(a) STMicroelectronics NV (c) UBS AG*(b) Total Switzerland 20,449 3,110 1,659 813 4,526 4,691 $ 91,203 47,645 4,612 16,219 49,922 62,156 271,757 1,207 7,145 9,241 10,711 2,425 39,674 145,473 117,083 124,140 119,043 1,062 1,815 39,358 44,994 629,765 13,338 5,694 16,183 453 131,646 110,919 113,443 14,029 370,037 973 2,087 3,529 4,119 1,197 6,302 4,422 27,312 131,210 22,127 56,719 15,010 70,141 101,352 9,662 10,699 100,871 133,631 658,373 1,013 1,937 4,547 8,493 3,075 8,732 13,893 6,216 21,151 78,642 125,497 68,241 45,049 97,885 112,811 132,028 681,304 THAILAND — 0.2% Kasikornbank PCL(a)(b) TURKEY — 1.1% Akbank TAS(a)(b) Turkcell Iletisim Hizmetleri AS(a) Turkiye Garanti Bankasi AS(a) Total Turkey UNITED KINGDOM — 6.5% Aberdeen Asset Management PLC(a)(b) Anglo American PLC(a) ARM Holdings PLC(a) Ashtead Group PLC(a) Aviva PLC(a)(b) Barclays PLC(a)(b) Carnival PLC(a) G4S PLC(a)(b) ITV PLC(a) Legal & General Group PLC(a)(b) Lloyds Banking Group PLC(a) Marks & Spencer Group PLC(a) Polyus Gold International Ltd. (d) Provident Financial PLC(a) Prudential PLC(a) Royal Mail PLC(a) RSA Insurance Group PLC(a)(b) Smith & Nephew PLC(a) Wolseley PLC(a) Total United Kingdom Total Common Stocks (Cost $19,146,952) MONEY MARKET FUND — 2.7% Fidelity Institutional Prime Money Market Portfolio — Class I, 0.07%(e) (Cost $516,762) See accompanying Notes to Financial Statements. 75 7,611 29,675 $ 50,233 132,351 11,701 87,172 2,948 51,957 66,949 106,512 443,217 1,327 29,990 15,605 4,106 24,127 90,509 47,178 76,483 214,170 688 4,551 806 1,701 4,453 6,718 2,356 2,670 2,250 2,254 12,966 669 6,805 1,240 1,650 7,546 20,829 158 13,287 8,830 32,949 39,712 118,339 69,333 110,444 120,816 56,764 93,329 44,990 70,405 11,293 18,510 57,509 80,124 121,416 134,555 5,364 86,100 1,280,782 18,818,244 516,762 516,762
80) ADVISORSHARES MADRONA INTERNATIONAL ETF Schedule of Investments (continued) June 30, 2015 Investments Principal Value LP — Limited Partnership (f) REPURCHASE AGREEMENTS — 12.6% Citibank NA, dated 06/30/15, due 07/01/15, 0.14%, total to be received $365,455, (collateralized by various U.S. Government Agency Obligations, 0.63% − 6.50%, 11/15/16 − 07/01/45, totaling $372,763) $365,454 HSBC Securities USA, Inc., dated 06/30/15, due 07/01/15, 0.10%, total to be received $567,066, (collateralized by various U.S. Government Agency Obligations, 0.00% − 9.38%, 07/15/15 − 01/15/37, totaling $578,407) 567,064 Mizuho Securities USA, Inc., dated 06/30/15, due 07/01/15, 0.14%, total to be received $567,066, (collateralized by various U.S. Government Agency Obligations, 0.00% − 8.50%, 06/13/16 − 04/20/44, totaling $578,405) $567,064 Morgan Stanley & Co. LLC, dated 06/30/15, due 07/01/15, 0.09%, total to be received $567,065, (collateralized by various U.S. Government Agency Obligations, 0.75% − 9.50%, 02/16/16 − 05/01/45, totaling $578,405) 567,064 RBC Capital Markets LLC, dated 06/30/15, due 07/01/15, 0.10%, total to be received $369,715, (collateralized by various U.S. Government Agency Obligations, 2.38% − 6.50%, 03/01/19 − 02/20/65, totaling $377,108) 369,714 Total Repurchase Agreements (Cost $2,436,360) Total Investments — 112.4% (Cost $22,100,074) Liabilities in Excess of Other Assets — (12.4)% Net Assets — 100.0% PLC — Public Limited Company * (a) American Depositary Receipt. (b) All or a portion of security is on loan. The aggregate market value of the securities on loan is $2,356,217; the aggregate market value of the collateral held by the fund is $2,436,360. (c) Registered Shares. (d) Global Depositary Receipt. (e) Rate shown reflects the 7-day yield as of June 30, 2015. (f) $ Non-income producing security. Collateral received from brokers for securities lending was invested in these short-term investments. 365,454 567,064 567,064 567,064 369,714 2,436,360 21,771,366 (2,406,699) $19,364,667 See accompanying Notes to Financial Statements. 76
81) ADVISORSHARES MADRONA INTERNATIONAL ETF Schedule of Investments (continued) June 30, 2015 SUMMARY OF SCHEDULE OF INVESTMENTS Advertising Aerospace/Defense Airlines Apparel Auto Manufacturers Auto Parts & Equipment Banks Beverages Biotechnology Building Materials Chemicals Commercial Services Computers Cosmetics/Personal Care Distribution/Wholesale Diversified Financial Services Electric Electrical Components & Equipment Electronics Energy − Alternate Sources Engineering & Construction Food Forest Products & Paper Hand/Machine Tools Healthcare − Products Healthcare − Services Holding Companies − Diversified Home Furnishings Insurance Internet Iron/Steel Leisure Time Machinery − Construction & Mining Machinery − Diversified Media Metal Fabricate/Hardware Mining Miscellaneous Manufacturing Oil & Gas Packaging & Containers Pharmaceuticals Real Estate Retail Semiconductors Software Telecommunications Transportation Water Money Market Fund Repurchase Agreements Total Investments Liabilities in Excess of Other Assets Net Assets ** % of Net Assets 0.2% 0.7 2.9 0.4 7.6 2.0 19.3 0.2 0.1 1.9 2.8 3.0 2.1 0.5 1.2 1.7 2.0 0.5 2.1 0.1 1.7 2.9 1.2 1.0 0.2 0.2 1.6 1.1 5.6 1.5 0.7 0.6 0.6 0.3 0.8 1.2 4.6 0.2 2.4 0.0** 2.3 0.2 1.3 3.4 0.8 6.4 1.7 1.3 2.7 12.6 112.4 (12.4) 100.0% Less than 0.05% See accompanying Notes to Financial Statements. 77
82) ADVISORSHARES MEIDELL TACTICAL ADVANTAGE ETF Schedule of Investments June 30, 2015 Shares/ Principal Investments Value EXCHANGE TRADED FUNDS — 96.4% Equity Fund — 96.4% Deutsche X-trackers MSCI EAFE Hedged Equity ETF(a) iShares Core S&P Mid-Cap ETF iShares Core S&P Small-Cap ETF iShares Europe ETF iShares S&P 100 ETF(a) iShares S&P Mid-Cap 400 Growth ETF(a) iShares S&P Mid-Cap 400 Value ETF(a) iShares S&P Small-Cap 600 Growth ETF(a) iShares S&P Small-Cap 600 Value ETF SPDR S&P International Small Cap ETF(a) Vanguard FTSE All-World ex-US ETF Vanguard FTSE Developed Markets ETF Total Exchange Traded Funds (Cost $16,064,748) MONEY MARKET FUND — 3.6% Dreyfus Institutional Reserves Treasury Fund − Institutional Class, 0.00%(b) (Cost $614,679) 27,404 10,970 13,940 18,224 8,965 $ 784,302 1,645,281 1,643,247 796,936 814,381 9,883 1,675,168 12,411 1,600,523 12,929 1,693,698 13,785 1,623,322 28,476 869,088 32,964 1,600,402 40,668 1,612,486 Investments Principal REPURCHASE AGREEMENTS (continued) Morgan Stanley & Co. LLC, dated 06/30/15, due 07/01/15, 0.09%, total to be received $958,373, (collateralized by various U.S. Government Agency Obligations, 0.75% − 9.50%, 02/16/16 − 05/01/45, totaling $977,538) $958,371 RBC Capital Markets LLC, dated 06/30/15, due 07/01/15, 0.10%, total to be received $624,835, (collateralized by various U.S. Government Agency Obligations, 2.38% − 6.50%, 03/01/19 − 02/20/65, totaling $637,330) 624,833 Total Repurchase Agreements (Cost $4,117,585) Total Investments — 124.3% (Cost $20,797,012) Liabilities in Excess of Other Assets — (24.3)% Net Assets — 100.0% Value $ 958,371 624,833 4,117,585 21,091,098 (4,119,347) $16,971,751 16,358,834 ETF — Exchange Traded Fund (a) 614,679 REPURCHASE AGREEMENTS — 24.3%(c) Citibank NA, dated 06/30/15, due 07/01/15, 0.14%, total to be received $617,641, (collateralized by various U.S. Government Agency Obligations, 0.63% − 6.50%, 11/15/16 − 07/01/45, totaling $629,992) $617,639 HSBC Securities USA, Inc., dated 06/30/15, due 07/01/15, 0.10%, total to be received $958,374, (collateralized by various U.S. Government Agency Obligations, 0.00% − 9.38%, 07/15/15 − 01/15/37, totaling $977,542) 958,371 Mizuho Securities USA, Inc., dated 06/30/15, due 07/01/15, 0.14%, total to be received $958,375, (collateralized by various U.S. Government Agency Obligations, 0.00% − 8.50%, 06/13/16 − 04/20/44, totaling $977,538) 958,371 All or a portion of security is on loan. The aggregate market value of the securities on loan is $4,026,607; the aggregate market value of the collateral held by the fund is $4,117,585. (b) Rate shown reflects the 7-day yield as of June 30, 2015. (c) Collateral received from brokers for securities lending was invested in these short-term investments. 614,679 617,639 958,371 SUMMARY OF SCHEDULE OF INVESTMENTS Equity Fund Money Market Fund Repurchase Agreements Total Investments Liabilities in Excess of Other Assets Net Assets 958,371 See accompanying Notes to Financial Statements. 78 % of Net Assets 96.4% 3.6 24.3 124.3 (24.3) 100.0%
83) ADVISORSHARES MORGAN CREEK GLOBAL TACTICAL ETF† Schedule of Investments June 30, 2015 Investments Shares Value 14,695 $ 1,007 Currency Fund — 4.3% PowerShares DB US Dollar Index Bullish Fund*(a) ProShares UltraShort Yen* Total Currency Fund 211,461 45,516 256,977 10,960 2,827 Equity Fund — 61.5% Energy Select Sector SPDR Fund(a) Global X FTSE Greece 20 ETF Global X FTSE Portugal 20 ETF Health Care Select Sector SPDR Fund iShares China Large-Cap ETF(a) iShares MSCI Italy Capped ETF(a) iShares MSCI Spain Capped ETF(a) iShares Residential Real Estate Capped ETF(a) Market Vectors Gold Miners ETF Market Vectors Russia ETF SPDR S&P Oil & Gas Exploration & Production ETF(a) Technology Select Sector SPDR Fund(a) Vanguard Global ex-U.S. Real Estate ETF WisdomTree India Earnings Fund WisdomTree Japan Hedged Equity Fund Total Equity Fund Total Exchange Traded Funds (Cost $9,195,732) 274,329 260,649 534,978 9,214 Debt Fund — 5.1% Direxion Daily 20 Year Plus Treasury Bull 3x Shares* Total Debt Fund Principal Value (c) EXCHANGE TRADED FUNDS — 73.0% Commodity Fund — 2.1% PowerShares DB Base Metals Fund* Proshares Ultra Bloomberg Crude Oil* Total Commodity Fund Investments 632,449 632,449 5,820 31,209 31,134 437,431 313,963 351,503 10,279 15,173 25,016 10,672 764,655 699,475 372,488 358,046 9,377 12,130 20,975 525,862 215,429 383,423 11,735 547,555 16,574 686,164 8,867 5,744 491,764 124,472 22,737 1,300,556 7,572,786 8,997,190 REPURCHASE AGREEMENTS — 15.0% Citibank NA, dated 06/30/15, due 07/01/15, 0.14%, total to be received $276,314, (collateralized by various U.S. Government Agency Obligations, 0.63% − 6.50%, 11/15/16 − 07/01/45, totaling $281,839) $276,313 HSBC Securities USA, Inc., dated 06/30/15, due 07/01/15, 0.10%, total to be received $428,748, (collateralized by various U.S. Government Agency Obligations, 0.00% − 9.38%, 07/15/15 − 01/15/37, totaling $437,324) 428,747 Mizuho Securities USA, Inc., dated 06/30/15, due 07/01/15, 0.14%, total to be received $428,749, (collateralized by various U.S. Government Agency Obligations, 0.00% − 8.50%, 06/13/16 − 04/20/44, totaling $437,322) 428,747 Morgan Stanley & Co. LLC, dated 06/30/15, due 07/01/15, 0.09%, total to be received $428,748, (collateralized by various U.S. Government Agency Obligations, 0.75% − 9.50%, 02/16/16 − 05/01/45, totaling $437,322) 428,747 RBC Capital Markets LLC, dated 06/30/15, due 07/01/15, 0.10%, total to be received $279,531, (collateralized by various U.S. Government Agency Obligations, 2.38% − 6.50%, 03/01/19 − 02/20/65, totaling $285,121) 279,530 Total Repurchase Agreements (Cost $1,842,084) Total Investments — 115.1% (Cost $14,222,788) Liabilities in Excess of Other Assets — (15.1)% Net Assets — 100.0% $ 276,313 428,747 428,747 428,747 279,530 1,842,084 14,170,731 (1,861,769) $12,308,962 CLOSED-END FUND — 5.4% Country Fund — 5.4% Morgan Stanley China A Share Fund, Inc. (Cost $512,377) 19,424 658,862 MONEY MARKET FUND — 21.7% Goldman Sachs Financial Square Fund, 0.04%(b) (Cost $2,672,595) 2,672,595 2,672,595 ETF — Exchange Traded Fund † Formerly known as AdvisorShares Cambria Global Tactical ETF. * Non-income producing security. (a) All or a portion of security is on loan. The aggregate market value of the securities on loan is $1,798,342; the aggregate market value of the collateral held by the fund is $1,842,084. (b) Rate shown reflects the 7-day yield as of June 30, 2015. (c) Collateral received from brokers for securities lending was invested in these short-term investments. See accompanying Notes to Financial Statements. 79
84) ADVISORSHARES MORGAN CREEK GLOBAL TACTICAL ETF† Schedule of Investments (continued) June 30, 2015 SUMMARY OF SCHEDULE OF INVESTMENTS Commodity Fund Country Fund Currency Fund Debt Fund Equity Fund Money Market Fund Repurchase Agreements Total Investments Liabilities in Excess of Other Assets Net Assets % of Net Assets 2.1% 5.4 4.3 5.1 61.5 21.7 15.0 115.1 (15.1) 100.0% See accompanying Notes to Financial Statements. 80
85) ADVISORSHARES NEWFLEET MULTI-SECTOR INCOME ETF Schedule of Investments June 30, 2015 Investments Principal Value Investments Principal Value MORTGAGE BACKED SECURITIES — 29.4% MORTGAGE BACKED SECURITIES (continued) Commercial Mortgage Backed Securities — 18.8% A10 Term Asset Financing LLC, Class A1, Series 2014-1, 1.72%, $ 250,000 $ 249,531 04/15/33‡ BAMLL-DB Trust, Class A2FX, Series 2012-OSI, 3.35%, 274,872 281,388 04/13/29‡ Banc of America Commercial Mortgage Trust, Class A4, Series 2007-2, 5.61%, 1,084,000 1,135,386 04/10/49@ Banc of America Merrill Lynch Commercial Mortgage, Inc., Class G, Series 2005-2, 5.02%, 07/10/43@‡ 1,360,000 1,358,755 Bayview Commercial Asset Trust, Class A3, Series 2008-1, 1.69%, 300,000 289,580 01/25/38@‡ Bear Stearns Commercial Mortgage Securities Trust, Class AM, Series 2005-PW10, 571,000 579,747 5.45%, 12/11/40@ Bear Stearns Commercial Mortgage Securities Trust, Class AM, Series 2006-PW13, 885,000 922,734 5.58%, 09/11/41@ Bear Stearns Commercial Mortgage Securities Trust, Class AM, Series 2007-PW15, 5.36%, 02/11/44 265,000 274,425 Bear Stearns Commercial Mortgage Securities Trust, Class AM, Series 2007-PW17, 990,000 1,070,960 5.89%, 06/11/50@ Bear Stearns Commercial Mortgage Securities Trust, Class A4, Series 2007-PW18, 5.70%, 06/11/50 970,000 1,038,356 Bear Stearns Commercial Mortgage Securities Trust, Class A4, Series 2007-PW17, 650,000 693,550 5.69%, 06/11/50@ Capital Auto Receivables Asset Trust, Class C, Series 2013-1, 1.74%, 10/22/18 415,000 416,278 CD Commercial Mortgage Trust, Class AMFX, Series 2007-CD4, 5.37%, 12/11/49@ 895,000 929,541 CD Commercial Mortgage Trust, Class A4, Series 2007-CD4, 5.32%, 12/11/49 780,000 813,299 Citigroup Commercial Mortgage Trust, Class AM, Series 530,000 574,047 2008-C7, 6.14%, 12/10/49@ Citigroup Commercial Mortgage Trust, Class A4, Series 2007-C6, 140,000 149,876 5.71%, 12/10/49@ Citigroup Commercial Mortgage Trust, Class A1A, Series 2007-C6, 5.71%, 12/10/49@ 1,410,413 1,508,337 Commercial Mortgage Backed Securities (continued) Citigroup Commercial Mortgage Trust, Class MLSR, Series 348,733 2010-RR3, 5.74%, 06/14/50@‡ $ 330,607 $ Colony Multifamily Mortgage Trust, Class A, Series 2014-1, 780,897 781,767 2.54%, 04/20/50‡ Commercial Mortgage Trust, Class AM, Series 2007-GG11, 510,000 547,692 5.87%, 12/10/49@ Credit Suisse Commercial Mortgage Trust, Class A1A, Series 2007-C1, 5.36%, 02/15/40 478,769 500,933 Credit Suisse Commercial Mortgage Trust, Class 1A, Series 2010-RR7, 5.38%, 469,282 487,403 08/12/48@‡ DBUBS Mortgage Trust, Class A2, Series 2011-LC3A, 3.64%, 08/10/44 978,471 996,313 Extended Stay America Trust, Class A17, Series 2013-ESH7, 735,000 728,826 2.30%, 12/05/31‡ GMACM Mortgage Loan Trust, Class A10, Series 2003-J7, 5.50%, 11/25/33 788,258 811,084 GMACM Mortgage Loan Trust, Class 12A, Series 2004-AR1, 629,638 642,146 3.03%, 06/25/34@ GS Mortgage Securities Trust, Class A4, Series 2007-GG10, 5.79%, 08/10/45@ 897,857 958,939 GS Mortgage Securities Trust, Class A1A, Series 2007-GG10, 536,107 576,001 5.79%, 08/10/45@ Hilton USA Trust, Class EFX, Series 2013-HLT, 4.45%, 535,000 543,905 11/05/30@‡ Irwin Home Equity Loan Trust, Class M1, Series 2003-A, 1.74%, 10/25/27@ 437,357 433,850 JPMorgan Chase Commercial Mortgage Securities Trust, Class AM, Series 2006-LDP7, 1,190,000 1,233,734 5.90%, 04/15/45@ JPMorgan Chase Commercial Mortgage Securities Trust, Class A4, Series 2006-LDP7, 5.90%, 04/15/45@ 183,205 187,484 JPMorgan Chase Commercial Mortgage Securities Trust, Class A3, Series 2006-LDP9, 5.34%, 05/15/47 2,391,591 2,498,868 JPMorgan Chase Commercial Mortgage Securities Trust, Class AM, Series 2006-LDP9, 5.37%, 05/15/47 650,000 672,312 See accompanying Notes to Financial Statements. 81
86) ADVISORSHARES NEWFLEET MULTI-SECTOR INCOME ETF Schedule of Investments (continued) June 30, 2015 Investments Principal Value Investments Principal Value MORTGAGE BACKED SECURITIES (continued) MORTGAGE BACKED SECURITIES (continued) Commercial Mortgage Backed Securities (continued) JPMorgan Chase Commercial Mortgage Securities Trust, Class AM, Series 2007-LDPX, $ 275,000 $ 284,677 5.46%, 01/15/49@ JPMorgan Chase Commercial Mortgage Securities Trust, Class A4, Series 2007-LD12, 2,255,000 2,400,427 5.88%, 02/15/51@ JPMorgan Mortgage Trust, Class 1A1, Series 2004-A3, 2.39%, 07/25/34@ 362,241 364,068 LB Commercial Mortgage Trust, Class A4, Series 2007-C3, 5.90%, 07/15/44@ 601,947 644,282 LB-UBS Commercial Mortgage Trust, Class A3, Series 2007-C2, 5.43%, 02/15/40 407,559 430,854 LB-UBS Commercial Mortgage Trust, Class A4, Series 2007-C6, 1,250,962 1,319,131 5.86%, 07/15/40@ LB-UBS Commercial Mortgage Trust, Class A3, Series 2007-C7, 676,807 733,028 5.87%, 09/15/45@ Morgan Stanley Capital I Trust, Class AM, Series 2008-T29, 6.27%, 01/11/43@ 860,000 953,156 Morgan Stanley Capital I Trust, Class A4, Series 2006-IQ12, 5.33%, 12/15/43 451,762 470,223 Morgan Stanley Capital I Trust, Class A4, Series 2007-IQ14, 800,000 846,863 5.69%, 04/15/49@ Morgan Stanley Capital I Trust, Class AM, Series 2007-IQ14, 226,000 235,847 5.68%, 04/15/49@ Morgan Stanley Capital I Trust, Class A4, Series 2007-IQ16, 5.81%, 12/12/49 410,733 441,265 Vericrest Opportunity Loan Trust, Class A1, Series 2014-NPL9, 268,803 269,224 3.38%, 11/25/54‡# Vericrest Opportunity Loan Trust, Class A1, Series 2015-NPL3, 392,813 393,049 3.38%, 10/25/58‡# VFC LLC, Class A, Series 2014-2, 148,285 148,303 2.75%, 07/20/30‡ VOLT XXII LLC, Class A1, Series 2015-NPL4, 3.50%, 300,045 300,388 02/25/55‡# VOLT XXXI LLC, Class A1, Series 2015-NPL2, 3.38%, 02/25/55‡# 425,625 425,559 Wachovia Bank Commercial Mortgage Trust, Class AM, Series 2007-C30, 5.38%, 12/15/43 870,000 915,034 Wachovia Bank Commercial Mortgage Trust, Class A4, Series 2007-C31, 5.51%, 04/15/47 770,000 806,540 Commercial Mortgage Backed Securities (continued) Wachovia Bank Commercial Mortgage Trust, Class AM, Series 2007-C31, 5.59%, $1,380,000 $ 1,465,480 04/15/47@ Wachovia Bank Commercial Mortgage Trust, Class A3, Series 2007-C32, 5.71%, 975,000 1,032,115 06/15/49@ Washington Mutual MSC Mortgage Pass-Through Certificates Trust, Class 2A1, Series 2003-AR4, 2.26%, 08/25/33@ 216,333 215,228 Total Commercial Mortgage Backed Securities 40,330,521 Non-Agency Mortgage-Backed Securities — 1.6% Access Point Funding LLC, Class A, Series 2015-A, 2.61%, 04/15/20‡ 248,237 248,212 Alternative Loan Trust, Class 1A1, Series 2004-22CB, 6.00%, 10/25/34 188,339 201,015 Bcrr Trust, Class 2A1, Series 2009-1, 5.86%, 158,942 163,877 07/17/40@‡ Bear Stearns Commercial Mortgage Securities Trust, Class AM, Series 2006-PW14, 5.24%, 12/11/38 285,000 299,224 Bear Stearns Commercial Mortgage Securities Trust, Class AM, Series 2007-PW18, 460,000 502,699 6.08%, 06/11/50@ Leaf Receivables Funding 10 LLC, Class D, Series 2015-1, 3.74%, 615,000 607,860 05/17/21‡ OneMain Financial Issuance Trust, Class A, Series 2015-2A, 325,000 325,247 2.57%, 07/18/25‡ Welk Resorts LLC, Class A, Series 2015-AA, 2.79%, 650,000 650,631 06/16/31‡ Wendys Funding LLC, Class A2II, Series 2015-1A, 4.08%, 535,000 530,934 06/15/45‡ Total Non-Agency Mortgage-Backed Securities 3,529,699 Residential Mortgage Backed Securities — 9.0% B2R Mortgage Trust, Class A1, Series 2015-1, 2.52%, 229,058 05/15/48‡ Banc of America Funding Trust, Class 5A1, Series 2004-A, 182,482 2.50%, 07/20/34@ Banc of America Mortgage Trust, Class 6A3, Series 2004-7, 4.50%, 08/25/19 678,482 See accompanying Notes to Financial Statements. 82 228,304 182,125 671,382
87) ADVISORSHARES NEWFLEET MULTI-SECTOR INCOME ETF Schedule of Investments (continued) June 30, 2015 Investments Principal Value Investments Principal Value MORTGAGE BACKED SECURITIES (continued) MORTGAGE BACKED SECURITIES (continued) Residential Mortgage Backed Securities (continued) Bayview Financial Mortgage Pass-Through Trust, Class 1A2, Series 2006-A, 5.48%, $ 285,620 $ 299,691 02/28/41# Bear Stearns ARM Trust, Class 21A1, Series 2004-1, 807,099 799,407 2.26%, 04/25/34@ Bear Stearns ARM Trust, Class 12A3, Series 2004-10, 416,404 413,962 2.73%, 01/25/35@ Bear Stearns ARM Trust, Class 15A1, Series 2004-10, 2.63%, 01/25/35@ 1,260,839 1,258,562 Citigroup Mortgage Loan Trust, Class A, Series 2014-A, 4.00%, 154,715 161,705 01/25/35@‡ Citigroup Mortgage Loan Trust, Inc., Class A2, Series 2003-UP3, 7.00%, 09/25/33 232,816 246,685 Citigroup Mortgage Loan Trust, Inc., Class A3, Series 2004-UST1, 375,500 376,442 2.18%, 08/25/34@ Citigroup Mortgage Loan Trust, Inc., Class A1, Series 2015-A, 3.50%, 06/25/58@ 506,366 510,198 Credit Suisse First Boston Mortgage Securities Corp., Class 6A1, Series 2004-8, 4.50%, 12/25/19 129,527 131,692 Credit Suisse First Boston Mortgage Securities Corp., Class 6A1, Series 2004-AR8, 229,271 228,635 2.37%, 09/25/34@ GSR Mortgage Loan Trust, Class 3A1, Series 2004-7, 819,289 798,263 2.29%, 06/25/34@ GSR Mortgage Loan Trust, Class 2A2, Series 2007-1F, 5.50%, 01/25/37 29,997 28,787 JPMorgan Mortgage Trust, Class 4A1, Series 2006-A2, 377,794 379,337 2.64%, 08/25/34@ JPMorgan Mortgage Trust, Class 4A1, Series 2005-A2, 2.14%, 04/25/35@ 819,676 803,558 JPMorgan Mortgage Trust, Class 1A1, Series 2014-1, 413,793 433,131 4.00%, 01/25/44@‡ MASTR Alternative Loan Trust, Class 6A1, Series 2004-4, 5.50%, 04/25/34 489,341 517,504 MASTR Asset Securitization Trust, Class 1A1, Series 2005-1, 5.00%, 05/25/20 332,481 336,212 Merrill Lynch Mortgage Trust, Class AM, Series 2006-C1, 660,000 678,555 5.68%, 05/12/39@ Residential Mortgage Backed Securities (continued) Morgan Stanley Residential Mortgage Loan Trust, Class A1, Series 2014-1A, 2.99%, $ 295,434 $ 302,980 06/25/44@‡ National City Mortgage Capital Trust, Class 2A1, Series 2008-1, 6.00%, 03/25/38 340,362 358,884 New Residential Mortgage Loan Trust, Class A3, Series 2014-2A, 282,294 293,101 3.75%, 05/25/54@‡ New Residential Mortgage Loan Trust, Class AFX3, Series 2014-3A, 3.75%, 11/25/54@‡ 681,589 701,958 RALI Series Trust, Class CB5, Series 2003-QS17, 5.50%, 09/25/33 421,124 436,391 RALI Series Trust, Class A3, Series 2003-QS22, 5.38%, 12/26/33 97,294 98,394 RASC Series Trust, Class AI6, Series 2004-KS2, 4.30%, 144,200 146,101 03/25/34@ Structured Adjustable Rate Mortgage Loan Trust, Class 6A, Series 2004-1, 2.64%, 02/25/34@ 490,676 481,207 Structured Adjustable Rate Mortgage Loan Trust, Class 3A2, Series 2004-4, 970,757 972,642 2.64%, 04/25/34@ Structured Adjustable Rate Mortgage Loan Trust, Class 3A1, Series 2004-4, 182,283 180,913 2.48%, 04/25/34@ Structured Adjustable Rate Mortgage Loan Trust, Class 3A2, Series 2004-5, 427,209 426,209 2.44%, 05/25/34@ Structured Asset Securities Corp., Class 2A, Series 2003-37A, 329,065 330,316 3.77%, 12/25/33@ Structured Asset Securities Corp. Mortgage Pass-Through Certificates, Class 1A1, Series 2003-33H, 5.50%, 10/25/33 473,835 485,687 Structured Asset Securities Corp. Mortgage Pass-Through Certificates, Class 6A, Series 2003-34A, 2.58%, 11/25/33@ 341,978 336,147 Structured Asset Securities Corp. Pass-Through Certificates, Class A3, Series 2002-AL1, 3.45%, 02/25/32 1,128,046 1,117,768 WaMu Mortgage Pass-Through Certificates, Class A1, Series 2003-AR6, 2.56%, 247,603 248,429 06/25/33@ See accompanying Notes to Financial Statements. 83
88) ADVISORSHARES NEWFLEET MULTI-SECTOR INCOME ETF Schedule of Investments (continued) June 30, 2015 Investments Principal Value MORTGAGE BACKED SECURITIES (continued) Residential Mortgage Backed Securities (continued) Wells Fargo Mortgage Backed Securities Trust, Class 5A1, Series 2003-J, 2.49%, $ 217,328 $ 219,633 10/25/33@ Wells Fargo Mortgage Backed Securities Trust, Class A1, Series 2004-A, 2.64%, 267,619 268,432 02/25/34@ Wells Fargo Mortgage Backed Securities Trust, Class 2A12, Series 2004-K, 2.73%, 07/25/34@ 185,717 187,241 Wells Fargo Mortgage Backed Securities Trust, Class 1A2, Series 2004-K, 2.74%, 07/25/34@ 522,933 525,356 Wells Fargo Mortgage Backed Securities Trust, Class 2A1, Series 2004-Z, 2.61%, 12/25/34@ 221,975 223,584 Wells Fargo Mortgage Backed Securities Trust, Class 2A1, Series 2005-14, 5.50%, 12/25/35 173,004 176,832 WinWater Mortgage Loan Trust, Class A1, Series 2014-1, 4.00%, 623,498 643,211 06/20/44@‡ WinWater Mortgage Loan Trust, Class A4, Series 2014-3, 3.50%, 703,077 708,844 11/20/44@‡ Total Residential Mortgage Backed Securities 19,354,397 Total Mortgage Backed Securities (Cost $64,777,815) 63,214,617 ASSET BACKED SECURITIES — 26.4% American Homes 4 Rent, Class A, Series 2014-SFR1, 1.25%, 275,002 06/17/31@‡ AmeriCredit Automobile Receivables Trust, Class C, Series 2014-2, 2.18%, 06/08/20 500,000 AmeriCredit Automobile Receivables Trust, Class D, Series 2011-2, 4.00%, 05/08/17 871,872 AmeriCredit Automobile Receivables Trust, Class D, Series 2012-4, 2.68%, 10/09/18 1,050,000 AmeriCredit Automobile Receivables Trust, Class D, Series 2013-2, 2.42%, 05/08/19 575,000 AmeriCredit Automobile Receivables Trust, Class D, Series 2014-1, 2.54%, 06/08/20 755,000 274,626 500,386 874,515 1,069,869 579,257 752,948 Investments Principal Value ASSET BACKED SECURITIES (continued) Ascentium Equipment Receivables LLC, Class B, Series 2015-1A, 2.26%, $ 600,000 $ 603,511 06/10/21‡ Asset Backed Funding Certificates Trust, Class A6, Series 2005-AQ1, 4.78%, 398,994 411,752 06/25/35# Associates Manufactured Housing Pass-Through Certificates, Class B1, Series 1996-1, 8.00%, 285,544 311,267 03/15/27@ Avis Budget Rental Car Funding AESOP LLC, Class A, Series 2012-3A, 2.10%, 500,000 503,754 03/20/19‡ Avis Budget Rental Car Funding AESOP LLC, Class A, Series 2013-1A, 1.92%, 1,140,000 1,137,198 09/20/19‡ Avis Budget Rental Car Funding AESOP LLC, Class A, Series 2013-2A, 2.97%, 1,465,000 1,505,700 02/20/20‡ Banc of America Funding Trust, Class 1A1, Series 2005-1, 5.50%, 02/25/35 278,320 283,739 BankAmerica Manufactured Housing Contract Trust, Class B1, Series 1998-1, 7.81%, 284,170 298,773 08/10/25@ Bayview Financial Acquisition Trust, Class 1A2, Series 2007-A, 573,793 617,181 6.21%, 05/28/37# Beacon Container Finance LLC, Class A, Series 2012-1A, 642,598 654,313 3.72%, 09/20/27‡ BXG Receivables Note Trust, Class A, Series 2015-A, 2.88%, 555,042 553,987 05/02/30‡ California Republic Auto Receivables Trust, Class A4, Series 2014-3, 1.79%, 03/16/20 645,000 649,833 California Republic Auto Receivables Trust, Class B, Series 2014-2, 2.34%, 04/15/20 500,000 500,358 Capital Auto Receivables Asset Trust, Class C, Series 2013-4, 2.67%, 02/20/19 635,000 641,925 Capital Auto Receivables Asset Trust, Class C, Series 2015-2, 2.67%, 08/20/20 650,000 650,316 CarFinance Capital Auto Trust, Class B, Series 2013-2A, 3.15%, 350,000 355,703 08/15/19‡ CarFinance Capital Auto Trust, Class B, Series 2014-1A, 2.72%, 04/15/20‡ 200,000 201,765 See accompanying Notes to Financial Statements. 84
89) ADVISORSHARES NEWFLEET MULTI-SECTOR INCOME ETF Schedule of Investments (continued) June 30, 2015 Investments Principal Value ASSET BACKED SECURITIES (continued) CarFinance Capital Auto Trust, Class B, Series 2014-2A, 2.64%, $ 480,000 $ 480,186 11/16/20‡ CarFinance Capital Auto Trust, Class B, Series 2015-1A, 2.91%, 1,000,000 1,003,020 06/15/21‡ CarFinance Capital Auto Trust, Class D, Series 2014-1A, 415,000 422,275 4.90%, 04/15/20‡ CarMax Auto Owner Trust, Class B, Series 2014-4, 2.20%, 09/15/20 700,000 704,447 CarMax Auto Owner Trust, Class C, Series 2014-2, 2.08%, 01/15/20 425,000 426,267 CarMax Auto Owner Trust, Class C, Series 2015-2, 2.39%, 03/15/21 615,000 615,992 Carnow Auto Receivables Trust, Class D, Series 2014-1A, 400,000 398,913 4.16%, 11/15/18‡ CCG Receivables Trust, Class B, Series 2014-1, 2.15%, 420,000 422,445 11/15/21‡ Centex Home Equity Loan Trust, Class AF5, Series 2004-D, 438,000 464,539 5.35%, 09/25/34# Centre Point Funding LLC, Class 1, Series 2012-2A, 2.61%, 773,095 771,523 08/20/21‡ Citicorp Residential Mortgage Trust, Class A4, Series 2006-1, 473,967 491,741 5.76%, 07/25/36# Citicorp Residential Mortgage Trust, Class A6, Series 2007-2, 5.52%, 06/25/37# 420,688 438,355 CKE Restaurant Holdings, Inc., Class A2, Series 2013-1A, 372,006 378,253 4.47%, 03/20/43‡ CLI Funding V LLC, Class A, Series 2014-2A, 3.38%, 10/18/29‡ 933,333 939,274 Conseco Financial Corp., Class B1, Series 1995-5, 7.30%, 402,713 424,901 09/15/26@ Countrywide Asset-Backed Certificates, Class A3, Series 2004-S1, 5.12%, 722,357 738,209 02/25/35# Domino’s Pizza Master Issuer LLC, Class A2, Series 2012-1A, 5.22%, 01/25/42‡ 308,234 318,524 Drive Auto Receivables Trust, Class C, Series 2015-AA, 590,000 594,031 3.06%, 05/17/21‡ Drug Royalty II LP 2, Class A2, Series 2014-1, 3.48%, 408,009 414,011 07/15/23‡ DT Auto Owner Trust, Class C, Series 2013-2A, 3.06%, 09/16/19‡ 500,000 505,046 Investments Principal Value ASSET BACKED SECURITIES (continued) DT Auto Owner Trust, Class C, Series 2014-1A, 2.64%, $ 670,000 $ 674,787 10/15/19‡ DT Auto Owner Trust, Class C, Series 2014-2A, 2.46%, 300,000 300,991 01/15/20‡ DT Auto Owner Trust, Class C, Series 2014-3A, 3.04%, 560,000 565,294 09/15/20‡ Exeter Automobile Receivables Trust, Class B, Series 2013-2A, 180,000 181,991 3.09%, 07/16/18‡ Exeter Automobile Receivables Trust, Class C, Series 2013-1A, 500,000 508,608 3.52%, 02/15/19‡ Exeter Automobile Receivables Trust, Class C, Series 2014-1A, 3.57%, 07/15/19‡ 1,110,000 1,122,382 Exeter Automobile Receivables Trust, Class C, Series 2014-2A, 880,000 876,374 3.26%, 12/16/19‡ Exeter Automobile Receivables Trust, Class C, Series 2015-1A, 500,000 504,862 4.10%, 12/15/20‡ Exeter Automobile Receivables Trust, Class C, Series 2015-2A, 500,000 501,980 3.90%, 03/15/21‡ FDIC Trust, Class A, Series 2013-N1, 4.50%, 181,941 183,029 10/25/18‡ Federal Home Loan Mortgage Corporation, Class M2, Series 2014-DN2, 1.84%, 500,000 488,713 04/25/24@ Foursight Capital Automobile Receivables Trust, Class B, Series 2014-1, 3.56%, 11/22/21‡ 500,000 504,550 Gold Key Resorts LLC, Class A, Series 2014-A, 3.22%, 499,426 501,934 03/17/31‡ GSAA Trust, Class AF4, Series 2005-1, 5.62%, 11/25/34# 207,273 220,373 Hilton Grand Vacations Trust, Class A, Series 2013-A, 2.28%, 01/25/26‡ 1,036,622 1,043,058 Hilton Grand Vacations Trust, Class A, Series 2014-AA, 1.77%, 11/25/26‡ 339,920 337,431 Hyundai Auto Receivables Trust, Class D, Series 2014-B, 2.51%, 12/15/20 425,000 428,358 Hyundai Auto Receivables Trust, Class D, Series 2015-A, 2.73%, 06/15/21 500,000 505,955 Jefferies Resecuritization Trust, Class 1A1, Series 2014-R1, 660,411 662,747 4.00%, 12/27/37‡ JPMorgan Mortgage Trust, Class 2A1, Series 2014-IVR3, 667,429 672,741 3.00%, 09/25/44@‡ See accompanying Notes to Financial Statements. 85
90) ADVISORSHARES NEWFLEET MULTI-SECTOR INCOME ETF Schedule of Investments (continued) June 30, 2015 Investments Principal Value ASSET BACKED SECURITIES (continued) JPMorgan Mortgage Trust, Class 2A2, Series 2014-2, 3.50%, $ 261,679 $ 270,528 06/25/29@‡ LEAF Receivables Funding 9 LLC, Class D, Series 2013-1, 5.11%, 345,000 357,834 09/15/21‡ Marriott Vacation Club Owner Trust, Class A, Series 2012-1A, 1,011,224 1,022,484 2.51%, 05/20/30‡ MASTR Asset Securitization Trust, Class 4A5, Series 2003-5, 5.50%, 06/25/33 613,407 622,837 MASTR Specialized Loan Trust, Class A2, Series 2005-3, 5.70%, 449,764 468,584 11/25/35‡# Mid-State Trust, Class A4, Series 1997-6, 7.79%, 07/01/35 384,517 412,736 New Residential Mortgage Loan Trust, Class A, Series 2014-1A, 179,414 185,434 3.75%, 01/25/54@‡ OneMain Financial Issuance Trust, Class A, Series 2014-1A, 730,000 734,403 2.43%, 06/18/24‡ Residential Funding Mortgage Securities II Home Equity Loan Trust, Class AIIB, Series 2003-HS2, 0.44%, 133,755 126,803 06/25/28@ Santander Drive Auto Receivables Trust, Class C, Series 2012-3, 3.01%, 04/16/18 210,913 212,544 Santander Drive Auto Receivables Trust, Class C, Series 2012-4, 2.94%, 12/15/17 349,513 352,966 Santander Drive Auto Receivables Trust, Class C, Series 2013-3, 1.81%, 04/15/19 600,000 603,050 Santander Drive Auto Receivables Trust, Class C, Series 2014-3, 2.13%, 08/17/20 600,000 605,366 Santander Drive Auto Receivables Trust, Class D, Series 2012-2, 3.87%, 02/15/18 300,000 306,924 Santander Drive Auto Receivables Trust, Class D, Series 2012-6, 2.52%, 09/17/18 350,000 351,907 Santander Drive Auto Receivables Trust, Class D, Series 2013-1, 2.27%, 01/15/19 500,000 498,533 Santander Drive Auto Receivables Trust, Class D, Series 2013-5, 2.73%, 10/15/19 475,000 479,250 Santander Drive Auto Receivables Trust, Class D, Series 2014-4, 3.10%, 11/16/20 600,000 604,904 Sierra Timeshare Receivables Funding LLC, Class A, Series 2014-1A, 2.07%, 264,323 265,761 03/20/30‡ Investments Principal Value ASSET BACKED SECURITIES (continued) Sierra Timeshare Receivables Funding LLC, Class A, Series 2014-2A, 2.05%, $ 179,658 $ 180,961 06/20/31‡ Sierra Timeshare Receivables Funding LLC, Class B, Series 2012-2A, 3.42%, 173,408 175,795 03/20/29‡ Silverleaf Finance XV LLC, Class A, Series 2012-D, 3.00%, 172,612 174,508 03/17/25‡ Silverleaf Finance XVIII LLC, Class A, Series 2014-A, 2.81%, 714,545 714,116 01/15/27‡ SLM Private Education Loan Trust, Class A2A, Series 2013-B, 500,000 496,413 1.85%, 06/17/30‡ SLM Private Education Loan Trust, Class A2A, Series 2013-C, 2.94%, 10/15/31‡ 270,000 278,265 SLM Private Education Loan Trust, Class A2A, Series 2014-A, 1,275,000 1,296,424 2.59%, 01/15/26‡ SNAAC Auto Receivables Trust, Class C, Series 2014-1A, 330,000 330,989 2.21%, 01/15/20‡ SoFi Professional Loan Program LLC, Class A2, Series 2014-A, 3.02%, 10/25/27‡ 288,134 294,182 SoFi Professional Loan Program LLC, Class A2, Series 2014-B, 824,614 828,580 2.55%, 08/27/29‡ SoFi Professional Loan Program LLC, Class A2, Series 2015-A, 443,877 444,421 2.42%, 03/25/30‡ Structured Asset Securities Corp., Class A3A, Series 2004-4XS, 647,681 688,126 5.00%, 02/25/34# Structured Asset Securities Corp. Assistance Loan Trust, Class A, Series 2003-AL1, 3.36%, 1,327,487 1,310,145 04/25/31‡ Structured Asset Securities Corp. Mortgage Pass-Through Certificates, Class 3A3, Series 2004-15, 5.50%, 09/25/34 299,327 304,537 TAL Advantage V LLC, Class A, Series 2013-1A, 2.83%, 421,667 419,968 02/22/38‡ TAL Advantage V LLC, Class A, Series 2014-3A, 3.27%, 11/21/39‡ 470,833 475,256 TCF Auto Receivables Owner Trust, Class B, Series 2014-1A, 800,000 804,979 2.33%, 05/15/20‡ Tidewater Auto Receivables Trust, Class C, Series 2014-AA, 500,000 501,427 2.56%, 08/15/19‡ Trip Rail Master Funding LLC, Class A1, Series 2014-1A, 2.86%, 04/15/44‡ 273,318 273,040 See accompanying Notes to Financial Statements. 86
91) ADVISORSHARES NEWFLEET MULTI-SECTOR INCOME ETF Schedule of Investments (continued) June 30, 2015 Investments Principal ASSET BACKED SECURITIES (continued) Trip Rail Master Funding LLC, Class A1A, Series 2011-1A, $334,436 4.37%, 07/15/41‡ U-Haul S Fleet LLC, Class 1, Series 2010-BT1A, 4.90%, 600,411 10/25/23‡ Wachovia Bank Commercial Mortgage Trust, Class A5, Series 2007-C30, 5.34%, 12/15/43 90,000 Wells Fargo Mortgage Backed Securities Trust, Class A1, Series 2003-G, 2.52%, 33,785 06/25/33@ Wells Fargo Mortgage Backed Securities Trust, Class A1, Series 2004-U, 2.60%, 537,337 10/25/34@ Westgate Resorts LLC, Class A, Series 2012-2A, 3.00%, 199,488 01/20/25‡ Westlake Automobile Receivables Trust, Class C, Series 2014-1A, 500,000 1.70%, 11/15/19‡ Westlake Automobile Receivables Trust, Class C, Series 2015-1A, 500,000 2.29%, 11/16/20‡ Total Asset Backed Securities (Cost $56,890,093) Value Principal Value CORPORATE BONDS (continued) $ 344,767 625,304 94,610 34,150 536,890 200,211 498,913 499,893 56,980,504 CORPORATE BONDS — 18.8% Consumer Discretionary — 2.0% American Axle & Manufacturing, Inc., 5.13%, 02/15/19 CCO Holdings LLC/CCO Holdings Capital Corp., 5.25%, 03/15/21 CCO Holdings LLC/CCO Holdings Capital Corp., 5.25%, 09/30/22 D.R. Horton, Inc., 4.00%, 02/15/20 Dish DBS Corp., 4.63%, 07/15/17 GLP Capital LP/GLP Financing II, Inc., 4.88%, 11/01/20 Lennar Corp., 4.50%, 11/15/19 Marriott International, Inc., Series N, 3.13%, 10/15/21 QVC, Inc., 3.13%, 04/01/19 Time Warner Cable, Inc., 6.75%, 07/01/18 Toll Brothers Finance Corp., 4.00%, 12/31/18 Toll Brothers Finance Corp., 6.75%, 11/01/19 TRI Pointe Holdings, Inc., 4.38%, 06/15/19 Investments 115,000 118,019 80,000 80,000 85,000 83,938 160,000 159,952 230,000 237,474 530,000 305,000 541,925 310,338 520,000 505,000 520,229 502,044 205,000 228,722 375,000 383,437 117,000 130,455 355,000 349,675 Consumer Discretionary (continued) Wyndham Worldwide Corp., 2.50%, 03/01/18 $450,000 Total Consumer Discretionary Consumer Staples — 0.1% HJ Heinz Co., 2.80%, 07/02/20‡ Energy — 0.8% Antero Resources Corp., 5.63%, 06/01/23‡(a) California Resources Corp., 5.00%, 01/15/20(a) Kinder Morgan, Inc., 3.05%, 12/01/19 Kinder Morgan, Inc., 5.63%, 11/15/23‡ Newfield Exploration Co., 5.75%, 01/30/22 NGL Energy Partners LP/NGL Energy Finance Corp., 5.13%, 07/15/19 Parker Drilling Co., 6.75%, 07/15/22 Sabine Oil & Gas Corp., 7.25%, 06/15/19^ Total Energy Financials — 9.1% Ally Financial, Inc., 3.25%, 02/13/18 Ally Financial, Inc., 3.60%, 05/21/18 Ally Financial, Inc., 3.75%, 11/18/19 Ally Financial, Inc., 4.13%, 03/30/20 Ally Financial, Inc., 4.13%, 02/13/22 American International Group, Inc., 3.38%, 08/15/20 Ares Capital Corp., 3.88%, 01/15/20 Associated Banc-Corp., 5.13%, 03/28/16 Associates Corp. of North America, 6.95%, 11/01/18 Aviation Capital Group Corp., 3.88%, 09/27/16‡ Bank of America Corp., 2.00%, 01/11/18 Bank of America Corp., Series L, 5.65%, 05/01/18 Bank of America Corp., 5.49%, 03/15/19 Bank of New York Mellon Corp. (The), Series E, 4.95%, 12/29/49@ See accompanying Notes to Financial Statements. 87 $ 451,437 4,097,645 185,000 185,355 210,000 203,963 210,000 185,850 100,000 99,992 445,000 474,136 140,000 142,800 335,000 335,838 100,000 86,750 92,000 20,700 1,550,029 225,000 223,875 125,000 125,313 285,000 283,575 270,000 270,167 90,000 86,625 335,000 347,154 280,000 284,904 60,000 61,807 415,000 477,811 430,000 437,738 235,000 235,914 200,000 219,846 66,000 72,402 395,000 392,531
92) ADVISORSHARES NEWFLEET MULTI-SECTOR INCOME ETF Schedule of Investments (continued) June 30, 2015 Investments Principal Value Investments CORPORATE BONDS (continued) Financials (continued) Lazard Group LLC, 4.25%, 11/14/20 Lincoln National Corp., 8.75%, 07/01/19 Lincoln National Corp., 6.05%, 04/20/67@ Morgan Stanley, 5.55%, 04/27/17 Morgan Stanley, 2.13%, 04/25/18 MPT Operating Partnership LP/MPT Finance Corp., 6.38%, 02/15/22 National Retail Properties, Inc., 5.50%, 07/15/21 Navient Corp., 4.88%, 06/17/19 New York Life Global Funding, 1.95%, 02/11/20‡ Progressive Corp. (The), 6.70%, 06/15/37@ Prudential Financial, Inc., 5.20%, 03/15/44@ Santander Holdings USA, Inc., 3.00%, 09/24/15 Santander Holdings USA, Inc., 2.65%, 04/17/20 SBA Tower Trust, 2.93%, 12/15/17‡ Select Income REIT, 4.15%, 02/01/22 Senior Housing Properties Trust, 3.25%, 05/01/19 Springleaf Finance Corp., 5.25%, 12/15/19 State Street Corp., 4.96%, 03/15/18 TIAA Asset Management Finance Co. LLC, 2.95%, 11/01/19‡ Ventas Realty LP, 4.00%, 04/30/19 Voya Financial, Inc., 2.90%, 02/15/18 Wells Fargo & Co., 5.13%, 09/15/16 Willis North America, Inc., 6.20%, 03/28/17 Zions Bancorporation, 4.50%, 03/27/17 Total Financials Value CORPORATE BONDS (continued) Financials (continued) Bear Stearns Cos. LLC (The), 7.25%, 02/01/18 Capital One Financial Corp., 6.15%, 09/01/16 Corporate Office Properties LP, 3.70%, 06/15/21 Countrywide Financial Corp., 6.25%, 05/15/16 DDR Corp., 7.88%, 09/01/20 DDR Corp., 3.50%, 01/15/21 Digital Realty Trust LP, 3.95%, 07/01/22 DuPont Fabros Technology LP, 5.88%, 09/15/21 Fifth Third Bancorp, 4.50%, 06/01/18 First Tennessee Bank NA, 2.95%, 12/01/19 Ford Motor Credit Co. LLC, 8.13%, 01/15/20 FS Investment Corp., 4.25%, 01/15/20 FS Investment Corp., 4.75%, 05/15/22 General Motors Financial Co., Inc., 2.40%, 04/10/18 Genworth Holdings, Inc., 7.63%, 09/24/21 Goldman Sachs Group, Inc. (The), 5.63%, 01/15/17 Government Properties Income Trust, 3.75%, 08/15/19 HCP, Inc., 3.75%, 02/01/19 Healthcare Trust of America Holdings LP, 3.38%, 07/15/21 Hertz Corp. (The), 5.88%, 10/15/20 HSBC Finance Corp., 6.68%, 01/15/21 HSBC USA, Inc., 1.70%, 03/05/18 HSBC USA, Inc., 2.63%, 09/24/18 Huntington Bancshares, Inc., 7.00%, 12/15/20 International Lease Finance Corp., 3.88%, 04/15/18 iStar Financial, Inc., 4.00%, 11/01/17 Jefferies Group LLC, 5.13%, 04/13/18 JPMorgan Chase & Co., 6.13%, 06/27/17 JPMorgan Chase & Co., 2.25%, 01/23/20 JPMorgan Chase & Co., Series Z, 5.30%, 12/29/49@ Principal $ 75,000 $ 84,992 400,000 422,313 460,000 456,316 130,000 280,000 145,000 135,133 343,134 147,225 270,000 269,848 475,000 483,313 321,000 340,241 250,000 250,132 455,000 556,178 435,000 440,157 160,000 156,733 355,000 356,119 200,000 211,000 670,000 709,737 85,000 175,000 87,515 182,180 150,000 149,443 440,000 447,700 225,000 200,000 225,000 260,609 199,527 229,951 200,000 238,501 390,000 392,925 410,000 404,363 275,000 292,397 280,000 302,938 380,000 373,660 40,000 39,804 Health Care — 1.0% AbbVie, Inc., 2.50%, 05/14/20 CHS/Community Health Systems, Inc., 5.13%, 08/15/18 Forest Laboratories LLC, 4.38%, 02/01/19‡ See accompanying Notes to Financial Statements. 88 $275,000 $ 289,498 125,000 153,389 100,000 90,750 425,000 455,586 180,000 181,290 45,000 48,150 250,000 285,000 279,845 282,863 65,000 64,078 430,000 450,424 300,000 298,275 115,000 115,321 475,000 467,497 725,000 735,949 515,000 510,847 415,000 415,671 455,000 449,881 300,000 322,698 400,000 403,201 310,000 327,832 365,000 374,797 75,000 78,631 250,000 267,785 195,000 203,689 19,751,693 75,000 74,315 170,000 174,675 200,000 211,844
93) ADVISORSHARES NEWFLEET MULTI-SECTOR INCOME ETF Schedule of Investments (continued) June 30, 2015 Investments Principal Value CORPORATE BONDS (continued) Health Care (continued) HCA, Inc., 3.75%, 03/15/19 HCA, Inc., 6.50%, 02/15/20 Hologic, Inc., 5.25%, 07/15/22‡ Owens & Minor, Inc., 3.88%, 09/15/21 Quintiles Transnational Corp., 4.88%, 05/15/23‡ Tenet Healthcare Corp., 6.25%, 11/01/18 Tenet Healthcare Corp., 5.00%, 03/01/19‡ Tenet Healthcare Corp., 3.79%, 06/15/20@‡ Tenet Healthcare Corp., 6.00%, 10/01/20 Zimmer Biomet Holdings, Inc., 2.70%, 04/01/20 Zimmer Biomet Holdings, Inc., 3.15%, 04/01/22 Total Health Care Principal Value CORPORATE BONDS (continued) $ 160,000 $ 185,000 40,000 161,600 207,200 40,950 95,000 97,844 170,000 171,275 150,000 163,313 60,000 60,225 260,000 262,599 105,000 112,219 295,000 293,865 295,000 Industrials — 4.2% ADT Corp. (The), 6.25%, 10/15/21(a) America West Airlines 1999-1 Pass-Through Trust, Series 991G, 7.93%, 01/02/19 America West Airlines 2001-1 Pass-Through Trust, Series 011G, 7.10%, 04/02/21 American Airlines Group, Inc., 4.63%, 03/01/20‡ Atlas Air 2000-1 Class A Pass-Through Trust, Series 00-1, 8.71%, 01/02/19 Continental Airlines 1999-1 Class A Pass-Through Trust, Series 991A, 6.55%, 02/02/19 Continental Airlines 1999-2 Class C-2 Pass-Through Trust, Series AMBC, 6.24%, 03/15/20 Continental Airlines 2000-1 Class A-1 Pass-Through Trust, Series 00A1, 8.05%, 11/01/20 Continental Airlines 2001-1 Class A-1 Pass-Through Trust, Series 01A1, 6.70%, 06/15/21 Delta Air Lines 2012-1 Class A Pass-Through Trust, Series A, 4.75%, 05/07/20 Delta Air Lines Class A Pass-Through Trust, Series 2010-2A, 4.95%, 05/23/19 HD Supply, Inc., 5.25%, 12/15/21‡(a) Investments 290,615 2,322,539 540,000 569,699 349,660 377,633 1,012,770 1,098,854 195,000 189,150 260,451 266,311 313,913 343,923 217,150 234,522 479,434 543,535 854,172 907,558 1,008,033 1,078,595 662,176 701,906 360,000 366,300 Industrials (continued) Masco Corp., 5.95%, 03/15/22 Northwest Airlines 2002-1 Class G-2 Pass-Through Trust, Series 02-1, 6.26%, 11/20/21 Penske Truck Leasing Co. LP/PTL Finance Corp., 3.38%, 02/01/22‡ Textron, Inc., 4.63%, 09/21/16 UAL 2009-2a Pass-Through Trust, Series 09-2, 9.75%, 01/15/17 United Rentals North America, Inc., 7.38%, 05/15/20 United Rentals North America, Inc., 4.63%, 07/15/23 Total Industrials Information Technology — 0.3% Dun & Bradstreet Corp. (The), 3.25%, 12/01/17 Dun & Bradstreet Corp. (The), 4.00%, 06/15/20 Juniper Networks, Inc., 3.30%, 06/15/20 Oracle Corp., 2.50%, 05/15/22 Total Information Technology Materials — 0.2% Hexion, Inc., 6.63%, 04/15/20 Huntsman International LLC, 4.88%, 11/15/20 Tronox Finance LLC, 6.38%, 08/15/20(a) Total Materials $400,000 451,000 535,587 560,332 230,000 400,000 223,606 416,165 429,764 467,369 150,000 160,799 310,000 305,149 9,262,406 150,000 152,627 150,000 150,879 110,000 110,903 200,000 194,383 608,792 $175,000 161,438 200,000 200,500 120,000 111,900 473,838 Telecommunication Services — 0.7% AT&T, Inc., 3.88%, 08/15/21 210,000 AT&T, Inc., 3.00%, 06/30/22 205,000 Frontier Communications Corp., 7.13%, 03/15/19 250,000 Frontier Communications Corp., 6.25%, 09/15/21 185,000 T-Mobile USA, Inc., 6.46%, 04/28/19 275,000 Verizon Communications, Inc., 2.50%, 09/15/16 43,000 Verizon Communications, Inc., 3.65%, 09/14/18 50,000 Verizon Communications, Inc., 2.55%, 06/17/19 200,000 Verizon Communications, Inc., 4.60%, 04/01/21 125,000 Total Telecommunication Services See accompanying Notes to Financial Statements. 89 $ 216,900 198,249 259,375 169,275 283,938 43,711 52,629 202,924 134,495 1,561,496
94) ADVISORSHARES NEWFLEET MULTI-SECTOR INCOME ETF Schedule of Investments (continued) June 30, 2015 Investments Principal Value Investments Principal CORPORATE BONDS (continued) TERM LOANS (continued) Utilities — 0.4% AmeriGas Finance LLC/AmeriGas Finance Corp., 6.75%, 05/20/20 AmeriGas Finance LLC/AmeriGas Finance Corp., 7.00%, 05/20/22 Energy Transfer Partners LP, 4.15%, 10/01/20 Exelon Corp., 2.85%, 06/15/20 Talen Energy Supply LLC, 5.13%, 07/15/19‡ Total Utilities Total Corporate Bonds (Cost $40,842,839) Consumer Discretionary (continued) MGM Resorts International, $355,911 3.50%, 12/20/19@ 297,000 PetSmart Inc, 4.25%, 03/10/22@ Pinnacle Entertainment, Inc., 230,592 3.75%, 08/13/20@ 257,528 PVH Corp., 3.25%, 02/13/20@ Seminole Hard Rock Entertainment, Inc., 3.50%, 58,800 05/14/20@ Seminole Tribe of Florida, Inc., 380,484 3.00%, 04/29/20@ Six Flags Theme Parks, Inc., 153,000 0.00%, 06/30/22@(b) 191,911 SRAM LLC, 5.25%, 04/10/20@ Staples, Inc., 0.00%, 04/24/21@(b) 248,000 TI Group Automotive Systems LLC, 0.00%, 06/25/22@(b) 38,000 Tribune Media Co., 0.00%, 419,006 12/27/20@(b) Univision Communications, Inc., 4.00%, 03/01/20@ 702,359 Univision Communications, Inc., 4.00%, 03/01/20@ 407,055 Virgin Media Investment Holdings Ltd., 3.50%, 336,661 06/30/23 (United Kingdom)@ Total Consumer Discretionary Value $ 45,000 $ 47,588 235,000 250,275 250,000 70,000 257,233 70,486 265,000 261,025 886,607 40,700,400 TERM LOANS — 12.2% Consumer Discretionary — 4.3% Allison Transmission, Inc., 3.50%, 08/23/19@ Aristocrat International Pty Ltd., 4.75%, 10/20/21 (Australia)@ Boyd Gaming Corp., 4.00%, 08/14/20@ Caesars Entertainment Corp., 11.25%, 10/31/16@^ Caesars Entertainment Corp., 11.50%, 03/01/17@^ CBAC Borrower LLC, 8.25%, 07/02/20@ CDS US Intermediate Holdings, Inc., 0.00%, 07/08/22@(b) Cequel Communications LLC, 3.50%, 02/14/19@ Charter Communications Operating, LLC, 3.00%, 07/01/20@ CityCenter Holdings LLC, 4.25%, 10/16/20@ CSC Holdings LLC, 2.69%, 04/17/20@ FCA U.S. LLC, 3.25%, 12/31/18@ General Nutrition Centers, Inc., 3.25%, 03/04/19@ Hanesbrands, Inc., 3.25%, 04/29/22@ Hilton Worldwide Finance LLC, 3.50%, 10/25/20@ Landry’s, Inc., 4.00%, 04/24/18@ Las Vegas Sands, LLC, 3.25%, 12/19/20@ Libbey Glass, Inc., 3.75%, 04/09/21@ Life Time Fitness, Inc., 4.25%, 06/10/22@ 40,896 41,038 410,308 412,651 290,219 291,347 136,711 124,451 55,720 48,745 200,000 185,500 189,000 189,236 482,446 481,508 414,710 410,737 243,658 244,343 453,348 325,875 449,381 325,626 323,397 319,255 32,918 33,164 402,855 192,550 403,485 193,373 537,380 535,548 314,820 315,116 265,000 263,443 Industrials — 1.6% Air Canada, 4.00%, 09/26/19@ Alliant Techsystems, Inc., 3.50%, 11/02/20@ American Airlines, Inc., 3.50%, 06/27/20@ American Airlines, Inc., 3.75%, 10/10/21@ Avis Budget Car Rental LLC, 3.00%, 03/15/19@ AWAS Finance Luxembourg 2012 SA, 3.50%, 07/16/18@ DigitalGlobe, Inc., 3.75%, 01/31/20@ McJunkin Red Man Corp., 5.00%, 11/09/19@ Nortek, Inc., 3.50%, 10/30/20@ Nortek, Inc., 3.50%, 10/30/20@ TransDigm, Inc., 3.75%, 06/04/21@ United Airlines, Inc., 3.75%, 09/15/21@ Total Industrials See accompanying Notes to Financial Statements. 90 $ 354,042 296,777 230,942 259,163 58,714 380,769 153,311 190,711 247,936 37,953 419,791 697,841 404,694 333,856 9,334,447 233,238 234,186 331,373 331,941 305,000 302,905 254,000 253,643 610,197 611,979 496,612 498,010 167,513 167,827 57,400 111,000 481,145 57,053 110,376 478,838 173,250 172,178 266,983 267,818 3,486,754
95) ADVISORSHARES NEWFLEET MULTI-SECTOR INCOME ETF Schedule of Investments (continued) June 30, 2015 Investments Principal Value Investments TERM LOANS (continued) Consumer Staples — 0.7% Albertson’s Holdings LLC, 5.50%, 08/25/21@ ARAMARK Corp., 3.25%, 09/07/19@ ARAMARK Corp., 3.25%, 02/24/21@ HJ Heinz Co., 3.25%, 06/05/20@ Hostess Brands, Inc., 6.75%, 03/20/20@ Spectrum Brands, Inc., 0.00%, 06/23/22@(b) Total Consumer Staples Value TERM LOANS (continued) Information Technology — 1.5% Avago Technologies Cayman Ltd., 3.75%, 05/06/21 $618,210 (Cayman Islands)@ Blue Coat Systems. Inc., 4.50%, 220,000 05/26/22@ 22,706 Deltek, Inc., 0.00%, 06/25/22@(b) First Data Corp., 3.69%, 732,000 03/24/18@ Infinity Acquisition LLC/Infinity Acquisition Finance Corp., 250,110 4.00%, 08/06/21@ Infor U.S., Inc., 3.75%, 241,463 06/03/20@ Interactive Data Corp., 4.75%, 293,919 05/02/21@ 431,462 Kronos Inc., 4.50%, 10/30/19@ SunGard Data Systems, Inc., 4.00%, 03/08/20@ 485,000 Total Information Technology Principal Financials — 1.0% Delos Finance Sarl, 3.50%, 03/06/21 (Luxembourg)@ Realogy Group LLC, 3.75%, 03/05/20@ TransUnion LLC, 3.75%, 04/09/21@ Walter Investment Management Corp., 4.75%, 12/18/20@ Total Financials $ 619,892 219,863 22,763 730,495 248,859 238,621 295,204 432,325 485,453 3,293,475 633,000 494,975 494,512 630,167 625,932 395,980 Health Care — 1.1% Alere, Inc., 0.00%, 06/18/22@(b) CHS/Community Health Systems, Inc., 3.53%, 12/31/18@ ConvaTec, Inc., 0.00%, 12/22/16@(b) Davita HealthCare Partners, Inc., 3.50%, 06/24/21@ Endo Luxembourg Finance I Co. Sarl, 0.00%, 06/24/16@(b) Endo Luxembourg Finance I Co. Sarl, 0.00%, 06/24/22@(b) Endo Luxemburg Finance I Co. Sarl, 3.25%, 02/28/21@ IASIS Healthcare LLC, 4.50%, 05/03/18@ Quintiles Transnational Corp, 3.25%, 05/12/22@ RPI Finance Trust, 3.25%, 11/09/18@ RPI Finance Trust, 3.50%, 11/09/20@ Valeant Pharmaceuticals International, Inc., 3.50%, 02/13/19 (Canada)@ Total Health Care 632,842 375,068 2,128,354 239,000 239,502 269,895 270,219 20,000 20,018 107,910 108,106 93,000 93,000 147,000 147,322 296,250 297,237 219,375 220,014 76,000 412,457 305,233 305,996 259,734 259,450 2,449,559 Utilities — 0.5% Calpine Corp., 3.50%, 05/27/22@ NRG Energy, Inc., 2.75%, 07/01/18@ Total Utilities Energy — 0.5% Fieldwood Energy LLC, 3.88%, 09/28/18@ MEG Energy Corp., 3.75%, 03/31/20 (Canada)@ Seadrill Operating LP, 4.00%, 02/21/21@ Total Energy Materials — 0.4% AZ Chem U.S., Inc., 4.50%, 06/12/21@ FMG Resources Pty. Ltd., 3.75%, 06/30/19 (Australia)@ Ineos U.S. Finance LLC, 3.75%, 12/15/20@ Total Materials Total Term Loans (Cost $26,576,185) See accompanying Notes to Financial Statements. 91 $ 270,996 518,950 519,228 497,481 317,637 496,327 318,055 154,688 157,395 69,000 69,518 1,831,519 Telecommunication Services — 0.6% Crown Castle Operating Co., 662,224 3.00%, 01/31/21@ Level 3 Financing, Inc., 4.00%, 01/15/20@ 225,000 Level 3 Financing, Inc., 3.50%, 05/31/22@ 110,000 Total Telecommunication Services 76,238 410,969 $269,325 659,531 225,352 109,393 994,276 449,000 445,857 631,794 627,659 1,073,516 197,915 189,071 574,054 563,135 249,492 189,537 941,743 88,468 88,579 634,124 564,659 195,764 194,826 848,064 26,381,707
96) ADVISORSHARES NEWFLEET MULTI-SECTOR INCOME ETF Schedule of Investments (continued) June 30, 2015 Investments Principal Value Investments Principal Value FOREIGN BONDS — 6.0% FOREIGN BONDS (continued) Consumer Discretionary — 0.3% International Game Technology PLC, 5.63%, 02/15/20 $485,000 (United Kingdom)‡ Volkswagen Group of America Finance LLC, 2.45%, 200,000 11/20/19‡ Total Consumer Discretionary Financials (continued) Macquarie Group Ltd., 6.00%, $ 290,000 $ 326,186 01/14/20 (Australia)‡ Royal Bank of Scotland Group PLC, 6.40%, 10/21/19 (United Kingdom) 350,000 391,504 Schaeffler Finance BV, 4.25%, 375,000 367,500 05/15/21 (Germany)‡ Volkswagen Group of America 600,000 597,344 Finance LLC, 2.40%, 05/22/20‡ XLIT Ltd., Series E, 6.50%, 105,000 90,104 12/29/49 (Ireland)@ Total Financials 6,501,636 Energy — 0.3% Petroleos Mexicanos, 6.00%, 03/05/20 (Mexico) Weatherford International Ltd., 9.63%, 03/01/19 (Bermuda) Total Energy $ 476,513 200,893 677,406 350,000 150,000 Financials — 3.0% AerCap Ireland Capital Ltd./AerCap Global Aviation Trust, 4.25%, 07/01/20 (Ireland) AerCap Ireland Capital Ltd./AerCap Global Aviation Trust, 4.50%, 05/15/21 (Ireland)‡ Aircastle Ltd., 5.13%, 03/15/21 (Bermuda) American Tower Trust, 1.55%, 03/15/18‡ Axis Bank Ltd., 3.25%, 05/21/20 (India)‡ Banco Santander Chile, 2.15%, 06/07/18 (Chile)@‡ Cooperatieve Centrale RaiffeisenBoerenleenbank BA, 2.25%, 01/14/19 (Netherlands) Corp. Andina de Fomento, 3.75%, 01/15/16 (Supranational) Corpbanca SA, 3.88%, 09/22/19 (Chile)‡ Daimler Finance North America LLC, 2.45%, 05/18/20‡ Guanay Finance Ltd., 6.00%, 12/15/20 (Cayman Islands)‡ Industrial & Commercial Bank of China Ltd., 3.23%, 11/13/19 (China) Intesa Sanpaolo SpA, 3.13%, 01/15/16 (Italy) Itau Unibanco Holding SA, 2.85%, 05/26/18 (Brazil)‡ Korea Development Bank (The), 4.63%, 11/16/21 (South Korea) 392,000 175,274 567,274 165,000 165,309 165,000 166,238 210,000 212,625 347,000 345,529 450,000 448,449 200,000 203,500 300,000 302,215 100,000 101,035 500,000 508,763 500,000 497,111 460,000 477,112 475,000 484,348 200,000 201,551 200,000 198,900 375,000 416,313 Health Care — 0.4% Actavis Funding SCS, 3.00%, 03/12/20 (Luxembourg) Actavis Funding SCS, 3.45%, 03/15/22 (Luxembourg) Mallinckrodt International Finance SA/Mallinckrodt CB LLC, 4.88%, 04/15/20 (Luxembourg)‡ Valeant Pharmaceuticals International, Inc., 6.75%, 08/15/18 (Canada)‡ Valeant Pharmaceuticals International, Inc., 5.38%, 03/15/20 (Canada)‡ Total Health Care Industrials — 0.9% Air Canada 2013-1 Class B Pass-Through Trust, 5.38%, 05/15/21 (Canada)‡ Bombardier, Inc., 4.75%, 04/15/19 (Canada)‡ Virgin Australia Trust, Series 2013-1A, 5.00%, 10/23/23 (Australia)‡ Total Industrials Information Technology — 0.4% Alibaba Group Holding Ltd., 2.50%, 11/28/19 (Cayman Islands)‡ NXP BV/NXP Funding LLC, 4.13%, 06/15/20 (Netherlands)‡ Total Information Technology Materials — 0.1% Anglo American Capital PLC, 3.63%, 05/14/20 (United Kingdom)‡ Methanex Corp., 3.25%, 12/15/19 (Canada) Total Materials See accompanying Notes to Financial Statements. 92 85,000 85,405 85,000 84,320 20,000 20,426 85,000 89,303 640,000 662,400 941,854 496,351 516,205 370,000 361,675 1,007,679 1,050,505 1,928,385 700,000 693,074 240,000 242,400 935,474 200,000 200,244 100,000 100,713 300,957
97) ADVISORSHARES NEWFLEET MULTI-SECTOR INCOME ETF Schedule of Investments (continued) June 30, 2015 Investments Principal Value FOREIGN BONDS (continued) Telecommunication Services — 0.2% Millicom International Cellular SA, 6.63%, 10/15/21 $ 280,000 $ (Luxembourg)‡ Telefonica Emisiones SAU, 6.42%, 06/20/16 (Spain) 100,000 Total Telecommunication Services Utilities — 0.4% Majapahit Holding BV, 7.75%, 01/20/20 (Indonesia)‡ State Grid Overseas Investment 2014 Ltd., 2.75%, 05/07/19 (China)‡ Total Utilities Total Foreign Bonds (Cost $13,002,962) 289,100 104,584 393,684 245,000 283,894 500,000 505,507 789,401 13,036,071 U.S. TREASURY NOTES — 2.0% U.S. Treasury Note, 04/15/18, 0.75% U.S. Treasury Note, 03/31/20, 1.38% Total U.S. Treasury Notes (Cost $4,252,218) 1,250,000 1,243,555 3,000,000 2,970,702 4,214,257 U.S. GOVERNMENT AGENCY SECURITIES — 0.6% Federal Home Loan Mortgage Corporation, Class J, Series 2012-4011, 4.00%, 12/15/41 698,308 741,787 Federal National Mortgage Association, Class NA, Series 2009-36, 5.00%, 06/25/37 136,900 146,631 Federal National Mortgage Association, Class PA, Series 2010-57, 4.50%, 12/25/38 21,550 21,560 Federal National Mortgage Association, Class PA, Series 2012-10, 4.00%, 11/25/41 418,417 438,607 Total U.S. Government Agency Securities (Cost $1,320,616) 1,348,585 MONEY MARKET FUND — 4.7% BofA Cash Reserves Money Market Fund − Capital Class, 0.05%(c) (Cost $10,181,323) Investments Principal Value REPURCHASE AGREEMENTS (continued) HSBC Securities USA, Inc., dated 06/30/15, due 07/01/15, 0.12%, total to be received $140,829, (collateralized by various U.S. Government Agency Obligations, 2.50% − 6.50%, 07/01/18 − 07/01/45, totaling $143,646) $140,829 $ Mizuho Securities USA, Inc., dated 06/30/15, due 07/01/15, 0.14%, total to be received $250,001, (collateralized by various U.S. Government Agency Obligations, 0.00% − 8.50%, 06/13/16 − 04/20/44, totaling $255,000) 250,000 Morgan Stanley & Co. LLC, dated 06/30/15, due 07/01/15, 0.09%, total to be received $250,001, (collateralized by various U.S. Government Agency Obligations, 0.75% − 9.50%, 02/16/16 − 05/01/45, totaling $255,000) 250,000 Total Repurchase Agreements (Cost $753,918) Total Investments — 100.4% (Cost $218,597,969) Liabilities in Excess of Other Assets — (0.4)% Net Assets — 100.0% 140,829 250,000 250,000 753,918 216,811,382 (870,576) $215,940,806 PLC − Public Limited Company 10,181,323 Is In Default. ‡ Security was purchased pursuant to Rule 144A under the Securities Act of 1933 and may not be resold subject to that rule except to qualified institutional buyers. Unless otherwise noted, 144A securities are deemed to be liquid. @ Variable rate instrument. The interest rate shown reflects the rate in effect at June 30, 2015. # Represents step coupon bond. Rate shown reflects the rate in effect as of June 30, 2015. (a) REPURCHASE AGREEMENTS — 0.3%(d) Citibank NA, dated 06/30/15, due 07/01/15, 0.14%, total to be received $113,089, (collateralized by various U.S. Government Agency Obligations, 0.63% − 6.50%, 11/15/16 − 07/01/45, totaling $115,351) 113,089 ^ All or a portion of security is on loan. The aggregate market value of the securities on loan is $1,376,040; the aggregate market value of the collateral held by the fund is $1,412,003. The aggregate market value of the collateral includes non-cash securities collateral having a value of $658,085. (b) This Loan will settle after June 30, 2015 at which time the interest rate will be determined. (c) Rate shown reflects the 7-day yield as of June 30, 2015. (d) Collateral received from brokers for securities lending was invested in these short-term investments. 10,181,323 113,089 See accompanying Notes to Financial Statements. 93
98) ADVISORSHARES NEWFLEET MULTI-SECTOR INCOME ETF Schedule of Investments (continued) June 30, 2015 SUMMARY OF SCHEDULE OF INVESTMENTS Asset Backed Securities Commercial Mortgage Backed Securities Consumer Discretionary Consumer Staples Energy Financials Health Care Industrials Information Technology Materials Non-Agency Mortgage-Backed Securities Residential Mortgage Backed Securities Telecommunication Services U.S. Government Agency Securities U.S. Treasury Note Utilities Money Market Fund Repurchase Agreements Total Investments Liabilities in Excess of Other Assets Net Assets % of Net Assets 26.4% 18.8 6.6 0.8 1.6 13.1 2.5 6.7 2.2 0.7 1.6 9.0 1.5 0.6 2.0 1.3 4.7 0.3 100.4 (0.4) 100.0% See accompanying Notes to Financial Statements. 94
99) ADVISORSHARES PACIFIC ASSET ENHANCED FLOATING RATE ETF Schedule of Investments June 30, 2015 Investments Principal Value TERM LOANS — 87.0% Investments Principal Value TERM LOANS (continued) Advertising — 1.8% Acosta, Inc., 4.25%, 09/26/21@ $498,747 Aerospace & Defense — 3.4% Hamilton Sundstrand Industrial (Luxembourg), 4.00%, 12/13/19@ TransDigm, Inc., 3.75%, 02/28/20@ Total Aerospace & Defense 500,000 Building Materials — 3.6% GYP Holdings III Corp., 4.75%, 04/01/21@ Roofing Supply Group LLC, 5.00%, 05/31/19@ Total Building Materials 483,750 497,487 497,301 497,487 493,291 990,592 483,778 500,000 501,250 985,028 248,750 497,401 500,000 498,176 250,000 248,789 250,000 251,355 497,487 499,664 497,494 Distribution/Wholesale — 1.8% Spin Holdco, Inc., 4.25%, 11/14/19@ 250,170 497,590 500,080 1,247,840 497,604 Commercial Services — 7.3% Allied Security Holdings LLC, 4.25%, 02/12/21@ Brickman Group Ltd. LLC (The), 5.25%, 12/18/20 Brickman Group Ltd. LLC (The), 7.50%, 12/17/21@ Interactive Data Corp., 4.75%, 04/30/21@ ServiceMaster Co. LLC (The), 4.25%, 07/01/21@ Total Commercial Services Environmental Control — 0.9% Waste Industries USA, Inc., 4.25%, 02/27/20@ Hand/Machine Tools — 1.8% Apex Tool Group LLC, 4.50%, 01/31/20@ 440,804 924,554 498,741 Chemicals — 4.6% MacDermid, Inc., 4.75%, 06/07/20@ Univar, Inc., 5.00%, 06/30/17@ Univar, Inc., 4.50%, 07/01/22@ Total Chemicals Entertainment — 1.8% Scientific Games International, Inc., 6.00%, 10/01/21@ 248,958 250,000 Auto Parts & Equipment — 3.6% Cooper-Standard Automotive, 4.00%, 04/04/21@ Federal-Mogul Holdings Corp., 4.75%, 04/15/21@ Total Auto Parts & Equipment 497,929 Food — 3.7% Albertsons LLC, 5.38%, 03/21/19@ U.S. Foods, Inc., 4.50%, 03/31/19@ Total Food 443,501 Airlines — 0.9% Landmark Aviation, 8.25%, 01/25/21@ $ 498,272 1,996,256 498,123 Diversified Financial Services — 2.7% AlixPartners LLP, 4.00%, 248,782 07/10/20@ Onex Wizard U.S. Acquisition, 498,750 Inc., 4.25%, 03/11/22@ Total Diversified Financial Services 497,189 248,121 499,187 Healthcare − Services — 3.7% CHS/Community Health Systems, Inc., 3.75%, 12/31/19@ CHS/Community Health Systems, Inc., 4.00%, 01/27/21@ IASIS Healthcare LLC, 4.50%, 05/03/18@ Total Healthcare − Services $497,500 $ 497,876 249,375 250,389 498,750 501,339 497,462 498,877 1,000,216 498,090 489,789 175,613 175,858 323,124 324,079 498,721 500,175 1,000,112 Household Products/Wares — 1.8% Reynolds Group Holdings, Inc., 487,336 4.50%, 12/01/18@ 489,621 Insurance — 1.8% HUB International Ltd., 4.00%, 10/02/20@ USI, Inc., 4.25%, 12/27/19@ Total Insurance 248,741 248,734 247,264 248,942 496,206 248,736 247,042 248,744 237,007 250,000 250,250 500,000 501,937 989,194 248,737 226,973 248,744 213,298 Internet — 0.9% Zayo Group LLC, 3.75%, 05/06/21@ Leisure Time — 3.6% 24 Hour Fitness Worldwide, Inc., 4.75%, 05/28/21@ Bombardier Recreational Products, Inc., 3.75%, 01/30/19@ ClubCorp Club Operations, Inc., 4.25%, 07/24/20@ Total Leisure Time Lodging — 2.5% Caesars Entertainment Resort Properties LLC, 7.00%, 10/09/20@ Caesars Growth Properties Holdings LLC, 6.25%, 05/08/21@ 747,308 See accompanying Notes to Financial Statements. 95
100) ADVISORSHARES PACIFIC ASSET ENHANCED FLOATING RATE ETF Schedule of Investments (continued) June 30, 2015 Investments Principal Value Investments TERM LOANS (continued) Retail (continued) PetSmart, Inc., 4.25%, 03/11/22@ Pilot Travel Centers LLC, 4.25%, 10/01/21@ Rite Aid Corp., 5.75%, 08/21/20@ Smart & Final Stores LLC, 4.00%, 11/15/19@ Total Retail Value TERM LOANS (continued) Lodging (continued) Hilton Worldwide Finance LLC, 3.50%, 10/26/20@ Total Lodging Principal $233,750 Machinery-Diversified — 2.9% Husky Injection Molding Systems Ltd., 7.25%, 06/30/22@ Rexnord, 4.00%, 08/21/20@ Total Machinery-Diversified Media — 1.8% Cequel Communications LLC, 3.50%, 02/14/19@ iHeartCommunications, Inc., 6.94%, 01/30/19@ Total Media 300,000 497,468 $ 234,115 674,386 297,375 496,777 794,152 250,000 250,000 Mining — 1.6% FMG Resources Pty. Ltd. (Australia), 3.75%, 06/30/19@ 249,514 231,620 481,134 497,468 442,973 Miscellaneous Manufacturing — 0.9% Gates Global LLC, 4.25%, 248,747 07/06/21@ 245,344 Packaging & Containers — 3.6% Ardagh Holdings USA, Inc., 4.00%, 12/17/19@ BWAY Holding Co., 5.50%, 08/14/20@ Total Packaging & Containers Pharmaceuticals — 0.9% Par Pharmaceutical Cos., Inc., 4.00%, 09/30/19@ $ 499,625 496,241 250,000 501,874 252,891 250,000 249,844 5,051,435 Semiconductors — 1.8% Freescale Semiconductor, Inc., 5.00%, 01/15/21@ 497,468 499,956 Software — 0.9% Infor U.S., Inc., 3.75%, 06/03/20@ 248,714 245,787 500,000 497,240 Telecommunications — 1.8% Level 3 Financing, Inc., 3.50%, 05/31/22@ Total Term Loans (Cost $23,904,594) 23,773,772 CORPORATE BONDS — 13.4% 497,481 497,324 497,487 498,938 996,262 248,737 Retail — 18.6% BJ’s Wholesale Club, Inc., 4.50%, 09/26/19@ Burger King, 3.75%, 12/10/21@ CEC Entertainment, Inc., 4.00%, 02/15/21@ Dollar Tree, Inc., 3.50%, 03/09/22@ Doosan Infracore International, Inc., 4.50%, 05/28/21@ Jo-Ann Stores LLC, 4.00%, 03/16/18@ Leslie’s Poolmart, 4.25%, 10/16/19@ Michaels Stores, Inc., 4.00%, 01/28/20@ Neiman Marcus Group Ltd. LLC, 4.25%, 10/25/20@ NPC International, Inc., 4.00%, 12/28/18@ $500,000 249,004 497,903 379,489 498,182 379,673 497,481 485,251 208,861 209,101 248,638 250,192 240,865 234,242 248,721 249,342 249,372 250,074 498,737 496,498 498,070 Chemicals — 0.9% Tronox Finance LLC, 6.38%, 08/15/20 250,000 233,125 Commercial Services — 1.0% United Rentals North America, Inc., 7.38%, 05/15/20 250,000 267,998 Distribution/Wholesale — 1.1% HD Supply, Inc., 11.50%, 07/15/20 250,000 290,000 Diversified Financial Services — 0.9% Jefferies Finance LLC, 7.38%, 250,000 04/01/20‡ 246,875 494,646 Electric — 1.8% Dynegy, Inc., 6.75%, 11/01/19‡ GenOn Energy, Inc., 9.88%, 10/15/20 Total Electric 250,000 261,374 250,000 255,625 516,999 Entertainment — 0.5% Penn National Gaming, Inc., 5.88%, 11/01/21 124,000 125,550 Healthcare − Services — 1.0% Tenet Healthcare Corp., 8.00%, 08/01/20 250,000 260,938 Home Builders — 0.9% Lennar Corp., 4.50%, 06/15/19 250,000 256,250 See accompanying Notes to Financial Statements. 96
101) ADVISORSHARES PACIFIC ASSET ENHANCED FLOATING RATE ETF Schedule of Investments (continued) June 30, 2015 Shares/ Principal Investments Value SUMMARY OF SCHEDULE OF INVESTMENTS CORPORATE BONDS (continued) Lodging — 1.7% Caesars Entertainment Resort Properties LLC, 11.00%, 10/01/21@ MGM Resorts International, 6.75%, 10/01/20 Total Lodging $ 250,000 $ 210,625 250,000 266,250 476,875 Oil & Gas — 0.7% Linn Energy LLC, 6.50%, 05/15/19 250,000 203,125 Real Estate — 1.0% Howard Hughes Corp. (The), 6.88%, 10/01/21‡ 250,000 266,250 Software — 1.1% First Data Corp., 12.63%, 01/15/21 250,000 289,375 250,000 229,063 Telecommunications — 0.8% Sprint Communications, Inc., 6.00%, 11/15/22 Total Corporate Bonds (Cost $3,708,766) 3,662,423 MONEY MARKET FUND — 4.5% JP Morgan US Government Money Market Fund − Institutional Class, 0.01%(a) (Cost $1,216,054) Total Investments — 104.9% (Cost $28,829,414) Liabilities in Excess of Other Assets — (4.9)% Net Assets — 100.0% 1,216,054 1,216,054 28,652,249 (1,340,637) $27,311,612 ‡ Security was purchased pursuant to Rule 144A under the Securities Act of 1933 and may not be resold subject to that rule except to qualified institutional buyers. Unless otherwise noted, 144A securities are deemed to be liquid. @ Variable rate instrument. The interest rate shown reflects the rate in effect at June 30, 2015. (a) Rate shown reflects the 7-day yield as of June 30, 2015. Advertising Aerospace & Defense Airlines Auto Parts & Equipment Building Materials Chemicals Commercial Services Distribution/Wholesale Diversified Financial Services Electric Entertainment Environmental Control Food Hand/Machine Tools Healthcare − Services Home Builders Household Products/Wares Insurance Internet Leisure Time Lodging Machinery-Diversified Media Mining Miscellaneous Manufacturing Oil & Gas Packaging & Containers Pharmaceuticals Real Estate Retail Semiconductors Software Telecommunications Money Market Fund Total Investments Liabilities in Excess of Other Assets Net Assets % of Net Assets 1.8% 3.4 0.9 3.6 3.6 5.5 8.3 2.9 3.6 1.8 2.3 0.9 3.7 1.8 4.7 0.9 1.8 1.8 0.9 3.6 4.2 2.9 1.8 1.6 0.9 0.7 3.6 0.9 1.0 18.6 1.8 2.0 2.6 4.5 104.9 (4.9) 100.0% Total Return Swaps contracts outstanding as of June 30, 2015: Reference Entity iBoxx USD Liquid Leveraged Loans Number of Contracts 1,000,000 Annual Financing Rate Received (Paid) 0.15% Termination Date 9/21/2015 Notional Amounts $1,000,000 Fair Value $997,288 Unrealized Appreciation/ (Depreciation) $(2,712) J.P. Morgan Chase Bank acts as the counterparty to the total return swap contracts listed above. The Fund either receives fees from, or pays fees to, the counterparty, depending upon the total return of the benchmark, and the agreed-upon financing rate. See accompanying Notes to Financial Statements. 97
102) ADVISORSHARES PERITUS HIGH YIELD ETF Schedule of Investments June 30, 2015 Investments Principal Value Investments Principal Value CORPORATE BONDS — 67.5% CORPORATE BONDS (continued) Advertising — 2.8% Affinion Group, Inc., 7.88%, 12/15/18(a) Sitel LLC/Sitel Finance Corp., 11.00%, 08/01/17‡ Total Advertising Commercial Services (continued) Speedy Cash Intermediate Holdings Corp., 10.75%, $5,203,000 $ 4,942,850 05/15/18‡(a) StoneMor Partners LP/Cornerstone Family Services of WV, 7.88%, 06/01/21 4,938,000 5,160,209 Total Commercial Services 24,080,202 $ 8,102,000 $ 5,428,340 4,956,000 5,813,000 Auto Manufacturers — 1.2% Navistar International Corp., 8.25%, 11/01/21(a) Beverages — 1.3% Innovation Ventures LLC/Innovation Ventures Finance Corp., 9.50%, 08/15/19‡ Chemicals — 2.5% Hexion, Inc., 10.00%, 04/15/20 Tronox Finance LLC, 6.38%, 08/15/20(a) Total Chemicals Coal — 2.0% Arch Coal, Inc., 8.00%, 01/15/19‡(a) Murray Energy Corp., 11.25%, 04/15/21‡ Total Coal Commercial Services — 6.5% Constellis Holdings LLC/Constellis Finance Corp., 9.75%, 05/15/20‡ Harland Clarke Holdings Corp., 9.25%, 03/01/21‡ Quad/Graphics, Inc., 7.00%, 05/01/22 5,382,440 10,490,614 4,909,000 Auto Parts & Equipment — 3.0% Titan International, Inc., 6.88%, 10/01/20(a) UCI International, Inc., 8.63%, 02/15/19(a) Total Auto Parts & Equipment Banks — 1.4% Creditcorp, 12.00%, 07/15/18‡ 5,108,174 5,726,000 Agriculture — 2.8% Alliance One International, Inc., 9.88%, 07/15/21(a) Southern States Cooperative, Inc., 10.00%, 08/15/21‡ Total Agriculture 5,055,120 10,483,460 4,688,095 5,160,000 4,766,550 7,412,000 6,633,740 11,400,290 6,293,000 5,293,986 4,713,000 4,925,085 4,980,000 5,141,850 4,710,000 4,392,075 9,533,925 13,473,000 2,896,695 5,595,000 4,713,788 7,610,483 5,230,000 5,060,025 5,698,000 5,007,118 4,000,000 3,910,000 Computers — 1.0% DynCorp International, Inc., 10.38%, 07/01/17(a) 5,310,000 3,849,750 Cosmetics/Personal Care — 0.9% Revlon Consumer Products Corp., 5.75%, 02/15/21 3,500,000 3,447,500 Diversified Financial Services — 1.3% CNG Holdings, Inc., 9.38%, 6,697,000 05/15/20‡ 4,888,810 Electrical Components & Equipment — 1.4% Artesyn Embedded Technologies, 5,141,000 Inc., 9.75%, 10/15/20‡ 5,128,148 Electronics — 1.3% Kemet Corp., 10.50%, 05/01/18(a) 4,935,000 5,009,025 4,230,000 4,208,850 4,620,000 4,689,299 4,010,000 3,830,272 12,728,421 4,681,000 4,751,215 5,807,000 5,356,958 10,108,173 4,325,000 4,389,875 4,727,000 4,632,460 9,022,335 5,021,000 5,046,105 Entertainment — 3.5% DreamWorks Animation SKG, Inc., 6.88%, 08/15/20‡ Gibson Brands, Inc., 8.88%, 08/01/18‡ WMG Acquisition Corp., 6.75%, 04/15/22‡ Total Entertainment Food — 2.7% Bi-Lo LLC/Bi-Lo Finance Corp., 9.25%, 02/15/19‡ Simmons Foods, Inc., 7.88%, 10/01/21‡(a) Total Food Healthcare − Services — 2.4% Select Medical Corp., 6.38%, 06/01/21 Vantage Oncology LLC/Vantage Oncology Finance Co., 9.50%, 06/15/17‡ Total Healthcare − Services Leisure Time — 1.3% ICON Health & Fitness, Inc., 11.88%, 10/15/16‡(a) See accompanying Notes to Financial Statements. 98
103) ADVISORSHARES PERITUS HIGH YIELD ETF Schedule of Investments (continued) June 30, 2015 Investments Principal Value Investments Principal Value CORPORATE BONDS (continued) CORPORATE BONDS (continued) Media — 2.1% Lee Enterprises, Inc., 9.50%, 03/15/22‡ Sirius XM Radio, Inc., 6.00%, 07/15/24‡ Total Media Telecommunications (continued) Frontier Communications Corp., 7.63%, 04/15/24 $5,230,000 $ 4,641,625 Sprint Corp., 7.25%, 09/15/21 4,700,000 4,594,250 Syniverse Holdings, Inc., 9.13%, 01/15/19 5,625,000 4,978,124 Trilogy International Partners LLC/Trilogy International Finance, Inc., 10.25%, 4,981,000 4,946,755 08/15/16‡ Windstream Services LLC, 7.75%, 5,165,000 4,751,800 10/01/21(a) Total Telecommunications 33,397,767 $4,925,000 $ 5,029,656 3,000,000 Miscellaneous Manufacturing — 2.6% Koppers, Inc., 7.88%, 12/01/19 4,780,000 Techniplas LLC, 10.00%, ‡ 4,745,000 05/01/20 Total Miscellaneous Manufacturing Oil & Gas — 2.5% Calumet Specialty Products Partners LP/Calumet Finance Corp., 7.75%, 04/15/23‡(a) Talos Production LLC/Talos Production Finance, Inc., 9.75%, 02/15/18‡ Total Oil & Gas 4,580,000 5,423,000 Oil & Gas Services — 1.4% Seitel, Inc., 9.50%, 04/15/19(a) 3,037,500 8,067,156 4,839,750 4,804,313 9,644,063 4,728,850 4,745,125 9,473,975 5,737,000 5,797,000 4,920,000 Pharmaceuticals — 2.7% BioScrip, Inc., 8.88%, 02/15/21 NBTY, Inc., 9.00%, 10/01/18 Total Pharmaceuticals Retail — 3.1% Carrols Restaurant Group, Inc., 8.00%, 05/01/22‡ Ferrellgas Partners LP/Ferrellgas Partners Finance Corp., 8.63%, 06/15/20 Guitar Center, Inc., 6.50%, 04/15/19‡(a) Total Retail Semiconductors — 2.3% Advanced Micro Devices, Inc., 7.75%, 08/01/20(a) Amkor Technology, Inc., 6.38%, 10/01/22 Total Semiconductors 5,263,698 4,949,189 5,098,350 10,047,539 3,065,000 3,233,575 4,265,000 4,435,599 4,500,000 4,140,000 11,809,174 5,530,000 3,800,000 Software — 1.2% Southern Graphics, Inc., 8.38%, 10/15/20‡ 4,838,750 3,861,750 8,700,500 4,400,000 Telecommunications — 9.0% Avaya, Inc., 9.00%, 04/01/19‡(a) EarthLink Holdings Corp., 8.88%, 05/15/19(a) 4,532,000 4,558,000 4,671,950 4,595,000 4,813,263 Transportation — 1.3% Era Group, Inc., 7.75%, 12/15/22(a) Total Corporate Bonds (Cost $273,342,639) 4,955,000 4,893,063 253,563,342 TERM LOANS — 18.8% Agriculture — 1.3% North Atlantic Trading Co., Inc., 7.75%, 01/13/20@ North Atlantic Trading Co., Inc., 8.75%, 01/13/20@ Total Agriculture 4,717,508 4,685,075 173,344 172,152 4,857,227 4,353,386 4,364,269 3,000,000 2,955,000 7,319,269 Chemicals — 1.3% American Pacific Corp., 7.00%, 02/27/19@ 4,877,702 4,934,600 Electronics — 1.2% Isola USA Corp., 9.25%, 11/29/18@ 4,435,323 4,324,440 4,750,321 4,581,090 4,931,000 4,894,018 9,475,108 4,987,277 12,723 4,657,494 11,881 5,834,334 4,724,352 9,393,727 Apparel — 1.9% SK Spice Sarl, 9.50%, 09/30/18 (Luxembourg)@ SK Spice Sarl, 0.00%, 06/12/20 (Luxembourg)@(b) Total Apparel Food — 2.5% Flavors Holdings, Inc., 6.75%, 04/03/20@ Shearer’s Foods LLC, 7.75%, 06/30/22@ Total Food Forest Products & Paper — 2.5% Appvion, Inc., 5.75%, 06/28/19@ Appvion, Inc., 6.75%, 06/28/19@ NewPage Corp., 9.50%, 02/11/21@ Total Forest Products & Paper See accompanying Notes to Financial Statements. 99
104) ADVISORSHARES PERITUS HIGH YIELD ETF Schedule of Investments (continued) June 30, 2015 Investments Principal Value Investments TERM LOANS (continued) Oil & Gas — 0.0%** Connacher Oil and Gas Ltd. (Canada)* (Cost $288,191) Value COMMON STOCK — 0.0%** Healthcare − Services — 2.8% Lantheus Medical Imaging, Inc., 0.00%, 6/25/22@(b) Radnet Management, Inc., 8.00%, 03/19/21@ Total Healthcare − Services Shares/ Principal $5,000,000 $ 4,943,750 5,800,000 5,720,250 10,664,000 Oil & Gas — 1.4% Osum Production Corp., 6.50%, 07/31/20 (Canada)@ 5,937,525 5,180,491 Software — 1.2% Greenway Medical Technologies, 9.25%, 11/04/21@ 4,753,846 4,682,538 Telecommunications — 1.4% Global Tel*Link Corp, 9.00%, 11/20/20@ 5,375,000 5,160,000 4,840,542 4,701,376 Transportation — 1.3% YRC Worldwide, Inc., 8.25%, 02/12/19@ Total Term Loans (Cost $72,690,071) 70,692,776 FOREIGN BONDS — 12.8% Internet — 1.2% Mood Media Corp., 9.25%, 10/15/20 (Canada)‡ 5,385,000 4,617,638 4,835,000 4,883,350 4,520,000 4,813,800 5,962,000 Mining — 3.9% AuRico Gold, Inc., 7.75%, 04/01/20 (Canada)‡ HudBay Minerals, Inc., 9.50%, 10/01/20 (Canada) IAMGOLD Corp., 6.75%, 10/01/20 (Canada)‡ Total Mining 5,022,985 14,720,135 Miscellaneous Manufacturing — 1.1% Bombardier, Inc., 6.13%, 01/15/23 (Canada)‡(a) 4,710,000 Oil & Gas — 4.0% CHC Helicopter SA, 9.38%, 06/01/21 (Canada) Northern Blizzard Resources, Inc., 7.25%, 02/01/22 (Canada)‡(a) Teine Energy Ltd., 6.88%, 09/30/22 (Canada)‡ Total Oil & Gas Telecommunications — 1.3% VimpelCom Holdings BV, 7.50%, 03/01/22 (Netherlands)‡ Transportation — 1.3% Global Ship Lease, Inc., 10.00%, 04/01/19 (Marshall Islands)‡ Total Foreign Bonds (Cost $50,897,505) 76,855 $ 116,051 (c) 4,203,675 8,102,250 4,861,350 5,214,000 5,005,439 5,120,000 4,966,400 14,833,189 5,055,000 REPURCHASE AGREEMENTS — 13.8% Citibank NA, dated 06/30/15, due 07/01/15, 0.14%, total to be received $7,782,559, (collateralized by various U.S. Government Agency Obligations, 0.63% − 6.50%, 11/15/16 − 07/01/45, totaling $7,938,180) $ 7,782,529 7,782,529 Mizuho Securities USA, Inc., dated 06/30/15, due 07/01/15, 0.14%, total to be received $12,075,938, (collateralized by various U.S. Government Agency Obligations, 0.00% − 8.50%, 06/13/16 − 04/20/44, totaling $12,317,409) 12,075,891 12,075,891 Morgan Stanley & Co. LLC, dated 06/30/15, due 07/01/15, 0.09%, total to be received $12,075,921, (collateralized by various U.S. Government Agency Obligations, 0.75% − 9.50%, 02/16/16 − 05/01/45, totaling $12,317,409) 12,075,891 12,075,891 HSBC Securities USA, Inc., dated 06/30/15, due 07/01/15, 0.10%, total to be received $12,075,925, (collateralized by various U.S. Government Agency Obligations, 0.00% − 9.38%, 07/15/15 − 01/15/37, totaling $12,317,454) 12,075,891 12,075,891 RBC Capital Markets LLC, dated 06/30/15, due 07/01/15, 0.10%, total to be received $7,873,171, (collateralized by various U.S. Government Agency Obligations, 2.38% − 6.50%, 03/01/19 − 02/20/65, totaling $8,030,612) 7,873,149 7,873,149 Total Repurchase Agreements (Cost $51,883,351) 51,883,351 Total Investments — 112.9% (Cost $449,101,757) $ 424,425,670 Liabilities in Excess of Other Assets — (12.9)% (48,434,767) Net Assets — 100.0% $375,990,903 4,966,538 LP — Limited Partnership * 4,610,000 4,828,975 48,170,150 Non-income producing security. ** Less than 0.05% @ Variable rate instrument. The interest rate shown reflects the rate in effect at June 30, 2015. See accompanying Notes to Financial Statements. 100
105) ADVISORSHARES PERITUS HIGH YIELD ETF Schedule of Investments (continued) June 30, 2015 ‡ Security was purchased pursuant to Rule 144A under the Securities Act of 1933 and may not be resold subject to that rule except to qualified institutional buyers. Unless otherwise noted, 144A securities are deemed to be liquid. (a) All or a portion of security is on loan. The aggregate market value of the securities on loan is $57,428,728; the aggregate market value of the collateral held by the fund is $58,848,876. The aggregate market value of the collateral includes non-cash U.S. Treasury securities collateral having a value of $6,965,525. (b) This Loan will settle after June 30, 2015 at which time the interest rate will be determined. (c) Collateral received from brokers for securities lending was invested in these short-term investments. SUMMARY OF SCHEDULE OF INVESTMENTS Advertising Agriculture Apparel Auto Manufacturers Auto Parts & Equipment Banks Beverages Chemicals Coal Commercial Services Computers Cosmetics/Personal Care Diversified Financial Services Electrical Components & Equipment Electronics Entertainment Food Forest Products & Paper Healthcare − Services Internet Leisure Time Media Mining Miscellaneous Manufacturing Oil & Gas Oil & Gas Services Pharmaceuticals Retail Semiconductors Software Telecommunications Transportation Repurchase Agreements Total Investments Liabilities in Excess of Other Assets Net Assets See accompanying Notes to Financial Statements. 101 % of Net Assets 2.8% 4.1 1.9 1.2 3.0 1.4 1.3 3.8 2.0 6.5 1.0 0.9 1.3 1.4 2.5 3.5 5.2 2.5 5.2 1.2 1.3 2.1 3.9 3.7 7.9 1.4 2.7 3.1 2.3 2.4 11.7 3.9 13.8 112.9 (12.9) 100.0%
106) ADVISORSHARES PRING TURNER BUSINESS CYCLE ETF Schedule of Investments June 30, 2015 Investments Shares Value COMMON STOCKS — 53.5% 1,700 2,099 Building Materials — 2.3% Masco Corp. 3,850 Computers — 1.9% Apple, Inc. 650 $ 93,908 118,048 211,956 102,680 81,526 Electric — 1.9% Southern Co. (The) 2,000 83,800 Gas — 2.0% Atmos Energy Corp. 1,700 87,176 Home Builders — 2.3% Lennar Corp., Class A 1,989 101,519 2,199 1,352 2,275 135,942 134,767 100,077 370,786 Insurance — 8.5% American International Group, Inc. Aon PLC (United Kingdom) Validus Holdings Ltd. Total Insurance Mining — 8.0% Aluminum Corp. of China Ltd. (China)*(a)(b) Franco-Nevada Corp. (Canada) Royal Gold, Inc. Sandstorm Gold Ltd. (Canada)*(a) Total Mining Pipelines — 2.0% Kinder Morgan, Inc. 8,750 2,068 1,685 13,921 1,500 2,239 108,938 98,540 103,779 40,928 352,185 85,395 85,955 Real Estate Investment Trusts — 4.2% Equity Residential 700 Essex Property Trust, Inc. 241 WP Carey, Inc. 1,400 Total Real Estate Investment Trusts 182,848 Semiconductors — 3.1% Intel Corp. 4,441 135,073 2,123 1,600 93,730 64,480 158,210 Software — 3.6% Microsoft Corp. Oracle Corp. Total Software Shares Value COMMON STOCKS (continued) Banks — 4.8% Citigroup, Inc. Wells Fargo & Co. Total Banks Pharmaceuticals — 1.9% Merck & Co., Inc. Investments 49,119 51,213 82,516 Telecommunications — 7.0% BCE, Inc. (Canada) Cisco Systems, Inc. Verizon Communications, Inc. Total Telecommunications Total Common Stocks (Cost $2,230,822) 1,925 4,632 2,123 $ 81,813 127,194 98,953 307,960 2,347,069 EXCHANGE TRADED FUNDS — 36.5% Debt Fund — 19.6% Guggenheim BulletShares 2015 High Yield Corporate Bond ETF Guggenheim BulletShares 2016 High Yield Corporate Bond ETF(a) Guggenheim BulletShares 2017 High Yield Corporate Bond ETF(a) iShares Core U.S. Aggregate Bond ETF iShares Floating Rate Bond ETF iShares iBoxx $Investment Grade Corporate Bond ETF iShares International Preferred Stock ETF PIMCO Enhanced Short Maturity Active ETF PowerShares Senior Loan Portfolio Schwab U.S. Aggregate Bond ETF(a) Total Debt Fund Equity Fund — 16.9% Guggenheim S&P 500 Equal Weight Consumer Discretionary ETF Guggenheim S&P 500 Equal Weight Consumer Staples ETF Guggenheim S&P 500 Equal Weight Healthcare ETF Schwab U.S. Large-Cap ETF Schwab U.S. Mid-Cap ETF SPDR S&P International Dividend ETF SPDR S&P Retail ETF(a) Total Equity Fund Total Exchange Traded Funds (Cost $1,646,790) MONEY MARKET FUND — 10.6% Dreyfus Government Cash Management − Investor Shares, 0.01%(c) (Cost $466,381) See accompanying Notes to Financial Statements. 102 2,823 73,511 2,791 73,347 2,782 73,417 962 1,986 104,646 100,571 888 102,759 3,937 77,441 437 44,203 4,495 106,936 2,030 105,012 861,843 1,200 108,336 1,030 108,964 700 2,200 2,600 111,657 108,482 110,864 2,015 1,130 83,562 111,486 743,351 1,605,194 466,381 466,381
107) ADVISORSHARES PRING TURNER BUSINESS CYCLE ETF Schedule of Investments (continued) June 30, 2015 Investments Principal Value (d) REPURCHASE AGREEMENTS — 8.0% Citibank NA, dated 06/30/15, due 07/01/15, 0.14%, total to be received $52,543, (collateralized by various U.S. Government Agency Obligations, 0.63% − 6.50%, 11/15/16 − 07/01/45, totaling $53,594) $ 52,543 $ 52,543 Merrill Lynch Pierce Fenner & Smith Inc., dated 06/30/15, due 07/01/15, 0.14%, total to be received $250,001, (collateralized by various U.S. Government Agency Obligations, 2.18% − 6.00%, 06/01/25 − 06/20/61, totaling $255,000) 250,000 250,000 Royal Bank of Scotland PLC, dated 06/30/15, due 07/01/15, 0.11%, total to be received $47,749, (collateralized by various U.S. Government Agency Obligations, 1.00% − 3.63%, 09/30/15 − 02/15/44, totaling $48,704) 47,749 47,749 Total Repurchase Agreements (Cost $350,292) 350,292 Total Investments — 108.6% (Cost $4,694,285) 4,768,936 Liabilities in Excess of Other Assets — (8.6)% (376,018) Net Assets — 100.0% $ 4,392,918 SUMMARY OF SCHEDULE OF INVESTMENTS Banks Building Materials Computers Debt Fund Electric Equity Fund Gas Home Builders Insurance Mining Pharmaceuticals Pipelines Real Estate Investment Trusts Semiconductors Software Telecommunications Money Market Fund Repurchase Agreements Total Investments Liabilities in Excess of Other Assets Net Assets ETF — Exchange Traded Fund PLC — Public Limited Company * Non-income producing security. (a) All or a portion of security is on loan. The aggregate market value of the securities on loan is $340,699; the aggregate market value of the collateral held by the fund is $350,292. (b) American Depositary Receipt. (c) Rate shown reflects the 7-day yield as of June 30, 2015. (d) Collateral received from brokers for securities lending was invested in these short-term investments. See accompanying Notes to Financial Statements. 103 % of Net Assets 4.8% 2.3 1.9 19.6 1.9 16.9 2.0 2.3 8.5 8.0 1.9 2.0 4.2 3.1 3.6 7.0 10.6 8.0 108.6 (8.6) 100.0%
108) ADVISORSHARES QAM EQUITY HEDGE ETF Schedule of Investments June 30, 2015 Investments Shares Value EXCHANGE TRADED FUNDS — 91.8% Commodity Fund — 0.5% SPDR Gold Shares* Total Commodity Fund $ 36,520 36,520 3,500 347,795 6,955 348,306 4,090 451,087 9,821 448,918 7,224 Equity Fund — 65.0% Alerian MLP ETF ALPS Medical Breakthroughs ETF* EGShares India Consumer ETF Energy Select Sector SPDR Fund First Trust China AlphaDEX Fund First Trust Dow Jones Internet Index Fund* Global X MSCI Nigeria ETF Global X Social Media Index ETF Guggenheim China Small Cap ETF Guggenheim China Technology ETF Guggenheim Raymond James SB-1 Equity ETF Guggenheim S&P 500 Equal Weight Consumer Discretionary ETF Guggenheim S&P 500 Equal Weight ETF Guggenheim S&P 500 Equal Weight Financials ETF Guggenheim S&P 500 Equal Weight Healthcare ETF Guggenheim S&P 500 Equal Weight Technology ETF Guggenheim S&P Global Water Index ETF Guggenheim S&P Midcap 400 Pure Growth ETF iShares Core S&P Small-Cap ETF iShares Global Clean Energy ETF iShares Global Consumer Discretionary ETF iShares Global Healthcare ETF iShares Japan Large-Cap ETF iShares Micro-Cap ETF iShares MSCI Brazil Capped ETF Shares Value EXCHANGE TRADED FUNDS (continued) 325 Debt Fund — 26.3% AdvisorShares Sage Core Reserves ETF†(a) Guggenheim Enhanced Short Duration ETF(a) iShares Short Treasury Bond ETF(a) SPDR Barclays 1-3 Month T-Bill ETF*(a) SPDR SSgA Ultra Short Term Bond ETF Total Debt Fund Investments 289,104 1,885,210 1,490 1,552 578 1,175 394 23,184 55,143 19,802 88,313 10,214 1,095 3,002 2,315 73,584 29,119 46,393 8,047 253,641 847 33,634 6,258 229,356 212 19,139 5,594 446,402 252 11,088 827 131,915 941 84,916 848 24,244 862 243 97 114,043 28,645 1,079 152 490 827 2,132 3,969 13,876 53,273 45,758 173,822 130,064 Equity Fund (continued) iShares MSCI EAFE ETF iShares MSCI Europe Financials ETF iShares MSCI Frontier 100 ETF iShares MSCI Germany ETF iShares MSCI Hong Kong ETF iShares MSCI Hong Kong Small-Cap ETF iShares MSCI India Small-Cap ETF iShares MSCI Indonesia ETF iShares MSCI Poland Capped ETF iShares MSCI South Africa ETF iShares MSCI Taiwan ETF iShares MSCI Turkey ETF iShares MSCI United Kingdom ETF iShares MSCI United Kingdom Small-Cap ETF iShares MSCI USA Momentum Factor ETF iShares PHLX Semiconductor ETF iShares Russell 1000 Growth ETF iShares Russell 2000 Growth ETF iShares U.S. Broker-Dealers ETF iShares U.S. Healthcare Providers ETF Market Vectors ChinaAMC A-Share ETF* Market Vectors Egypt Index ETF Market Vectors Gulf States Index ETF Market Vectors Pharmaceutical ETF Market Vectors Russia ETF Market Vectors Russia Small-Cap ETF Market Vectors Unconventional Oil & Gas ETF Market Vectors Vietnam ETF PowerShares Dynamic Market Portfolio PowerShares Russell 2000 Pure Growth Portfolio PowerShares S&P SmallCap Financials Portfolio PowerShares S&P SmallCap Information Technology Portfolio Schwab International Small-Capital Equity ETF SPDR Russell/Nomura Small Cap Japan ETF SPDR S&P Emerging Asia Pacific ETF See accompanying Notes to Financial Statements. 104 682 $ 43,300 2,514 1,095 909 1,515 57,420 32,051 25,343 34,178 410 1,780 1,879 449 60 235 89 11,660 59,274 43,536 10,255 3,926 3,708 4,017 1,527 27,868 2,115 89,528 5,141 573 3,441 1,152 791 367,273 52,768 340,693 178,076 34,677 287 41,027 822 135 47,388 6,519 889 24,425 658 3,783 46,554 69,153 244 5,478 897 625 18,604 11,650 389 29,475 6,019 156,976 382 16,132 1,112 58,113 5,212 163,188 2,162 118,067 314 27,698
109) ADVISORSHARES QAM EQUITY HEDGE ETF Schedule of Investments (continued) June 30, 2015 Investments Shares Value SUMMARY OF SCHEDULE OF INVESTMENTS EXCHANGE TRADED FUNDS (continued) Equity Fund (continued) SPDR S&P Emerging Markets SmallCap ETF SPDR S&P Health Care Equipment ETF Vanguard Small-Cap ETF WisdomTree Europe SmallCap Dividend Fund Total Equity Fund Total Exchange Traded Funds (Cost $6,317,514) 1,608 $ 72,424 166 895 15,665 108,716 1,063 60,750 4,658,200 6,579,930 MONEY MARKET FUND — 8.0% JP Morgan Prime Money Market Fund − Institutional Class, 0.07%(b) (Cost $570,159) Total Investments Before Securities Sold, Not Yet Purchased (Cost $6,887,673) 570,159 Commodity Fund Currency Fund Debt Fund Equity Fund Money Market Fund Total Investments Other Assets in Excess of Liabilities Net Assets 570,159 7,150,089 Securities Sold, Not Yet Purchased — (7.9)% EXCHANGE TRADED FUNDS — (7.9)% Currency Fund — (5.4)% CurrencyShares British Pound Sterling Trust* CurrencyShares Euro Trust* CurrencyShares Japanese Yen Trust* Total Currency Fund (612) (1,160) (2,058) (163,302) (384,561) (595) (856) (796) Equity Fund — (2.5)% iShares Russell 1000 Value ETF iShares Russell 2000 Value ETF SPDR EURO STOXX 50 ETF Total Equity Fund Total Securities Sold, Not Yet Purchased [Proceeds Received $(596,607)] Total Investments — 91.9% (Cost $6,291,066) Other Assets in Excess of Liabilities — 8.1% Net Assets — 100.0% (94,285) (126,974) (61,374) (87,278) (29,794) (178,446) (563,007) 6,587,082 583,560 $ 7,170,642 ETF — Exchange Traded Fund * Non-income producing security. † Affiliated Company. (a) All or a portion of this security has been segregated as collateral for open short positions. The aggregate market value of the collateral posted was $2,187,725, which includes cash in the amount of $596,891 as of June 30, 2015. (b) Rate shown reflects the 7-day yield as of June 30, 2015. See accompanying Notes to Financial Statements. 105 % of Net Assets 0.5% (5.4) 26.3 62.5 8.0 91.9 8.1 100.0%
110) ADVISORSHARES RANGER EQUITY BEAR ETF Schedule of Investments June 30, 2015 Investments Shares Value Investments EXCHANGE TRADED FUND — 23.3% Healthcare − Products — (0.9)% Zeltiq Aesthetics, Inc.* Value COMMON STOCKS (continued) Debt Fund — 23.3% AdvisorShares Sage Core Reserves ETF† (Cost $29,997,150) Shares 300,000 $ 29,811,000 MONEY MARKET FUNDS — 9.8% Fidelity Institutional Money Market Government 10,074,072 Portfolio − Class III, 0.01%(a) Morgan Stanley Institutional Liquidity Funds − Government 2,500,000 Portfolio, 0.04%(a) Total Money Market Funds (Cost $12,574,072) Total Investments Before Securities Sold, Not Yet Purchased (Cost $42,571,222) 10,074,072 2,500,000 12,574,072 42,385,072 Internet — (14.3)% Cogent Communications Holdings, Inc. F5 Networks, Inc.* Google, Inc., Class C* Priceline Group, Inc. (The)* TripAdvisor, Inc.* Zillow Group, Inc., Class A* Total Internet Leisure Time — (4.8)% Harley-Davidson, Inc. (181,000) (4,269,790) (98,500) (22,400) (5,925) (1,960) (35,400) (43,400) (3,333,240) (2,695,840) (3,084,022) (2,256,685) (3,084,756) (3,764,515) (18,219,058) COMMON STOCKS — (98.1)% Banks — (5.1)% Deutsche Bank AG (Germany) TCF Financial Corp. Total Banks (110,000) (6,198,500) Machinery − Diversified — (2.5)% Flowserve Corp. (62,000) Securities Sold, Not Yet Purchased — (98.1)% (3,264,920) (102,000) (210,000) Computers — (11.6)% Diebold, Inc. Electronics For Imaging, Inc.* Seagate Technology PLC (Ireland) Super Micro Computer, Inc.* Total Computers Distribution/Wholesale — (5.9)% Fastenal Co. Genuine Parts Co. Total Distribution/Wholesale (3,076,320) (3,488,100) (6,564,420) Metal Fabricate/Hardware — (4.5)% Precision Castparts Corp. (15,250) Rexnord Corp.* (111,000) Total Metal Fabricate/Hardware (3,048,018) (2,654,010) (5,702,028) (26,500) Commercial Services — (1.5)% Huron Consulting Group, Inc.* (1,857,385) Oil & Gas — (1.0)% Range Resources Corp. (26,500) (1,308,570) (92,800) (20,000) (4,750) (109,000) (59,000) (69,200) (4,638,143) (1,324,200) (2,873,703) (3,637,330) (2,332,270) (1,813,732) (16,619,378) (18,000) (91,000) (1,874,340) (2,368,730) (115,500) (53,500) (47,500) (4,417,875) (2,537,238) (894,900) (12,093,083) (26,400) (151,000) (2,422,200) (3,187,610) (5,609,810) (154,400) (47,000) (83,100) (119,000) (5,404,000) (2,044,970) (3,947,250) (3,520,020) (14,916,240) (93,000) (40,000) (3,922,740) (3,581,200) (7,503,940) Diversified Financial Services — (3.3)% LendingClub Corp.* (290,000) (4,277,500) Electrical Components & Equipment — (3.0)% AMETEK, Inc. (71,000) (3,889,380) Electronics — (2.3)% National Instruments Corp. Home Builders — (3.3)% Winnebago Industries, Inc. (40,000) $ (1,178,800) (99,500) (2,931,270) Energy − Alternate Sources — (1.3)% SolarCity Corp.* (31,600) (1,692,180) Retail — (13.1)% Cabela’s, Inc.* CarMax, Inc.* Chipotle Mexican Grill, Inc.* DSW, Inc., Class A Five Below, Inc.* Rush Enterprises, Inc., Class A* Total Retail Semiconductors — (9.4)% ASML Holding NV (Netherlands)(b) Cree, Inc.* M/A-COM Technology Solutions Holdings, Inc.* Microchip Technology, Inc. Micron Technology, Inc.* Total Semiconductors Software — (4.4)% NetSuite, Inc.* PROS Holdings, Inc.* Total Software See accompanying Notes to Financial Statements. 106
111) ADVISORSHARES RANGER EQUITY BEAR ETF Schedule of Investments (continued) June 30, 2015 Investments Shares Value SUMMARY OF SCHEDULE OF INVESTMENTS COMMON STOCKS (continued) Telecommunications — (5.9)% CenturyLink, Inc. NETGEAR, Inc.* Total Telecommunications Total Securities Sold, Not Yet Purchased [Proceeds Received $(129,792,969)] Total Investments − (65.0)% [Cost $(87,221,747)] Other Assets in Excess of Liabilities — 165.0% Net Assets — 100.0% (153,000) $ (4,495,140) (103,000) (3,092,060) (7,587,200) (125,683,452) (83,298,380) 211,357,104 $ 128,058,724 ETF — Exchange Traded Fund PLC — Public Limited Company † Affiliated Company. * Non-income producing security. (a) Rate shown reflects the 7-day yield as of June 30, 2015. (b) Registered Shares. Cash of $126,869,695 has been segregated to cover margin requirement for open short sales as of June 30, 2015. Banks Commercial Services Computers Debt Fund Distribution/Wholesale Diversified Financial Services Electrical Components & Equipment Electronics Energy − Alternate Sources Healthcare − Products Home Builders Internet Leisure Time Machinery − Diversified Metal Fabricate/Hardware Oil & Gas Retail Semiconductors Software Telecommunications Money Market Fund Total Investments Other Assets in Excess of Liabilities Net Assets See accompanying Notes to Financial Statements. 107 % of Net Assets (5.1)% (1.5) (11.6) 23.3 (5.9) (3.3) (3.0) (2.3) (1.3) (0.9) (3.3) (14.3) (4.8) (2.5) (4.5) (1.0) (13.1) (9.4) (4.4) (5.9) 9.8 (65.0) 165.0 100.0%
112) ADVISORSHARES SAGE CORE RESERVES ETF Schedule of Investments June 30, 2015 Investments Principal Value Investments CORPORATE BONDS — 44.9% Electric (continued) PSEG Power LLC, 5.50%, 12/01/15 Southern Co. (The), Series A, 2.38%, 09/15/15 Total Electric Value CORPORATE BONDS (continued) Agriculture — 1.1% Altria Group, Inc., 4.13%, 09/11/15 Principal $ 365,000 $ Auto Manufacturers — 1.2% Ford Motor Credit Co. LLC, 2.50%, 01/15/16 400,000 Banks — 11.3% Bank of America Corp., 1.10%, 03/22/16@ Bank of America Corp., 5.75%, 08/15/16 Bank of New York Mellon Corp. (The), 0.70%, 10/23/15 Capital One Financial Corp., 1.00%, 11/06/15 Citigroup, Inc., 1.07%, 04/01/16@ First Horizon National Corp., 5.38%, 12/15/15 Goldman Sachs Group, Inc. (The), 4.00%, 03/03/24 JPMorgan Chase & Co., 2.60%, 01/15/16 JPMorgan Chase & Co., Series G, 0.90%, 02/26/16@ JPMorgan Chase & Co., 3.45%, 03/01/16 Morgan Stanley, 5.38%, 10/15/15 Santander Holdings USA, Inc., 3.00%, 09/24/15 Total Banks 367,075 403,285 410,000 410,982 265,000 277,570 240,000 240,119 610,000 609,129 375,000 375,818 325,000 330,019 370,000 376,867 275,000 277,204 185,000 185,282 150,000 152,556 340,000 344,465 390,000 391,090 3,971,101 Beverages — 1.0% Dr Pepper Snapple Group, Inc., 2.90%, 01/15/16 360,000 364,046 Chemicals — 1.0% Dow Chemical Co. (The), 2.50%, 02/15/16 340,000 343,331 Computers — 1.1% Hewlett-Packard Co., 2.13%, 09/13/15 365,000 Diversified Financial Services — 1.7% American Express Credit Corp., 2.75%, 09/15/15 55,000 American Express Credit Corp., 525,000 0.79%, 07/29/16@ Total Diversified Financial Services Electric — 3.7% Georgia Power Co., 0.61%, 03/15/16@ Progress Energy, Inc., 5.63%, 01/15/16 366,225 55,214 525,917 581,131 291,000 290,765 346,000 354,756 Food — 3.4% ConAgra Foods, Inc., 1.35%, 09/10/15 Kroger Co. (The), 2.20%, 01/15/17 Kroger Co. (The), 6.40%, 08/15/17 Mondelez International, Inc., 4.13%, 02/09/16 Total Food $350,000 Internet — 1.1% Amazon.com, Inc., 0.65%, 11/27/15 Machinery − Diversified — 0.1% John Deere Capital Corp., 0.75%, 01/22/16 Media — 2.2% DIRECTV Holdings LLC/DIRECTV Financing Co., Inc., 3.13%, 02/15/16 Time Warner, Inc., 3.15%, 07/15/15 Total Media Pharmaceuticals — 2.1% AbbVie, Inc., 1.20%, 11/06/15 Express Scripts Holding Co., 3.13%, 05/15/16 Total Pharmaceuticals Pipelines — 2.0% Enterprise Products Operating LLC, 3.20%, 02/01/16 Kinder Morgan Energy Partners LP, 3.50%, 03/01/16 Total Pipelines See accompanying Notes to Financial Statements. 108 356,646 310,000 311,111 1,313,278 370,000 370,188 40,000 40,573 275,000 302,925 485,000 494,286 1,207,972 Household Products/Wares — 1.1% Clorox Co. (The), 3.55%, 11/01/15 365,000 Insurance — 4.6% Aflac, Inc., 3.45%, 08/15/15 American International Group, Inc., 5.05%, 10/01/15 Genworth Holdings, Inc., 4.80%, 02/15/24 Prudential Financial, Inc., 4.75%, 09/17/15 Total Insurance $ 368,532 270,000 270,764 360,000 363,658 360,000 315,000 680,000 685,295 1,634,717 390,000 390,051 25,000 25,061 340,000 344,081 415,000 415,435 759,516 370,000 370,369 340,000 345,659 716,028 340,000 344,192 340,000 344,955 689,147
113) ADVISORSHARES SAGE CORE RESERVES ETF Schedule of Investments (continued) June 30, 2015 Investments Principal Value Investments Principal CORPORATE BONDS (continued) ASSET BACKED SECURITIES (continued) Real Estate — 1.0% ERP Operating LP, 5.13%, 03/15/16 Diversified Financial Services (continued) Citibank Credit Card Issuance Trust, Class A2, Series 2013-A2, $600,000 0.47%, 05/26/20@ Discover Card Execution Note Trust, Class A2, Series 2013-A2, 0.69%, 08/15/18 350,000 Fifth Third Auto Trust, Class A3, Series 2013-A, 0.61%, 09/15/17 126,496 First National Master Note Trust, Class A, Series 2013-2, 0.72%, 325,000 10/15/19@ GE Equipment Midticket LLC, Class A3, Series 2012-1, 0.60%, 05/23/16 2,287 Honda Auto Receivables Owner Trust, Class A3, Series 2014-2, 0.77%, 03/19/18 335,000 Huntington Auto Trust, Class A3, Series 2012-2, 0.51%, 04/17/17 94,179 Hyundai Auto Receivables Trust, Class A2, Series 2014-B, 0.44%, 02/15/17 146,377 Nissan Auto Receivables Owner Trust, Class A3, Series 2012-B, 0.46%, 10/17/16 40,841 Nissan Auto Receivables Owner Trust, Class A3, Series 2013-C, 0.67%, 08/15/18 327,074 Toyota Auto Receivables Owner Trust, Class A3, Series 2013-B, 0.89%, 07/17/17 337,168 World Omni Auto Receivables Trust, Class A3, Series 2012-A, 0.64%, 02/15/17 29,744 World Omni Automobile Lease Securitization Trust, Class A2B, Series 2013-A, 0.51%, 67,946 05/16/16@ Total Asset Backed Securities (Cost $5,165,217) Value $335,000 Retail — 2.0% AutoZone, Inc., 5.50%, 11/15/15 CVS Health Corp., 1.20%, 12/05/16 Kohl’s Corp., 4.00%, 11/01/21(a) Total Retail Telecommunications — 2.2% AT&T, Inc., 2.50%, 08/15/15 Verizon Communications, Inc., 2.50%, 09/15/16 Total Telecommunications Transportation — 1.0% Ryder System, Inc., 3.60%, 03/01/16 Total Corporate Bonds (Cost $15,704,161) $ 344,646 363,000 369,288 225,000 83,000 225,394 87,472 682,154 419,000 419,799 325,000 330,371 750,170 355,000 361,018 15,638,484 ASSET BACKED SECURITIES — 14.8% Diversified Financial Services — 14.8% Ally Auto Receivables Trust, Class A3, Series 2012-5, 0.62%, 03/15/17 72,464 Ally Master Owner Trust, Class A2, Series 2013-1, 1.00%, 02/15/18 240,000 American Express Credit Account Master Trust, Class A, Series 2013-2, 0.60%, 300,000 05/17/21@ AmeriCredit Automobile Receivables Trust, Class A2B, Series 2013-5, 0.56%, 12,531 03/08/17@ AmeriCredit Automobile Receivables Trust, Class B, Series 2013-2, 1.19%, 05/08/18 180,000 BA Credit Card Trust, Class A11, Series 2007-A11, 0.26%, 295,000 12/15/19@ Capital One Multi-Asset Execution Trust, Class A5, Series 2007-A5, 0.23%, 525,000 07/15/20@ CarMax Auto Owner Trust, Class A2, Series 2013-4, 0.52%, 11/15/16 14,491 CarMax Auto Owner Trust, Class A3, Series 2012-3, 0.52%, 07/17/17 107,583 Chase Issuance Trust, Class A5, Series 2012-A5, 0.59%, 08/15/17 640,000 72,480 240,341 300,829 12,530 180,191 $ 600,587 350,143 126,521 325,611 2,287 334,545 94,180 146,406 40,840 326,793 337,801 29,745 67,949 5,167,796 MORTGAGE BACKED SECURITIES — 13.6% 294,122 521,820 14,490 107,567 Commercial Mortgage Backed Securities — 13.6% Banc of America Merrill Lynch Commercial Mortgage, Inc., Class A4, Series 2005-5, 5.12%, 211,457 211,619 10/10/45@ Banc of America Merrill Lynch Commercial Mortgage, Inc., Class A4, Series 2005-6, 5.16%, 337,798 339,586 09/10/47@ Bear Stearns Commercial Mortgage Securities Trust, Class A4, Series 2006-T24, 5.54%, 10/12/41 307,427 319,644 640,018 See accompanying Notes to Financial Statements. 109
114) ADVISORSHARES SAGE CORE RESERVES ETF Schedule of Investments (continued) June 30, 2015 Investments Principal Value Investments Shares/ Principal Value MORTGAGE BACKED SECURITIES (continued) FOREIGN BONDS (continued) Commercial Mortgage Backed Securities (continued) Bear Stearns Commercial Mortgage Securities Trust, Class A4A, Series 2005-T20, $187,685 $ 188,072 5.26%, 10/12/42@ CD Commercial Mortgage Trust, Class A4, Series 2005-CD1, 202,540 202,722 5.38%, 07/15/44@ Credit Suisse First Boston Mortgage Securities Corp., Class AJ, Series 2005-C6, 255,000 257,110 5.23%, 12/15/40@ DBRR Trust, Class A, Series 2013-EZ3, 1.64%, 12/18/49@‡ 306,965 308,404 Fannie Mae Connecticut Avenue Securities, Class 1M1, Series 2014-C03, 1.39%, 287,928 287,784 07/25/24@ GS Mortgage Securities Trust, Class AM, Series 2006-GG6, 350,000 355,975 5.55%, 04/10/38@ GS Mortgage Securities Trust, Class A2, Series 2011-GC3, 347,400 350,358 3.65%, 03/10/44‡ Merrill Lynch Mortgage Trust, Class AM, Series 2005-CKI1, 5.46%, 11/12/37@ 500,000 501,452 Merrill Lynch Mortgage Trust, Class A4, Series 2006-C1, 415,000 423,964 5.87%, 05/12/39@ Morgan Stanley Capital I Trust, Class A4, Series 2006-T21, 5.16%, 10/12/52@ 339,080 340,694 Wachovia Bank Commercial Mortgage Trust, Class AMFX, Series 2005-C20, 5.18%, 10,158 10,162 07/15/42@ Wachovia Bank Commercial Mortgage Trust, Class A4, Series 2005-C21, 5.43%, 130,683 130,828 10/15/44@ Wachovia Bank Commercial Mortgage Trust, Class A4FL, Series 2006-C28, 0.34%, 260,807 258,369 10/15/48@‡ WFRBS Commercial Mortgage Trust, Class A2, Series 2011-C4, 219,530 223,188 3.45%, 06/15/44‡ Total Mortgage Backed Securities (Cost $4,725,786) 4,709,931 Beverages — 1.3% Anheuser-Busch InBev Finance, Inc., 0.47%, 01/27/17 (Belgium)@ $450,000 $ 449,321 Chemicals — 1.2% Potash Corp. of Saskatchewan, Inc., 3.75%, 09/30/15 (Canada) 430,000 432,648 FOREIGN BONDS — 9.0% Banks — 1.6% Lloyds Bank PLC, 4.88%, 01/21/16 (United Kingdom) Royal Bank of Canada, Series G, 0.74%, 09/09/16 (Canada)@ Total Banks 205,000 209,527 350,000 351,244 560,771 Diversified Financial Services — 0.6% Nomura Holdings, Inc., 4.13%, 01/19/16 (Japan) 60,000 Nomura Holdings, Inc., 1.74%, 140,000 09/13/16 (Japan)@ Total Diversified Financial Services Mining — 1.0% Barrick Gold Corp., 2.90%, 05/30/16 (Canada)(a) Oil & Gas — 2.2% BP Capital Markets PLC, 0.70%, 11/06/15 (United Kingdom) Petroleos Mexicanos, 3.50%, 01/30/23 (Mexico) Total Oil & Gas Telecommunications — 1.1% Vodafone Group PLC, 1.63%, 03/20/17 (United Kingdom) Total Foreign Bonds (Cost $3,127,901) MUNICIPAL BONDS — 2.2% Clear Creek Independent School District, 3.00%, 02/15/16 County of Miami-Dade FL Aviation Revenue, Series A, 5.00%, 10/01/38 Gwinnett County Water & Sewerage Authority, 4.00%, 08/01/16 La Joya Independent School District, 5.00%, 02/15/31 Michigan Finance Authority, Series G-8A, 5.00%, 04/01/16 New Hampshire Housing Finance Authority, Series D, 4.70%, 01/01/16 RNR School Financing Authority, 4.00%, 09/01/15 Village of Hobart WI, 3.38%, 03/01/16 Williamson-Travis Counties Water Control & Improvement District 1G, 2.00%, 09/01/15 Total Municipal Bonds (Cost $765,892) See accompanying Notes to Financial Statements. 110 61,001 141,070 202,071 355,000 358,540 375,000 375,329 385,000 366,212 741,541 370,000 368,669 3,113,561 125,000 126,611 55,000 55,608 50,000 50,148 90,000 92,614 110,000 112,641 60,000 61,021 160,000 160,919 55,000 56,043 50,000 50,137 765,742
115) ADVISORSHARES SAGE CORE RESERVES ETF Schedule of Investments (continued) June 30, 2015 Shares/ Principal Investments U.S. TREASURY NOTE — 5.3% U.S. Treasury Note, 0.25%, 09/15/15 (Cost $1,860,042) Value 1,860,000 $ 1,860,727 U.S. TREASURY BILL — 0.3% U.S. Treasury Bill, 0.02%, 09/10/15(b) (Cost $99,974) 100,000 MONEY MARKET FUND — 10.5% JP Morgan US Government Money Market Fund − Institutional Class, 0.01%(c) (Cost $3,653,086) 100,004 3,653,086 3,653,086 REPURCHASE AGREEMENTS — 0.8%(d) Citibank NA, dated 06/30/15, due 07/01/15, 0.14%, total to be received $39,881, (collateralized by various U.S. Government Agency Obligations, 0.63% − 6.50%, 11/15/16 − 07/01/45, totaling $40,678) $ 39,881 39,881 Merrill Lynch Pierce Fenner & Smith Inc., dated 06/30/15, due 07/01/15, 0.14%, total to be received $225,995, (collateralized by various U.S. Government Agency Obligations, 2.18% − 6.00%, 06/01/25 − 06/20/61, totaling $230,514) 225,994 225,994 Total Repurchase Agreements (Cost $265,875) 265,875 Total Investments — 101.4% (Cost $35,367,934) 35,275,206 Liabilities in Excess of Other Assets — (1.4)% (492,465) Net Assets — 100.0% $34,782,741 SUMMARY OF SCHEDULE OF INVESTMENTS Agriculture Auto Manufacturers Banks Beverages Chemicals Commercial Mortgage Backed Securities Computers Diversified Financial Services Electric Food Household Products/Wares Insurance Internet Machinery − Diversified Media Mining Municipal Bonds Oil & Gas Pharmaceuticals Pipelines Real Estate Retail Telecommunications Transportation U.S. Treasury Bill U.S. Treasury Note Money Market Fund Repurchase Agreements Total Investments Liabilities in Excess of Other Assets Net Assets LP — Limited Partnership PLC — Public Limited Company @ Variable rate instrument. The interest rate shown reflects the rate in effect at June 30, 2015. ‡ Security was purchased pursuant to Rule 144A under the Securities Act of 1933 and may not be resold subject to that rule except to qualified institutional buyers. Unless otherwise noted, 144A securities are deemed to be liquid. (a) All or a portion of security is on loan. The aggregate market value of the securities on loan is $258,996; the aggregate market value of the collateral held by the fund is $265,875. (b) Interest rate shown reflects the discount rate at time of purchase. (c) Rate shown reflects the 7-day yield as of June 30, 2015. (d) Collateral received from brokers for securities lending was invested in these short-term investments. See accompanying Notes to Financial Statements. 111 % of Net Assets 1.1% 1.2 12.9 2.3 2.2 13.6 1.1 17.1 3.7 3.4 1.1 4.6 1.1 0.1 2.2 1.0 2.2 2.2 2.1 2.0 1.0 2.0 3.3 1.0 0.3 5.3 10.5 0.8 101.4 (1.4) 100.0%
116) ADVISORSHARES SAGE CORE RESERVES ETF Schedule of Investments (continued) June 30, 2015 Futures contracts outstanding as of June 30, 2015: Type 2-Year U.S. Treasury Note 5-Year U.S. Treasury Note 10-Year U.S. Treasury Note Broker Jefferies & Company Inc. Jefferies & Company Inc. Jefferies & Company Inc. Expiration Date Number of Contracts Value at Trade Date Value at June 30, 2015 Unrealized Appreciation/ (Depreciation) September 2015 (4) $ (874,700) $ (875,750) $(1,050) September 2015 10 1,193,954 1,192,578 (1,376) September 2015 (7) (885,849) (883,203) $ Cash posted as collateral to broker for futures contracts was $101,042 at June 30, 2015. See accompanying Notes to Financial Statements. 112 2,646 220
117) ADVISORSHARES STAR GLOBAL BUY-WRITE ETF Schedule of Investments June 30, 2015 Investments Shares Value EXCHANGE TRADED FUNDS — 90.1% Debt Fund — 18.3% AdvisorShares Sage Core Reserves ETF† iShares 1 − 3 Year Credit Bond ETF iShares 20+ Year Treasury Bond ETF iShares iBoxx $ High Yield Corporate Bond ETF iShares JPMorgan USD Emerging Markets Bond ETF SPDR Barclays High Yield Bond ETF SPDR Barclays International Corporate Bond ETF Total Debt Fund 2,500 9,301 $ 248,425 979,674 2,728 10,001 888,089 12,308 1,352,895 12,000 461,160 20,000 Equity Fund — 71.8% Consumer Discretionary Select Sector SPDR Fund Consumer Staples Select Sector SPDR Fund Energy Select Sector SPDR Fund Financial Select Sector SPDR Fund Health Care Select Sector SPDR Fund Industrial Select Sector SPDR Fund iShares MSCI EAFE ETF iShares MSCI Emerging Markets ETF Materials Select Sector SPDR Fund SPDR S&P 500 ETF Trust Technology Select Sector SPDR Fund Utilities Select Sector SPDR Fund Total Equity Fund Total Exchange Traded Funds (Cost $22,491,816) 320,431 629,200 4,879,874 6,089 465,687 16,474 7,875 784,162 591,885 57,360 1,398,437 12,414 923,477 7,251 26,821 391,989 1,702,865 30,967 1,226,913 3,699 51,580 178,995 10,617,744 13,410 5,357 555,174 222,101 19,059,429 23,939,303 Investments Principal/ Contracts U.S. TREASURY NOTE — 3.9% U.S. Treasury Note, 4.50%, 02/15/16(b) (Cost $1,026,744) Total Investments Before Written Options — 99.4% (Cost $24,840,160) $1,000,000 $ 1,026,993 WRITTEN PUT OPTION — (0.0)%** iShares 20+ Year Treasury Bond ETF, expiring 07/17/15, Strike Price $116.00 [Premium Received $(4,711)] WRITTEN CALL OPTIONS — (0.1)% Consumer Discretionary Select Sector SPDR Fund, expiring 07/17/15, Strike Price $79.00 Industrial Select Sector SPDR Fund, expiring 07/17/15, Strike Price $57.00 iShares 20+ Year Treasury Bond ETF, expiring 07/17/15, Strike Price $120.00 iShares MSCI EAFE ETF, expiring 07/17/15, Strike Price $67.00 iShares MSCI Emerging Markets ETF, expiring 07/17/15, Strike Price $41.00 SPDR S&P 500 ETF Trust, expiring 07/17/15, Strike Price $215.00 Utilities Select Sector SPDR Fund, expiring 07/17/15, Strike Price $44.00 Total Written Call Options [Premiums Received $(64,720)] Total Written Options — (0.1)% [Premiums Received $(69,431)] Total Investments — 99.3% (Cost $24,770,729) Other Assets in Excess of Liabilities — 0.7% Net Assets — 100.0% Value 26,417,593 (31) (4,201) (30) (450) (36) (252) (27) (2,322) (79) (869) (153) (2,907) (232) (2,436) (4) (12) (9,248) (13,449) 26,404,144 192,577 $26,596,721 ETF — Exchange Traded Fund COMMON STOCKS — 1.5% † Affiliated Company. Apparel — 0.8% Hanesbrands, Inc. ** Less than 0.05%. (a) Rate shown reflects the 7-day yield as of June 30, 2015. (b) All or portion of this security has been pledged as collateral for option contracts. The aggregate market value of the collateral was $1,717,381, which includes cash in the amount of $691,494 as of June 30, 2015. 6,572 Computers — 0.7% Apple, Inc. Total Common Stocks (Cost $275,538) 1,485 218,979 186,256 405,235 MONEY MARKET FUND — 3.9% BlackRock Liquidity Funds-T-Fund Portfolio − Institutional Class, 0.01%(a) (Cost $1,046,062) 1,046,062 1,046,062 See accompanying Notes to Financial Statements. 113
118) ADVISORSHARES STAR GLOBAL BUY-WRITE ETF Schedule of Investments (continued) June 30, 2015 SUMMARY OF SCHEDULE OF INVESTMENTS Apparel Computers Debt Fund Equity Fund U.S. Treasury Note Written Call Options Written Put Option Money Market Fund Total Investments Other Assets in Excess of Liabilities Net Assets ** % of Net Assets 0.8% 0.7 18.3 71.8 3.9 (0.1) (0.0)** 3.9 99.3 0.7 100.0% Less than 0.05%. See accompanying Notes to Financial Statements. 114
119) ADVISORSHARES SUNRISE GLOBAL MULTI-STRATEGY ETF Schedule of Investments June 30, 2015 Investments Shares Value SUMMARY OF SCHEDULE OF INVESTMENTS EXCHANGE TRADED FUNDS — 79.4% Debt Fund — 1.0% iShares 7 − 10 Year Treasury Bond ETF 172 Equity Fund — 78.4% Consumer Discretionary Select Sector SPDR Fund Consumer Staples Select Sector SPDR Fund Financial Select Sector SPDR Fund Health Care Select Sector SPDR Fund Industrial Select Sector SPDR Fund Materials Select Sector SPDR Fund Technology Select Sector SPDR Fund Total Equity Fund Total Exchange Traded Funds (Cost $1,360,971) $ 18,062 3,516 268,904 7,465 355,333 14,359 350,072 3,597 267,581 836 45,194 364 17,614 2,434 Debt Fund Equity Fund Money Market Fund Total Investments Other Assets in Excess of Liabilities Net Assets 100,768 1,405,466 1,423,528 MONEY MARKET FUND — 6.4% Goldman Sachs Financial Square Funds − Treasury Instruments Fund, 0.00%(a) (Cost $115,261) Total Investments — 85.8% (Cost $1,476,232) Other Assets in Excess of Liabilities — 14.2% Net Assets — 100.0% 115,261 115,261 1,538,789 255,023 $ 1,793,812 ETF — Exchange Traded Fund (a) Rate shown reflects the 7-day yield as of June 30, 2015. See accompanying Notes to Financial Statements. 115 % of Net Assets 1.0% 78.4 6.4 85.8 14.2 100.0%
120) ADVISORSHARES TRIMTABS FLOAT SHRINK ETF Schedule of Investments June 30, 2015 Investments Shares Value COMMON STOCKS — 99.9% Investments Shares Value COMMON STOCKS (continued) Advertising — 1.0% Omnicom Group, Inc. 34,358 Aerospace/Defense — 2.9% Boeing Co. (The) Northrop Grumman Corp. United Technologies Corp. Total Aerospace/Defense 16,741 15,427 21,130 Agriculture — 2.9% Altria Group, Inc. Archer-Daniels-Midland Co. Bunge Ltd. (Bermuda) Total Agriculture 48,438 48,522 27,443 Apparel — 2.0% NIKE, Inc., Class B VF Corp. Total Apparel 23,775 33,591 Beverages — 1.0% Coca-Cola Enterprises, Inc. $ 2,387,537 2,322,312 2,447,184 2,343,951 7,113,447 2,369,103 2,339,731 2,409,495 7,118,329 2,568,176 2,342,636 4,910,812 54,081 2,349,279 Biotechnology — 2.1% Celgene Corp.* Gilead Sciences, Inc. Total Biotechnology 22,130 20,978 2,561,216 2,456,104 5,017,320 Chemicals — 2.9% LyondellBasell Industries NV, Class A Monsanto Co. Westlake Chemical Corp. Total Chemicals 23,419 21,556 34,726 2,424,335 2,297,654 2,381,856 7,103,845 Commercial Services — 6.1% Cintas Corp. Equifax, Inc. Gartner, Inc.* Global Payments, Inc. Moody’s Corp. Western Union Co. (The) Total Commercial Services 29,173 25,540 28,458 23,566 22,806 117,414 18,941 37,196 90,962 73,612 Computers — 3.9% Apple, Inc. Computer Sciences Corp. EMC Corp. NetApp, Inc. Total Computers Distribution/Wholesale — 1.0% W.W. Grainger, Inc. 2,467,744 2,479,678 2,441,127 2,437,903 2,462,136 2,387,027 14,675,615 2,375,675 2,441,545 2,400,487 2,323,195 9,540,902 9,824 2,324,850 Diversified Financial Services — 5.0% Affiliated Managers Group, Inc.* 11,110 Alliance Data Systems Corp.* 8,201 American Express Co. 31,318 Franklin Resources, Inc. 46,776 Synchrony Financial* 76,430 Total Diversified Financial Services Electrical Components & Equipment — 2.0% AMETEK, Inc. 45,933 Emerson Electric Co. 41,496 Total Electrical Components & Equipment Electronics — 4.0% Amphenol Corp., Class A Corning, Inc. Mettler-Toledo International, Inc.* Waters Corp.* Total Electronics $ 2,428,646 2,394,200 2,434,035 2,293,427 2,516,840 12,067,148 2,516,210 2,300,123 4,816,333 43,678 115,461 2,532,013 2,278,046 7,319 18,513 2,499,146 2,376,699 9,685,904 52,312 26,654 60,966 2,492,667 2,367,675 2,404,499 7,264,841 23,656 2,489,557 Healthcare − Products — 4.1% DENTSPLY International, Inc. QIAGEN NV (Netherlands)* Sirona Dental Systems, Inc.* St. Jude Medical, Inc. Total Healthcare − Products 47,849 102,398 24,804 33,462 2,466,616 2,538,446 2,490,818 2,445,068 9,940,948 Healthcare − Services — 2.2% HCA Holdings, Inc.* MEDNAX, Inc.* Total Healthcare − Services 29,895 34,059 2,712,075 2,524,112 5,236,187 38,696 2,406,891 37,420 13,530 2,505,644 2,462,595 25,880 42,584 48,288 2,455,236 2,479,240 2,507,597 14,817,203 Food — 3.0% Campbell Soup Co. Hershey Co. (The) Whole Foods Market, Inc. Total Food Hand/Machine Tools — 1.0% Stanley Black & Decker, Inc. Insurance — 6.1% Aflac, Inc. Arch Capital Group Ltd. (Bermuda)* Everest Re Group Ltd. (Bermuda) Reinsurance Group of America, Inc. Torchmark Corp. W.R. Berkley Corp. Total Insurance See accompanying Notes to Financial Statements. 116
121) ADVISORSHARES TRIMTABS FLOAT SHRINK ETF Schedule of Investments (continued) June 30, 2015 Investments Shares Value COMMON STOCKS (continued) Internet — 2.1% IAC/InterActiveCorp. VeriSign, Inc.*(a) Total Internet Shares Value COMMON STOCKS (continued) 32,762 39,334 $ 2,609,821 2,427,694 5,037,515 Iron/Steel — 0.9% Reliance Steel & Aluminum Co. 37,739 2,282,455 Lodging — 1.0% Marriott International, Inc., Class A 32,618 2,426,453 Machinery − Diversified — 1.0% Rockwell Automation, Inc. 20,082 2,503,020 43,062 665,500 63,854 2,389,941 2,482,315 2,430,922 77,022 37,350 2,506,681 2,414,304 12,224,163 Media — 5.0% CBS Corp., Class B Sirius XM Holdings, Inc.*(a) Thomson Reuters Corp. Twenty-First Century Fox, Inc., Class A Viacom, Inc., Class B Total Media Investments Metal Fabricate/Hardware — 1.0% Precision Castparts Corp. 11,890 Miscellaneous Manufacturing — 4.0% 3M Co. 15,612 Dover Corp. 34,328 Illinois Tool Works, Inc. 27,036 Parker-Hannifin Corp. 20,656 Total Miscellaneous Manufacturing Retail — 8.0% Dillard’s, Inc., Class A Dollar General Corp. Gap, Inc. (The) Home Depot, Inc. (The) Lowe’s Cos., Inc. Macy’s, Inc. McDonald’s Corp. TJX Cos., Inc. (The) Total Retail 23,167 32,110 61,863 22,537 34,912 35,969 24,884 38,263 $ 2,436,937 2,496,231 2,361,311 2,504,537 2,338,057 2,426,828 2,365,722 2,531,863 19,461,486 Semiconductors — 4.8% Intel Corp. NVIDIA Corp. QUALCOMM, Inc. Texas Instruments, Inc. Xilinx, Inc. Total Semiconductors 74,978 116,072 36,099 44,772 53,172 2,280,456 2,334,208 2,260,880 2,306,206 2,348,075 11,529,825 Software — 3.0% Fiserv, Inc.* Microsoft Corp. VMware, Inc., Class A *(a) Total Software 31,132 54,270 27,584 2,578,663 2,396,021 2,365,052 7,339,736 2,408,932 2,409,139 2,481,635 2,402,912 Telecommunications — 2.0% Cisco Systems, Inc. Juniper Networks, Inc. Total Telecommunications 86,466 90,940 2,374,356 2,361,712 4,736,068 9,702,618 Toys/Games/Hobbies — 1.0% Hasbro, Inc. 33,632 2,515,337 52,491 2,420,097 24,938 2,416,742 4,836,839 2,376,454 Office/Business Equipment — 0.9% Xerox Corp. 212,020 2,255,893 Oil & Gas — 3.1% Marathon Petroleum Corp. Valero Energy Corp. Western Refining, Inc. Total Oil & Gas 47,002 42,142 53,596 2,458,675 2,638,088 2,337,858 7,434,621 Oil & Gas Services — 3.9% Cameron International Corp.* FMC Technologies, Inc.* Oceaneering International, Inc. Schlumberger Ltd. Total Oil & Gas Services 44,732 58,486 50,478 26,053 2,342,615 2,426,584 2,351,770 2,245,508 9,366,477 Pharmaceuticals — 3.0% Pfizer, Inc. VCA, Inc.* Zoetis, Inc. Total Pharmaceuticals 71,079 46,760 49,803 2,383,279 2,543,977 2,401,501 7,328,757 Transportation — 2.0% Expeditors International of Washington, Inc. United Parcel Service, Inc., Class B Total Transportation Total Common Stocks (Cost $243,637,445) MONEY MARKET FUND — 0.1% Wells Fargo Advantage Government Money Market Fund − Institutional Class, 0.01%(b) (Cost $268,307) See accompanying Notes to Financial Statements. 117 242,217,774 268,307 268,307
122) ADVISORSHARES TRIMTABS FLOAT SHRINK ETF Schedule of Investments (continued) June 30, 2015 Investments Principal Value (c) REPURCHASE AGREEMENTS — 0.3% Citibank NA, dated 06/30/15, due 07/01/15, 0.14%, total to be received $113,926, (collateralized by various U.S. Government Agency Obligations, 0.63% − 6.50%, 11/15/16 − 07/01/45, totaling $116,204) $113,926 $ 113,926 HSBC Securities USA, Inc., dated 06/30/15, due 07/01/15, 0.12%, total to be received $145,583, (collateralized by various U.S. Government Agency Obligations, 2.50% − 6.50%, 07/01/18 − 07/01/45, totaling $148,495) 145,583 145,583 Mizuho Securities USA, Inc., dated 06/30/15, due 07/01/15, 0.14%, total to be received $250,001, (collateralized by various U.S. Government Agency Obligations, 0.00% − 8.50%, 06/13/16 − 04/20/44, totaling $255,000) 250,000 250,000 Morgan Stanley & Co. LLC, dated 06/30/15, due 07/01/15, 0.09%, total to be received $250,001, (collateralized by various U.S. Government Agency Obligations, 0.75% − 9.50%, 02/16/16 − 05/01/45, totaling $255,000) 250,000 250,000 Total Repurchase Agreements (Cost $759,509) 759,509 Total Investments — 100.3% (Cost $244,665,261) 243,245,590 Liabilities in Excess of Other Assets — (0.3)% (773,467) $ 242,472,123 Net Assets — 100.0% * Non-income producing security. (a) All or a portion of security is on loan. The aggregate market value of the securities on loan is $3,007,503; the aggregate market value of the collateral held by the fund is $3,071,044. The aggregate market value of the collateral includes non-cash U.S. Treasury securities collateral having a value of $2,311,535. (b) Rate shown reflects the 7-day yield as of June 30, 2015. (c) SUMMARY OF SCHEDULE OF INVESTMENTS Advertising Aerospace/Defense Agriculture Apparel Beverages Biotechnology Chemicals Commercial Services Computers Distribution/Wholesale Diversified Financial Services Electrical Components & Equipment Electronics Food Hand/Machine Tools Healthcare − Products Healthcare − Services Insurance Internet Iron/Steel Lodging Machinery − Diversified Media Metal Fabricate/Hardware Miscellaneous Manufacturing Office/Business Equipment Oil & Gas Oil & Gas Services Pharmaceuticals Retail Semiconductors Software Telecommunications Toys/Games/Hobbies Transportation Money Market Fund Repurchase Agreements Total Investments Liabilities in Excess of Other Assets Net Assets Collateral received from brokers for securities lending was invested in these short-term investments. See accompanying Notes to Financial Statements. 118 % of Net Assets 1.0% 2.9 2.9 2.0 1.0 2.1 2.9 6.1 3.9 1.0 5.0 2.0 4.0 3.0 1.0 4.1 2.2 6.1 2.1 0.9 1.0 1.0 5.0 1.0 4.0 0.9 3.1 3.9 3.0 8.0 4.8 3.0 2.0 1.0 2.0 0.1 0.3 100.3 (0.3) 100.0%
123) ADVISORSHARES WCM/BNY MELLON FOCUSED GROWTH ADR ETF Schedule of Investments June 30, 2015 Investments Shares Value Investments COMMON STOCKS — 95.6% 12,654 444,788 Oil & Gas Services — 2.7% Core Laboratories N.V. (Netherlands)(b) Biotechnology — 3.7% CSL Ltd. (Australia)(a) 17,139 570,729 Pharmaceuticals — 4.5% Novo Nordisk A/S (Denmark)(a) Chemicals — 3.6% Novozymes A/S (Denmark)(a)(b) 11,891 564,704 33,465 24,132 613,079 437,996 1,051,075 Value COMMON STOCKS (continued) Apparel — 2.9% LVMH Moet Hennessy Louis Vuitton SE (France)(a) Shares/ Principal Commercial Services — 6.8% Experian PLC (Ireland)(a)(b) SGS SA (Switzerland)(a)(b) Total Commercial Services $ Cosmetics/Personal Care — 5.1% Svenska Cellulosa AB SCA 17,189 (Sweden)(a)(b) 72,500 Unicharm Corp. (Japan)(a)(b) Total Cosmetics/Personal Care 439,351 346,550 785,901 Diversified Financial Services — 4.6% Lazard Ltd., Class A 12,848 722,572 Electronics — 3.8% Sensata Technologies Holding N.V. (Netherlands)* 595,118 11,284 Food — 10.8% Chr. Hansen Holding A/S (Denmark)(a) Nestle SA (Switzerland)(a) Shoprite Holdings Ltd. (South Africa)(a)(b) Total Food 29,746 9,506 728,777 685,953 18,699 269,640 1,684,370 Food Service — 1.9% Compass Group PLC (United Kingdom)(a)(b) 18,100 302,994 Healthcare − Products — 2.6% Sysmex Corp. (Japan)(a) 13,793 411,031 Healthcare − Services — 3.1% ICON PLC (Ireland)* 7,124 479,445 Household Products/Wares — 4.0% Reckitt Benckiser Group PLC 35,651 (United Kingdom)(a)(b) 618,901 Insurance — 4.0% ACE Ltd. (Switzerland) 6,160 626,349 29,600 Transportation — 3.6% Canadian Pacific Railway Ltd. (Canada) Total Common Stocks (Cost $12,912,057) MONEY MARKET FUND — 4.2% Invesco Government & Agency Portfolio − Private Investment Class, 0.04%(d) (Cost $651,100) Machinery − Diversified — 3.5% FANUC Corp. (Japan)(a) 413,737 12,813 701,640 24,099 391,127 12,096 234,910 11,576 282,107 908,144 11,298 556,652 6,286 654,561 39,425 895,342 2,106,555 3,480 557,600 14,864,528 651,100 651,100 366,109 536,789 Internet — 5.0% Tencent Holdings Ltd. (China)(a) Yandex N.V., Class A (Netherlands)* Total Internet $ REPURCHASE AGREEMENTS — 15.7%(e) Citibank NA, dated 06/30/15, due 07/01/15, 0.14%, total to be received $366,110, (collateralized by various U.S. Government Agency Obligations, 0.63% − 6.50%, 11/15/16 − 07/01/45, totaling $373,431) $366,109 HSBC Securities USA, Inc., dated 06/30/15, due 07/01/15, 0.10%, total to be received $568,081, (collateralized by various U.S. Government Agency Obligations, 0.00% − 9.38%, 07/15/15 − 01/15/37, totaling $579,443) 568,079 188,606 782,086 15,691 Semiconductors — 13.6% ARM Holdings PLC (United Kingdom)(a) ASML Holding N.V. (Netherlands)(c) Taiwan Semiconductor Manufacturing Co., Ltd. (Taiwan)(a) Total Semiconductors 593,480 12,392 Retail — 5.8% Inditex SA (Spain)(a) Swatch Group AG (The) (Switzerland)(a)(b) Wal-Mart de Mexico SAB de CV (Mexico)(a) Total Retail 3,628 See accompanying Notes to Financial Statements. 119 568,079
124) ADVISORSHARES WCM/BNY MELLON FOCUSED GROWTH ADR ETF Schedule of Investments (continued) June 30, 2015 Investments Principal REPURCHASE AGREEMENTS (continued) Mizuho Securities USA, Inc., dated 06/30/15, due 07/01/15, 0.14%, total to be received $568,081, (collateralized by various U.S. Government Agency Obligations, 0.00% − 8.50%, 06/13/16 − 04/20/44, totaling $579,441) $568,079 Morgan Stanley & Co. LLC, dated 06/30/15, due 07/01/15, 0.09%, total to be received $568,080 (collateralized by various U.S. Government Agency Obligations, 0.75% − 9.50%, 02/16/16 − 05/01/45, totaling $579,441) 568,079 RBC Capital Markets LLC, dated 06/30/15, due 07/01/15, 0.10%, total to be received $370,374, (collateralized by various U.S. Government Agency Obligations, 2.38% − 6.50%, 03/01/19 − 02/20/65, totaling $377,780) 370,373 Total Repurchase Agreements (Cost $2,440,719) Total Investments — 115.5% (Cost $16,003,876) Liabilities in Excess of Other Assets — (15.5)% Net Assets — 100.0% Value SUMMARY OF SCHEDULE OF INVESTMENTS $ 568,079 568,079 370,373 2,440,719 17,956,347 (2,412,849) $15,543,498 Apparel Biotechnology Chemicals Commercial Services Cosmetics/Personal Care Diversified Financial Services Electronics Food Food Service Healthcare − Products Healthcare − Services Household Products/Wares Insurance Internet Machinery − Diversified Oil & Gas Services Pharmaceuticals Retail Semiconductors Transportation Money Market Fund Repurchase Agreements Total Investments Liabilities in Excess of Other Assets Net Assets PLC — Public Limited Company * Non-income producing security. (a) American Depositary Receipt. (b) All or a portion of security is on loan. The aggregate market value of the securities on loan is $2,384,176; the aggregate market value of the collateral held by the fund is $2,440,719. (c) Registered Shares. (d) Rate shown reflects the 7-day yield as of June 30, 2015. (e) Collateral received from brokers for securities lending was invested in these short-term investments. See accompanying Notes to Financial Statements. 120 % of Net Assets 2.9% 3.7 3.6 6.8 5.1 4.6 3.8 10.8 1.9 2.6 3.1 4.0 4.0 5.0 3.5 2.7 4.5 5.8 13.6 3.6 4.2 15.7 115.5 (15.5) 100.0%
125) ADVISORSHARES YIELDPRO ETF Schedule of Investments June 30, 2015 Investments Shares Value SUMMARY OF SCHEDULE OF INVESTMENTS EXCHANGE TRADED FUNDS — 98.8% Debt Fund — 98.8% iShares 0 − 5 Year High Yield Corporate Bond ETF PIMCO 0 − 5 Year High Yield Corporate Bond Index Exchange-Traded Fund SPDR Barclays Short Term Corporate Bond ETF SPDR Nuveen Barclays Municipal Bond ETF Vanguard Short-Term Bond ETF Vanguard Short-Term Corporate Bond ETF Total Exchange Traded Funds (Cost $34,360,900) MONEY MARKET FUND — 1.4% Wells Fargo Advantage Government Money Market Fund − Institutional Class, 0.01%(a) (Cost $492,809) Total Investments — 100.2% (Cost $34,853,709) Liabilities in Excess of Other Assets — (0.2)% Net Assets — 100.0% 492,809 71,371 $ 3,470,058 34,427 3,438,224 239,750 7,336,350 221,476 96,047 5,253,411 7,702,009 87,533 6,965,876 Debt Fund Money Market Fund Total Investments Liabilities in Excess of Other Assets Net Assets 34,165,928 492,809 34,658,737 (60,755) $34,597,982 ETF — Exchange Traded Fund (a) Rate shown reflects the 7-day yield as of June 30, 2015. See accompanying Notes to Financial Statements. 121 % of Net Assets 98.8% 1.4 100.2 (0.2) 100.0%
126) ADVISORSHARES TRUST Statements of Assets and Liabilities June 30, 2015 AdvisorShares Accuvest Global Long Short ETF AdvisorShares Athena High Dividend ETF AdvisorShares EquityPro ETF ASSETS Investments, at Cost: . . . . . . . . . . . . . . . . . . . . . . . . . . . Repurchase Agreements, at Cost (Note 3) . . . . . . . . . . . . . . . . Total Cost of Investments . . . . . . . . . . . . . . . . . . . . . . . . Investments, at Market Value (including securities on loan) (Note 2)(a) Repurchase Agreements, at Market Value (Note 3) . . . . . . . . . . . Total Market Value of Investments . . . . . . . . . . . . . . . . . . . Cash . . . . . . . . . . . . . . . . . . . . . . . . . . . . . . . . . . . . . Cash collateral held at brokers . . . . . . . . . . . . . . . . . . . . . . Unrealized Appreciation on Swaps Contracts . . . . . . . . . . . . . . Dividends and Interest Receivable . . . . . . . . . . . . . . . . . . . . Receivable from Securities Sold . . . . . . . . . . . . . . . . . . . . . . Reclaim Receivable . . . . . . . . . . . . . . . . . . . . . . . . . . . . . Due from Investment Advisor . . . . . . . . . . . . . . . . . . . . . . . Prepaid CCO Fees . . . . . . . . . . . . . . . . . . . . . . . . . . . . . Prepaid Expenses . . . . . . . . . . . . . . . . . . . . . . . . . . . . . . Total Assets . . . . . . . . . . . . . . . . . . . . . . . . . . . . . . . . . . . . . . . . . . . . . . . . . . . . . . . . . . . . . . . . . . . . . . . . . . . . . . . . . . . . . . . . . . . . . . . . . . . . . . . . . . . . . . . . . . . . . . . . . . . . . . $ 13,645,530 — 13,645,530 13,443,823 — 13,443,823 47,392 367,724 147,769 64,830 — — — 188 7,684 14,079,410 $ 16,242,320 2,000,530 18,242,850 15,234,533 2,000,530 17,235,063 3,919 — — 69,537 — 529 — 1 4,510 17,313,559 $ 19,799,840 2,357,879 22,157,719 19,179,285 2,357,879 21,537,164 — — — 55,025 — 182 — 225 6,345 21,598,941 LIABILITIES Unrealized Depreciation on Swaps Contracts Interest Payable . . . . . . . . . . . . . . . . Advisory Payable . . . . . . . . . . . . . . . . Trustee Fees Payable . . . . . . . . . . . . . . Payable for Securities Purchased . . . . . . . Cash collateral for securities on loan . . . . . Payable to Global Echo Foundation . . . . . Accrued Expenses . . . . . . . . . . . . . . . Total Liabilities . . . . . . . . . . . . . . . . . . . . . . . . . . . . . . . . . . . . . . . . . . . . . . . . . . . . . . . . . . . . . . . . . . . . 13,111 113,496 10,092 750 — — — 49,566 187,015 — — 13,395 749 — 2,000,530 — 34,133 2,048,807 — — 17,910 735 — 2,357,879 — 43,482 2,420,006 NET ASSETS . . . . . . . . . . . . . . . . . . . . . . . . . . . . . . . . . . . . . . $13,892,395 $15,264,752 $19,178,935 $ 27,753,377 — $ 18,490,576 394 $ 18,325,138 254,396 . . . . . . . . . . . . . . . . . . . . . . . . . . . . . . . . . . . . . . . . . . . . . . . . . . . . . . . . . . . . . . . . . . . . . . . . . . . . . . . . . . . . . . . . . . . . . . . . . . . . . . . . . . . . . . . . . . . . . . . . . . . . . . COMPONENTS OF NET ASSETS Capital Stock at Zero Par Value . . . . . . . . . . . . . . . . . . . . . . . . . Undistributed Net Investment Income (Loss) . . . . . . . . . . . . . . . . . Undistributed (Accumulated) Net Gain (Loss) on investments, swaps, short sales, foreign currency transactions, futures and options written . Unrealized Appreciation (Depreciation) on investments, swaps, short sales, options written, futures and foreign currency translations . . . . . . . . NET ASSETS . . . . . . . . . . . . . . . . . . . . . . . . . . . . . . . . . . . . . . . . . . . . (13,793,933) (2,218,431) . . . . . . (67,049) $13,892,395 (1,007,787) $15,264,752 SHARES ISSUED AND OUTSTANDING Shares Outstanding (Unlimited Shares Authorized) . . . . . . . . . . . . . . . . 700,000 Net Asset Value (NAV) Per Share . . . . . . . . . . . . . . . . . . . . . . . . . . . $ 19.85 (a) Market value of securities on loan . . . . . . . . . . . . . . . . . . . . . . . . $ — See accompanying Notes to Financial Statements. 122 1,219,956 (620,555) $19,178,935 800,000 $ 19.08 $ 1,960,360 625,000 $ 30.69 $ 2,305,926
127) ADVISORSHARES TRUST Statements of Assets and Liabilities June 30, 2015 AdvisorShares Gartman Gold/Euro ETF (Consolidated) AdvisorShares Gartman Gold/Yen ETF (Consolidated) AdvisorShares Global Echo ETF AdvisorShares Madrona Domestic ETF AdvisorShares Madrona Global Bond ETF $ 11,026,789 — 11,026,789 11,026,789 — 11,026,789 — 5,757,933 — — — — 167 247 10,088 16,795,224 $ 15,460,955 — 15,460,955 15,460,955 — 15,460,955 — 7,591,526 — — — — — 213 10,149 23,062,843 $ 7,389,112 179,836 7,568,948 7,855,495 179,836 8,035,331 — — — 21,784 97,320 — — — — 8,154,435 $ 28,432,621 769,212 29,201,833 31,605,579 769,212 32,374,791 2,991 — — 27,382 — — — 269 7,170 32,412,603 $ 28,375,381 8,327,697 36,703,078 28,139,529 8,327,697 36,467,226 — — — 6,216 — — — 256 7,181 36,480,879 — — — 746 — — — 36,623 37,369 — — 155 750 — — — 40,285 41,190 — — 7,206 — 105,901 179,836 2,620 — 295,563 — — 17,124 732 — 769,212 — 51,044 838,112 — — 11,974 735 — 8,327,697 — 44,754 8,385,160 $16,757,855 $23,021,653 $7,858,872 $31,574,491 $28,095,719 $ 16,543,043 — $ 22,850,353 — $ 7,335,990 — $ 30,094,165 25,582 $ 28,908,860 44 202,189 579,475 56,499 12,623 $16,757,855 (408,175) $23,021,653 1,275,000 (1,718,214) 466,383 $7,858,872 3,172,958 $31,574,491 125,000 (577,333) 725,000 1,750,000 $ 13.14 $ 13.16 $ 62.87 $ 43.55 $ — $ — $ 280,465 $ 905,203 See accompanying Notes to Financial Statements. 123 (235,852) $28,095,719 1,125,000 $ 24.97 $ 8,092,592
128) ADVISORSHARES TRUST Statements of Assets and Liabilities June 30, 2015 AdvisorShares Madrona International ETF AdvisorShares Meidell Tactical Advantage ETF AdvisorShares Morgan Creek Global Tactical ETF(1) ASSETS Investments, at Cost: . . . . . . . . . . . . . . . . . . . . . . . . . . . . Repurchase Agreements, at Cost (Note 3) . . . . . . . . . . . . . . . . Investments in Affiliates, at Cost (Note 9) . . . . . . . . . . . . . . . . Total Cost of Investments . . . . . . . . . . . . . . . . . . . . . . . . Investments, at Market Value (including securities on loan) (Note 2)(a) Repurchase Agreements, at Market Value (Note 3) . . . . . . . . . . . Investments in Affiliates, at Market Value (Note 9). . . . . . . . . . . . Total Market Value of Investments . . . . . . . . . . . . . . . . . . . Cash . . . . . . . . . . . . . . . . . . . . . . . . . . . . . . . . . . . . . Dividends and Interest Receivable . . . . . . . . . . . . . . . . . . . . Reclaim Receivable . . . . . . . . . . . . . . . . . . . . . . . . . . . . . Cash collateral held at brokers . . . . . . . . . . . . . . . . . . . . . . Receivable from Securities Sold . . . . . . . . . . . . . . . . . . . . . . Due from Investment Advisor . . . . . . . . . . . . . . . . . . . . . . . Prepaid CCO Fees . . . . . . . . . . . . . . . . . . . . . . . . . . . . . Prepaid Expenses . . . . . . . . . . . . . . . . . . . . . . . . . . . . . . Total Assets . . . . . . . . . . . . . . . . . . . . . . . . . . . . . . . . . . . . . . . . . . . . . . . . . . . . . . . . . . . . . . . . . . . . . . . . . . . . . . . . . $ 19,663,714 2,436,360 — 22,100,074 19,335,006 2,436,360 — 21,771,366 310 71,751 8,327 — — — 227 7,121 21,859,102 $ 16,679,427 4,117,585 — 20,797,012 16,973,513 4,117,585 — 21,091,098 — 44,282 — — — — 215 5,333 21,140,928 $ 12,380,704 1,842,084 — 14,222,788 12,328,647 1,842,084 — 14,170,731 — 17,645 — — — 5,093 180 9,738 14,203,387 LIABILITIES Cash collateral for securities on loan . . . . . Advisory Payable . . . . . . . . . . . . . . . . Trustee Fees Payable . . . . . . . . . . . . . . Unrealized Depreciation on Swaps Contracts Securities Sold, Not Yet Purchased (b) . . . . . Payable for Securities Purchased . . . . . . . Capital Shares Payable . . . . . . . . . . . . . CCO Fee Payable . . . . . . . . . . . . . . . . Accrued Expenses . . . . . . . . . . . . . . . Total Liabilities . . . . . . . . . . . . . . . . . . . . . . . . . . . . . . . . . . . . . . . . . . . . 2,436,360 5,229 744 — — — — — 52,102 2,494,435 4,117,585 9,950 746 — — — — — 40,896 4,169,177 1,842,084 — 750 — — — — — 51,591 1,894,425 NET ASSETS . . . . . . . . . . . . . . . . . . . . . . . . . . . . . . . . . . . $19,364,667 $16,971,751 $12,308,962 $ 22,760,567 162,987 $ 17,271,621 64,848 $ 31,442,884 82,968 . . . . . . . . . . . . . . . . . . . . . . . . . . . . . . . . . . . . . . . . . . . . . . . . . . . . . . . . . . . . . . . . . . . . . . . . . . . . . . . . . . . . . . . . . . . . . . . . . . . . . . . . . . . . . . . . . . . . . . . . . . . . . . . . . . . . . . . . . . . . COMPONENTS OF NET ASSETS Capital Stock at Zero Par Value . . . . . . . . . . . . . . . . . . . . . . . . Undistributed Net Investment Income (Loss) . . . . . . . . . . . . . . . . Undistributed (Accumulated) Net Gain (Loss) on investments, swaps, short sales, foreign currency transactions, futures and options written . Unrealized Appreciation (Depreciation) on investments, swaps, short sales, options written, futures and foreign currency translations . NET ASSETS. . . . . . . . . . . . . . . . . . . . . . . . . . . . . . . . . . . . . . (3,230,179) . . (328,708) $19,364,667 SHARES ISSUED AND OUTSTANDING Shares Outstanding (Unlimited Shares Authorized) . . . . . . . . . . . . . . 294,086 $16,971,751 700,000 Net Asset Value (NAV) Per Share . . . . . . . . . . . . . . . . . . . . . . . . $ (a) Market value of securities on loan . . . . . . . . . . . . . . . . . . . . . . (b) Proceeds Received from Securities Sold, Not Yet Purchased . . . . . . . $ 2,356,217 $ — (1) (658,804) 27.66 (19,164,833) (52,057) $12,308,962 550,000 $ 30.86 $ 4,026,607 $ — Formerly known as, AdvisorShares Cambria Global Tactical ETF. See accompanying Notes to Financial Statements. 124 500,000 $ 24.62 $ 1,798,342 $ —
129) ADVISORSHARES TRUST Statements of Assets and Liabilities June 30, 2015 AdvisorShares Newfleet Multi-Sector Income ETF AdvisorShares Pacific Asset Enhanced Floating Rate ETF AdvisorShares Peritus High Yield ETF AdvisorShares Pring Turner Business Cycle ETF AdvisorShares QAM Equity Hedge ETF $ 217,844,051 753,918 — 218,597,969 216,057,464 753,918 — 216,811,382 1,429,639 954,601 — — 244,237 — 962 6,458 219,447,279 $ 28,829,414 — — 28,829,414 28,652,249 — — 28,652,249 14,788 126,281 — — 1,256 — — 47,950 28,842,524 $ 397,218,406 51,883,351 — 449,101,757 372,542,319 51,883,351 — 424,425,670 1,954,493 8,142,320 — — 7,721,905 — 1,139 70,076 442,315,603 $ 4,343,993 350,292 — 4,694,285 4,418,644 350,292 — 4,768,936 — 7,071 113 — — 3,137 161 5,164 4,784,582 $ 6,537,673 — 350,000 6,887,673 6,802,294 — 347,795 7,150,089 9,380 9,782 — 596,891 92,318 1,544 170 7,591 7,867,765 753,918 103,844 559 — — 2,571,055 — — 77,097 3,506,473 — 13,713 747 2,712 — 1,500,000 — 160 13,580 1,530,912 51,883,351 362,370 328 — — 7,892,500 6,111,497 — 74,654 66,324,700 350,292 — 759 — — — — — 40,613 391,664 — — 756 — 563,007 92,454 — — 40,906 697,123 $215,940,806 $27,311,612 $375,990,903 $4,392,918 $7,170,642 $ 219,059,234 46,112 $ 27,488,348 18,971 $ 521,065,893 1,073,647 $ 4,730,190 22,133 $ 6,874,003 (29,206) (1,377,953) (15,830) (121,472,550) (1,786,587) $215,940,806 (179,877) $27,311,612 (24,676,087) $375,990,903 4,400,000 550,000 $ 49.08 $ 49.66 $ $ 1,376,040 — $ $ — — (434,056) 74,651 $4,392,918 9,250,000 $ 29,829 296,016 $7,170,642 175,000 250,000 40.65 $ 25.10 $ 28.68 $ 57,428,728 $ — $ $ 340,699 — $ $ — 596,607 See accompanying Notes to Financial Statements. 125
130) ADVISORSHARES TRUST Statements of Assets and Liabilities June 30, 2015 AdvisorShares Ranger Equity Bear ETF AdvisorShares Sage Core Reserves ETF ASSETS Investments, at Cost: . . . . . . . . . . . . . . . . . . . . . . . . . . . Repurchase Agreements, at Cost (Note 3) . . . . . . . . . . . . . . . . Investments in Affiliates, at Cost (Note 9) . . . . . . . . . . . . . . . . Total Cost of Investments . . . . . . . . . . . . . . . . . . . . . . . . Investments, at Market Value (including securities on loan) (Note 2)(a) Repurchase Agreements, at Market Value (Note 3) . . . . . . . . . . . Investments in Affiliates, at Market Value (Note 9) . . . . . . . . . . . Total Market Value of Investments . . . . . . . . . . . . . . . . . . . Cash . . . . . . . . . . . . . . . . . . . . . . . . . . . . . . . . . . . . . Cash collateral held at brokers . . . . . . . . . . . . . . . . . . . . . . Receivable from Securities Sold . . . . . . . . . . . . . . . . . . . . . . Dividends and Interest Receivable . . . . . . . . . . . . . . . . . . . . Capital Shares Receivable . . . . . . . . . . . . . . . . . . . . . . . . . Reclaim Receivable . . . . . . . . . . . . . . . . . . . . . . . . . . . . . Prepaid CCO Fees . . . . . . . . . . . . . . . . . . . . . . . . . . . . . Prepaid Expenses . . . . . . . . . . . . . . . . . . . . . . . . . . . . . . Total Assets . . . . . . . . . . . . . . . . . . . . . . . . . . . . . . . . . . . . . . . . . . . . . . . . . . . . . . . . . . . . . . . . . . . . . . . . . . . . . . . . . . . . . . . . . . . . . . . . . . . . . . . . . . . . . . . . . . . . . . . . . . . . . . . . . . . . . . . . . . . . . . . . . . . . . . . . . . . . . . . . . . . . . . . . . . . . . . . . . . . . . . . . . . . . . . . . . . . . . . . . . . . . . . . . . . . . . . . . . . . . . . . . . . . . . . . . . . . . . . . . . . . . . . . . . . . . . . . . . . . . . . . . . . . . $ 12,574,072 — 29,997,150 42,571,222 12,574,072 — 29,811,000 42,385,072 76,109,147 126,869,695 11,496,292 201 — — 651 8,874 256,869,932 $ 35,102,059 265,875 — 35,367,934 35,009,331 265,875 — 35,275,206 — 101,042 — 187,091 — — 264 9,775 35,573,378 LIABILITIES Securities Sold, Not Yet Purchased (b) . . . . . . . . . . . Payable for Securities Purchased . . . . . . . . . . . . . Advisory Payable . . . . . . . . . . . . . . . . . . . . . . Interest Payable . . . . . . . . . . . . . . . . . . . . . . Dividend Payable on Securities Sold, Not Yet Purchased Trustee Fees Payable . . . . . . . . . . . . . . . . . . . . Options Written, at Value(c) . . . . . . . . . . . . . . . . Capital Shares Payable . . . . . . . . . . . . . . . . . . . Cash collateral for securities on loan . . . . . . . . . . . Accrued Expenses . . . . . . . . . . . . . . . . . . . . . Total Liabilities . . . . . . . . . . . . . . . . . . . . . . . . . . . . . . . . . . . . . . . . . . . . . . . . . . . . . . . . . . . . . . . . . . . . . . . . . . . . . . . . . . . . . . . . . . . . . . . . . . . . . . . . . . . . . . . . . . . . . . . . . . . . . . . . . . . . . . . . . . . . . . . . . . . . . . . . . . . . . . . . . . . . . . . . . . . . . . 125,683,452 2,839,196 158,392 36,290 7,200 636 — — — 86,042 128,811,208 — 468,792 13,296 1,517 — 728 — — 265,875 40,429 790,637 NET ASSETS . . . . . . . . . . . . . . . . . . . . . . . . . . . . . . . . . . . . . . . . . . . . . . $128,058,724 $34,782,741 . . . . . . . . . . . . . . $ 297,055,876 (1,549,999) $ 35,012,045 3,072 . . . . . . . (171,370,520) . . . . . . . . . . . . . . . . . . . . . . . . . . . . . . . . . . . . . . . . . . . . . . . . . . . . . . . . . . . . . . . . . . . . . . . . . . . . . . . . . . . . . . . . COMPONENTS OF NET ASSETS Capital Stock at Zero Par Value . . . . . . . . . . . . . . . . . . . . . . . . . . . . . Undistributed Net Investment Income (Loss) . . . . . . . . . . . . . . . . . . . . . Undistributed (Accumulated) Net Gain (Loss) on investments, swaps, short sales, foreign currency transactions, futures and options written . . . . . . . . . . . . Unrealized Appreciation (Depreciation) on investments, swaps, short sales, options written, futures and foreign currency translations . . . . . . . . . . . . NET ASSETS . . . . . . . . . . . . . . . . . . . . . . . . . . . . . . . . . . . . . . . . . . . . . . . . . . . . . 3,923,367 $128,058,724 SHARES ISSUED AND OUTSTANDING Shares Outstanding (Unlimited Shares Authorized) . . . . . . . . . . . . . . . . . . . . . . . . (139,868) (92,508) $34,782,741 11,775,000 350,000 Net Asset Value (NAV) Per Share . . . . . . . . . . . . . . . . . . . . . . . . . . . . . . . . . . . $ 10.88 $ 99.38 (a) Market value of securities on loan . . . . . . . . . . . . . . . . . . . . . . . . . . . . . . . . (b) Proceeds Received from Securities Sold, Not Yet Purchased . . . . . . . . . . . . . . . . . . (c) Premiums Received for Options Written . . . . . . . . . . . . . . . . . . . . . . . . . . . . . $ — $ 129,792,969 $ — $ $ $ 258,996 — — See accompanying Notes to Financial Statements. 126
131) ADVISORSHARES TRUST Statements of Assets and Liabilities June 30, 2015 AdvisorShares STAR Global Buy-Write ETF AdvisorShares Sunrise Global Multi-Strategy ETF AdvisorShares TrimTabs Float Shrink ETF AdvisorShares WCM/BNY Mellon Focused Growth ADR ETF AdvisorShares YieldPro ETF $ 24,590,212 — 249,948 24,840,160 26,169,168 — 248,425 26,417,593 — 691,494 — 99,864 — — 250 9,189 27,218,390 $ 1,476,232 — — 1,476,232 1,538,789 — — 1,538,789 — 296,634 — — — — 150 — 1,835,573 $ 243,905,752 759,509 — 244,665,261 242,486,081 759,509 — 243,245,590 — — — 212,776 2,852,613 — 1,173 7,241 246,319,393 $ 13,563,157 2,440,719 — 16,003,876 15,515,628 2,440,719 — 17,956,347 — — — 43,765 — 25,884 213 7,065 18,033,274 $ 34,853,709 — — 34,853,709 34,658,737 — — 34,658,737 — — 2,278,872 14,463 — — 217 9,210 36,961,499 — 529,954 32,845 — — 736 13,449 — — 44,685 621,669 — — 6,584 — — 761 — — — 34,416 41,761 — 2,849,311 179,365 — — 538 — — 759,509 58,547 3,847,270 — — 6,063 — — 746 — — 2,440,719 42,248 2,489,776 — — 22,709 — — 717 — 2,306,720 — 33,371 2,363,517 $26,596,721 $1,793,812 $242,472,123 $15,543,498 $34,597,982 $ 25,265,157 (3,196) $ 1,929,849 (45,447) $ 254,759,510 887,332 $ 13,968,534 36,011 $ 39,156,730 3,170 (298,655) (153,147) 1,633,415 $26,596,721 62,557 $1,793,812 1,000,000 (11,755,048) (1,419,671) $242,472,123 75,000 (413,518) 1,952,471 $15,543,498 4,250,000 $ 26.60 $ 23.92 $ 57.05 $ $ $ — — 69,431 $ $ $ — — — $ $ $ 3,007,503 — — (4,366,946) (194,972) $34,597,982 400,000 $ 1,500,000 38.86 $ 23.07 $ 2,384,176 $ — $ — $ $ $ — — — See accompanying Notes to Financial Statements. 127
132) ADVISORSHARES TRUST Statements of Operations Year or Period Ended June 30, 2015 AdvisorShares Accuvest Global Long Short ETF INVESTMENT INCOME: Dividend Income . . . . . . . . . . Dividend Income from Affiliates . . Interest Income . . . . . . . . . . . Securities lending income (Note 2) Foreign withholding tax . . . . . . Total Investment Income . . . . . . . . . . . . . . . . . . . . . . . . . . . . . . . . . . . . . . . . . . . . . . . . . . . . . . . . . . . . . . . . . . . . . . . . . . . . . . . . . . . . . . . . . . . . . . . . . . . . . . . . . . . . . . . . . . . . . . . . . . . . . . . . . . . . . . . . . . . . . . EXPENSES: Advisory Fees . . . . . . . . . . . . . . . Accounting & Administration Fees . . . Professional Fees . . . . . . . . . . . . . Report to Shareholders . . . . . . . . . . Pricing Fees . . . . . . . . . . . . . . . . Exchange Listing Fees . . . . . . . . . . . Trustee Fees . . . . . . . . . . . . . . . . Custody Fees . . . . . . . . . . . . . . . CCO Fees . . . . . . . . . . . . . . . . . Transfer Agent Fees . . . . . . . . . . . . Insurance Fees . . . . . . . . . . . . . . . Registration Fees . . . . . . . . . . . . . . Contribution to Global Echo Foundation Miscellaneous Fees . . . . . . . . . . . . Total Expenses . . . . . . . . . . . . . Advisory Fees Waived/Recoupment . . . Expense Reimbursement . . . . . . . . . Net Expenses . . . . . . . . . . . . . . Net Investment Income (Loss) . . . . . . . . . . . . . . . . . . . . . . . . . . . . . . . . . . . . . . . . . . . . . . . . . . . . . . . . . . . . . . . . . . . . . . . . . . . . . . . . . . . . . . . . . . . . . . . . . . . . . . . . . . . . . . . . . . . . . . . . . . . . . . . . . . . . . . . . . . . . . . . . . . . . . . . . . . . . . . . . . . . . . . . . . . . . . . . . . . . . . . . . . . . . . . . . . . . . . . . . . . . . . . . . . . . . . . . . . . . . . . . . . . . . . . . . . . . . . . . . . . . . . . . . . . . . . . . . . . . . . . . . . . . . . . . . . . . . . . . . . . . . . . . . . . . . . . . . . . . . . . . . . . . . . . . . . . . . . . . . . . . . . . . . . . . . . . . . . . . . . . . . . . . . . . . . . . . . . . . . . . . . . . . . . . . . . . . . . . . . . . . . . . . . . . . . . . . . . . . . . . . 242,574 76,838 23,243 13,430 8,232 7,497 2,858 2,524 2,331 1,348 1,077 674 — 2,038 384,664 (115,138) — 269,526 (15,622) 88,080 10,308 41,097 10,837 4,809 16,175 2,920 4,428 2,101 826 399 5,331 — 1,465 188,776 (79,776) — 109,000 507,832 203,974 20,444 19,793 11,974 4,898 7,320 2,844 1,528 2,234 1,912 118 4,634 — 6,564 288,237 30,452 — 318,689 318,430 REALIZED AND UNREALIZED GAIN (LOSS) ON: Net Realized Gain (Loss) on: Investments . . . . . . . . . . . . . . . . . . . Investments in Affiliates . . . . . . . . . . . . In-Kind Redemptions . . . . . . . . . . . . . . In-Kind Redemptions in Affiliates . . . . . . . Swaps . . . . . . . . . . . . . . . . . . . . . . Futures . . . . . . . . . . . . . . . . . . . . . . Distributions by other Investment Companies . . . . . . . . . . . . . . . . . . . . . . . . . . . . . . . . . . . . . . . . . . . . . . . . . . . . . . . . . . . . . . . . . . . . . . . . . . . . . . . . . . . . . . . . . . . . . . . . . . . . . . . . . . . . . . . . . . . . . . . (1,603,446) — 364,248 — 703,697 — — (2,202,636) — — — — — — 1,351,756 — 272,155 — — — — . . . . . . . . . . . . . . . . . . . . . . . . . . . . . . . . . . . . . . . . . . . . (565,669) 103,629 — (997,541) (1,007,787) — — (3,210,423) (1,781,112) — — (157,201) . . . . . . . . . . . $(1,013,163) $(2,702,591) (1) 253,781 — 123 — — 253,904 Represents the period July 29, 2014 (commencement of operations) to June 30, 2015. See accompanying Notes to Financial Statements. 128 $ 596,676 — 42 34,494 (14,380) 616,832 AdvisorShares EquityPro ETF . . . . . . Net Change in Unrealized Appreciation (Depreciation) on: Investments . . . . . . . . . . . . . . . . . . . . . . . . . Swaps . . . . . . . . . . . . . . . . . . . . . . . . . . . . Futures . . . . . . . . . . . . . . . . . . . . . . . . . . . . Net Realized and Unrealized Gain (Loss) . . . . . . . . . NET INCREASE (DECREASE) IN NET ASSETS RESULTING FROM OPERATIONS . . . . . . . . . . . . . . . . . . . . $ AdvisorShares Athena High Dividend ETF(1) $ $ 385,425 — 74 251,942 (322) 637,119 161,229
133) ADVISORSHARES TRUST Statements of Operations Year or Period Ended June 30, 2015 AdvisorShares Gartman Gold/Euro ETF (Consolidated) $ — — 1,882 — — 1,882 AdvisorShares Gartman Gold/Yen ETF (Consolidated) $ — — 2,510 — — 2,510 AdvisorShares Global Echo ETF $ 57,312 — 37,738 6,685 (3,002) 98,733 AdvisorShares Madrona Domestic ETF $ 452,640 — 76 8,093 (275) 460,534 AdvisorShares Madrona Global Bond ETF $ 903,195 57,711 70 78,490 — 1,039,466 42,054 30,736 55,041 4,285 7,527 12,971 3,802 — 1,851 574 — 102 — 9,655 168,598 (42,054) (76,843) 49,701 (47,819) 50,105 31,361 55,397 5,881 7,479 12,971 3,807 683 1,946 683 — 1,850 — 9,358 181,521 (50,105) (72,201) 59,215 (56,705) 77,169 — — — — — — — — — — — 28,062 — 105,231 — — 105,231 (6,498) 238,035 100,122 22,865 8,473 5,281 7,546 2,858 14,438 1,987 2,232 951 1,633 — 1,163 407,584 (35,654) — 371,930 88,604 135,687 76,362 22,892 8,833 5,281 7,497 2,856 2,338 1,848 2,036 895 1,484 — 1,517 269,526 (11,721) — 257,805 781,661 258 — — — — (434,847) — — — — — — 338,995 — 126,566 (2,935) 429,774 213 — — — (698,397) — 4,610,406 — — — — (165,278) (163,677) — — — — 40,871 — — (45,609) (480,198) — — (549,013) (210,018) (393,159) — — 160,459 (2,315,861) — — 1,596,148 (1,157,891) — — (1,445,975) $(528,017) $(266,723) $ 153,961 $ 1,684,752 See accompanying Notes to Financial Statements. 129 $ (664,314)
134) ADVISORSHARES TRUST Statements of Operations Year or Period Ended June 30, 2015 AdvisorShares Madrona International ETF INVESTMENT INCOME: Dividend Income . . . . . . . . . . Dividend Income from Affiliates . . Interest Income . . . . . . . . . . . Securities lending income (Note 2) Foreign withholding tax . . . . . . Total Investment Income . . . . . . . . . . . . . . . . . . . . . . . . . . . . . . . . . . 441,804 — 75 95,830 (50,293) 487,416 $ 274,639 94 — 35,941 — 310,674 AdvisorShares Morgan Creek Global Tactical ETF(1) . . . . . . . . . . . . . . . . . . . . . . . . . . . . . . . . . . . . . . . . . . . . . . . . . . . . . . . . . . . . . . . . . . . . . . . . . . . . . . . . . . . . . . . . . . . . . . . . . . . . . . EXPENSES: Advisory Fees . . . . . . . . . . . . . . . . . . Accounting & Administration Fees . . . . . . Professional Fees . . . . . . . . . . . . . . . . Custody Fees . . . . . . . . . . . . . . . . . . Report to Shareholders . . . . . . . . . . . . . Exchange Listing Fees . . . . . . . . . . . . . . Pricing Fees . . . . . . . . . . . . . . . . . . . Trustee Fees . . . . . . . . . . . . . . . . . . . CCO Fees . . . . . . . . . . . . . . . . . . . . Transfer Agent Fees . . . . . . . . . . . . . . . Insurance Fees . . . . . . . . . . . . . . . . . . Registration Fees . . . . . . . . . . . . . . . . . Interest on Securities Sold, Not Yet Purchased Miscellaneous Fees . . . . . . . . . . . . . . . Total Expenses . . . . . . . . . . . . . . . . Advisory Fees Waived/Recoupment . . . . . . Expense Reimbursement . . . . . . . . . . . . Net Expenses . . . . . . . . . . . . . . . . . Net Investment Income (Loss) . . . . . . . . . . . . . . . . . . . . . . . . . . . . . . . . . . . . . . . . . . . . . . . . . . . . . . . . . . . . . . . . . . . . . . . . . . . . . . . . . . . . . . . . . . . . . . . . . . . . . . . . . . . . . . . . . . . . . . . . . . . . . . . . . . . . . . . . . . . . . . . . . . . . . . . . . . . . . . . . . . . . . . . . . . . . . . . . . . . . . . . . . . . . . . . . . . . . . . . . . . . . . . . . . . . . . . . . . . . . . . . . . . . . . . . . . . . . . . . . . . . . . . . . . . . . . . . . . . . . . . . . . . . . . . . . . . . . . . . . . . . . . . . . . . . . . . . . . . . . . . . . . . . . . . . REALIZED AND UNREALIZED GAIN (LOSS) ON: Net Realized Gain (Loss) on: Investments . . . . . . . . . . . . . . . . . . . Investments in Affiliates . . . . . . . . . . . . In-Kind Redemptions . . . . . . . . . . . . . . In-Kind Redemptions in Affiliates . . . . . . . Swaps . . . . . . . . . . . . . . . . . . . . . . Short Sales . . . . . . . . . . . . . . . . . . . . Foreign Currency Transactions . . . . . . . . Options Written . . . . . . . . . . . . . . . . . Distributions by other Investment Companies . . . . . . . . . . . . . . . . . . . . . . . . . . . . . . . . . . . . . . . . . . . . . . . . . . . . . . . . . . . . . . . . . . . . . . . . . . . . . . . . . . . . . . . . . . . . . . . . . . . . . . . . . . . . . . . . . . . . . . . . . . . . . . . . . . . . . . . (1,472,073) — 1,948,380 — — — — — — 192,616 (936) 443,292 — — — — — — 90,596 — 1,456,000 — — — — — 50,150 . . . . . . . . . . . . . . . . . . . . . . . . . . . . . . . . . . . . . . . . . . . . . (1,747,956) — — — (1,271,649) (189,353) — — — 445,619 (2,482,888) — — — (886,142) . . . . . . . . . $(1,013,308) Net Change in Unrealized Appreciation (Depreciation) on: Investments . . . . . . . . . . . . . . . . . . . . . . . . . Short Sales . . . . . . . . . . . . . . . . . . . . . . . . . . Swaps . . . . . . . . . . . . . . . . . . . . . . . . . . . . Foreign currency translations . . . . . . . . . . . . . . . Net Realized and Unrealized Gain (Loss) . . . . . . . . . NET INCREASE (DECREASE) IN NET ASSETS RESULTING FROM OPERATIONS . . . . . . . . . . . . . . . . . . . . $ AdvisorShares Meidell Tactical Advantage ETF 146,608 91,559 22,842 19,173 8,343 7,497 5,281 2,846 1,599 1,375 679 46 — 1,080 308,928 (79,853) 193,668 74,824 22,677 2,522 7,416 7,541 5,008 2,840 1,659 1,211 541 585 — 904 321,396 (103,519) — 217,877 92,797 229,075 258,341 $ 538,416 (1) Formerly known as, AdvisorShares Cambria Global Tactical ETF. (2) Represents the period February 18, 2015 (commencement of operations) to June 30, 2015. See accompanying Notes to Financial Statements. 130 $ 229,143 — 18 32,856 — 262,017 159,072 77,685 80,366 4,960 46,548 9,729 5,281 2,871 2,390 1,326 1,052 — — 2,900 394,180 (159,072) (14,174) 220,934 41,083 $ (845,059)
135) ADVISORSHARES TRUST Statements of Operations Year or Period Ended June 30, 2015 AdvisorShares Newfleet Multi-Sector Income ETF $ — — 6,257,437 14,704 (1,647) 6,270,494 AdvisorShares Pacific Asset Enhanced Floating Rate ETF(2) $ — — 434,885 — — 434,885 AdvisorShares Peritus High Yield ETF $ 2,789,994 — 50,192,656 817,790 (422,645) 53,377,795 AdvisorShares Pring Turner Business Cycle ETF AdvisorShares QAM Equity Hedge ETF $ 107,118 7,858 56 11,135 (1,987) 124,180 $ 88,233 1,556 260 — — 90,049 1,216,397 166,847 25,076 25,851 41,286 7,496 19,014 3,090 6,745 14,037 4,887 7,758 — 4,884 1,543,368 (139,832) — 1,403,536 4,866,958 90,675 3,818 24,496 1,633 3,103 5,072 2,132 1,481 1,129 716 — — — 784 135,039 (30,047) — 104,992 329,893 6,609,619 284,906 41,721 55,148 159,161 7,497 13,957 4,636 24,430 55,492 24,820 62,307 — 40,412 7,384,106 — — 7,384,106 45,993,689 49,131 62,656 22,608 886 3,639 7,496 5,119 2,821 1,308 368 273 103 — 787 157,195 (49,131) (34,860) 73,204 50,976 75,366 75,961 22,761 497 5,184 7,497 8,232 2,826 1,448 565 290 294 11,570 642 213,133 (75,366) (13,148) 124,619 (34,570) (626,103) — — — — — (2,019) — — — — — — (10,073) — — — — (119,735,670) — 1,868,709 — — — — — — (284,838) (36,870) 35,639 — — — — — 236 45,329 — 206,231 (333) — 44,939 — 358 3,848 (2,187,563) — — (2) (2,815,687) (177,165) — (2,712) — (189,950) (52,730,083) — — — (170,597,044) (478,129) — — — (763,962) (244,333) 52,406 — — 108,445 $(124,603,355) $(712,986) $ 2,051,271 $ 139,943 See accompanying Notes to Financial Statements. 131 $ 73,875
136) ADVISORSHARES TRUST Statements of Operations Year or Period Ended June 30, 2015 AdvisorShares Ranger Equity Bear ETF INVESTMENT INCOME: Dividend Income . . . . . . . . . . Dividend Income from Affiliates . . Interest Income . . . . . . . . . . . Securities lending income (Note 2) Foreign withholding tax . . . . . . Total Investment Income . . . . . . . . . . . . . . . . . . . . . . . . . . . . . . . . . . . . . . . . . . . . . . . . . . . . . . . . . . . . . . . . . . . . . . . . . . . . . . . . . . . . . . . . . . . . . . . . . . . . . . . . . . . . . . . . . . . . . . . . . . . . . . . . . . . . . . . . . . . . . . . . . . . . . . . . . . . . . . . . . . . . . . . . . . . . . . . . . . . . . . . . EXPENSES: Advisory Fees . . . . . . . . . . . . . . . . . . Accounting & Administration Fees . . . . . . Report to Shareholders . . . . . . . . . . . . . Professional Fees . . . . . . . . . . . . . . . . Custody Fees . . . . . . . . . . . . . . . . . . Transfer Agent Fees . . . . . . . . . . . . . . . Pricing Fees . . . . . . . . . . . . . . . . . . . Exchange Listing Fees . . . . . . . . . . . . . . Insurance Fees . . . . . . . . . . . . . . . . . . Registration Fees . . . . . . . . . . . . . . . . . Trustee Fees . . . . . . . . . . . . . . . . . . . CCO Fees . . . . . . . . . . . . . . . . . . . . Interest on Securities Sold, Not Yet Purchased Dividend Expense . . . . . . . . . . . . . . . . Licensing Fees . . . . . . . . . . . . . . . . . . Miscellaneous Fees . . . . . . . . . . . . . . . Total Expenses . . . . . . . . . . . . . . . . Advisory Fees Waived/Recoupment . . . . . . Expense Reimbursement . . . . . . . . . . . . Net Expenses . . . . . . . . . . . . . . . . . Net Investment Income (Loss) . . . . . . . . . . . . . . . . . . . . . . . . . . . . . . . . . . . . . . . . . . . . . . . . . . . . . . . . . . . . . . . . . . . . . . . . . . . . . . . . . . . . . . . . . . . . . . . . . . . . . . . . . . . . . . . . . . . . . . . . . . . . . . . . . . . . . . . . . . . . . . . . . . . . . . . . . . . . . . . . . . . . . . . . . . . . . . . . . . . . . . . . . . . . . . . . . . . . . . . . . . . . . . . . . . . . . . . . . . . . . . . . . . . . . . . . . . . . . . . . . . . . . . . . . . . . . . . . . . . . . . . . . . . . . . . . . . . . . . . . . . . . . . . . . . . . . . . . . . . . . . . . . . . . . . . . . . . . . . . . . . . . . . . . . . . . . . . . . . . . . . . . . . . . . . . . . . . . . . . . . . . . . . . . . . . . . . . . . . . . . . . . . . . . . . . . . . . . . . . . . . . . . . . . . . . . . . . . . . . . . . . . . . . . . . . . . . . . . . . . . . . . . . . . . . . . . . . . . . . . . . . . . . . . . . . . . . . . . . . . . . . . . . . . . . . . . . . . . . . . . . . . . . . . . . . 2,239,492 84,561 49,183 26,379 11,278 11,198 8,232 7,497 6,038 3,359 3,105 2,577 1,112,213 608,898 — 9,727 4,183,737 — — 4,183,737 (4,060,161) 109,224 41,924 25,259 48,593 4,671 2,731 10,699 11,857 210 2,512 3,059 2,291 — — — 2,629 265,659 (109,224) (29,007) 127,428 43,627 REALIZED AND UNREALIZED GAIN (LOSS) ON: Net Realized Gain (Loss) on: Investments . . . . . . . . . . . . . . . . . . . Investments in Affiliates . . . . . . . . . . . . In-Kind Redemptions . . . . . . . . . . . . . . In-Kind Redemptions in Affiliates . . . . . . . Short Sales . . . . . . . . . . . . . . . . . . . . Foreign Currency Transactions . . . . . . . . Futures . . . . . . . . . . . . . . . . . . . . . . Options Written . . . . . . . . . . . . . . . . . Distributions by other Investment Companies . . . . . . . . . . . . . . . . . . . . . . . . . . . . . . . . . . . . . . . . . . . . . . . . . . . . . . . . . . . . . . . . . . . . . . . . . . . . . . . . . . . . . . . . . . . . . . . . . . . . . . . . . . . . . . . . . . . . . . . . . . . . . . . . . . . . . . . . . . . . . . . . . . . . . . . . . . . . . . . . . . . . . . . . . . . . . . . . . . . . . . . . . . . . . . . . . . . . . . . . . . . . . . . 22 — — — (19,107,533) — — — — 15,590 — — — — — (50,432) — — . . . . . . . . . . . . . . . . . . . . . . . . . . . . . . . . . . . . . . . . . . . . . . . . . . . . . . . . . . . . . . . . . . . . . . . . . . . . . . . . . . . . . (132,000) 12,466,124 — — (6,773,387) (13,473) — — (429) (48,744) . . . . . . . . . . . . . . . . . $(10,833,548) Net Change in Unrealized Appreciation (Depreciation) on: Investments . . . . . . . . . . . . . . . . . . . . . . . . . Short Sales . . . . . . . . . . . . . . . . . . . . . . . . . . Options Written . . . . . . . . . . . . . . . . . . . . . . . Futures . . . . . . . . . . . . . . . . . . . . . . . . . . . . Net Realized and Unrealized Gain (Loss) . . . . . . . . . NET INCREASE (DECREASE) IN NET ASSETS RESULTING FROM OPERATIONS . . . . . . . . . . . . . . . . . . . . (1) $ — 118,989 4,587 — — 123,576 AdvisorShares Sage Core Reserves ETF Represents the period July 8, 2014 (commencement of operations) to June 30, 2015. See accompanying Notes to Financial Statements. 132 $ $ — — 171,157 173 (275) 171,055 (5,117)
137) ADVISORSHARES TRUST Statements of Operations Year or Period Ended June 30, 2015 AdvisorShares STAR Global Buy-Write ETF AdvisorShares Sunrise Global Multi-Strategy ETF(1) AdvisorShares TrimTabs Float Shrink ETF AdvisorShares WCM/BNY Mellon Focused Growth ADR ETF AdvisorShares YieldPro ETF $499,938 1,003 212 — — 501,153 $ 35,941 — — — — 35,941 $ 3,153,895 — 57 17,733 (2,674) 3,169,011 $ 295,994 — 207 52,797 (32,619) 316,379 $ 2,443,389 174,117 512 — — 2,618,018 359,275 77,677 10,217 21,215 5,365 1,996 6,774 7,497 893 324 2,860 1,846 — — — 1,376 497,315 (4,976) — 492,339 8,814 31,204 9,016 10,323 56,053 1,907 156 5,000 7,802 343 740 2,918 1,893 — — — 1,587 128,942 (31,204) (61,333) 36,405 (464) 1,787,781 74,226 46,688 24,681 15,561 13,545 5,350 7,496 4,268 4,955 3,060 6,839 — — — 4,550 1,999,000 (211,220) — 1,787,780 1,381,231 111,297 72,133 4,972 22,596 2,050 1,113 5,281 7,497 453 1,620 2,834 2,408 — — 6,399 650 241,303 (55,807) — 185,496 130,883 461,572 26,636 28,304 43,265 3,257 4,328 7,361 8,143 1,441 5,785 3,512 4,193 — — — 5,822 603,619 — — 603,619 2,014,399 (21,980) — 383,698 (111) — — — 21,458 269 (54,452) — 54,396 — — 363 (100,159) — — (7,774,553) — 30,524,178 — — — — — — 38,779 — 314,566 — — — — — — (3,150,261) (482,303) 122,819 (7,807) — — — — 6,121 (11,288) — 46,223 — 418,269 62,557 — — — (37,295) (7,341,753) — — — 15,407,872 (262,768) — — — 90,577 (1,445,645) — — — (4,957,076) $427,083 $ (37,759) $16,789,103 $ 221,460 See accompanying Notes to Financial Statements. 133 $(2,942,677)
138) ADVISORSHARES TRUST Statements of Changes in Net Assets AdvisorShares Accuvest Global Long Short ETF AdvisorShares Athena High Dividend ETF Year ended June 30, 2015 INCREASE (DECREASE) IN NET ASSETS OPERATIONS Net Investment Income (Loss) . . . . . . . . . . . . . . . . . . . . . . Net Realized Gain (Loss) . . . . . . . . . . . . . . . . . . . . . . . . . Net Change in Unrealized Appreciation (Depreciation) . . . . . . . . Net Increase (Decrease) In Net Assets Resulting From Operations . . . . . . . . Year ended June 30, 2014 For the period July 29, 2014* to June 30, 2015 $ $ $ DISTRIBUTIONS TO SHAREHOLDERS FROM Net Investment Income . . . . . . . . . . . . . . . . . . . . . . . . . . . Net Realized Gains . . . . . . . . . . . . . . . . . . . . . . . . . . . . . . Total Distributions . . . . . . . . . . . . . . . . . . . . . . . . . . . . CAPITAL STOCK TRANSACTIONS Proceeds from Shares Issued . . . . . . . . . . . . . . . . . . . Value of Shares Redeemed . . . . . . . . . . . . . . . . . . . . . Net Increase (Decrease) From Capital Stock Transactions . . Net Increase (Decrease) in Net Assets . . . . . . . . . . . . . . . . . . . . . . . . . . . . . . . . Net Assets: Beginning of Period . . . . . . . . . . . . . . . . . . . . . . . . . . . . . End of Period . . . . . . . . . . . . . . . . . . . . . . . . . . . . . . . . . Undistributed Net Investment Income (Loss) . . . . . . . . . . . . . . . Changes in Shares Outstanding Shares Outstanding, Beginning of Period Shares Sold . . . . . . . . . . . . . . . . . Shares Repurchased . . . . . . . . . . . . End of Period . . . . . . . . . . . . . . . . * . . . . . . . . . . . . . . . . . . . . . . . . . . . . . . . . . . . . . . . . . . . . . . . . . . . . . . . . . . . . . . . . . . . . (15,622) (535,501) (462,040) (1,013,163) — — — 12,476,577 (23,467,035) (10,990,458) (12,003,621) (151,464) (1,275,082) (579,792) (2,006,338) — — — 69,802,024 (84,472,216) (14,670,192) (16,676,530) 507,832 (2,202,636) (1,007,787) (2,702,591) (529,121) — (529,121) 18,496,464 — 18,496,464 15,264,752 25,896,016 $ 13,892,395 42,572,546 $ 25,896,016 — $15,264,752 $ $ $ — 1,250,000 600,000 (1,150,000) 700,000 Commencement of operations. See accompanying Notes to Financial Statements. 134 — 1,950,000 3,250,000 (3,950,000) 1,250,000 394 — 800,000 — 800,000
139) ADVISORSHARES TRUST Statements of Changes in Net Assets AdvisorShares Gartman Gold/Euro ETF (Consolidated) AdvisorShares EquityPro ETF Year ended June 30, 2015 Year ended June 30, 2014 Year ended June 30, 2015 $ $ $ 318,430 1,623,911 (1,781,112) 161,229 416,909 264,841 1,054,167 1,735,917 (47,819) (434,589) (45,609) (528,017) AdvisorShares Gartman Gold/Yen ETF (Consolidated) For the period February 11, 2014* to June 30, 2014 $ (3,093) (32,913) 58,232 22,226 Year ended June 30, 2015 $ (56,705) 338,995 (549,013) (266,723) For the period February 11, 2014* to June 30, 2014 $ (24,357) (296,740) (321,097) (7,557) (161,492) 140,838 (28,211) (269,924) (463,353) (733,277) (154,669) — (154,669) (27,862) (126,850) (154,712) — — — — — — 11,378,050 (11,696,707) (318,657) (890,705) 20,096,255 (2,964,386) 17,131,869 18,713,117 17,829,090 (1,690,732) 16,138,358 15,455,629 1,280,000 — 1,280,000 1,302,226 19,728,176 — 19,728,176 19,140,356 3,909,508 — 3,909,508 3,881,297 20,069,640 $ 19,178,935 1,356,523 $20,069,640 1,302,226 $16,757,855 — $1,302,226 3,881,297 $23,021,653 — $3,881,297 $ $ $ $ $ $ 254,396 625,000 375,000 (375,000) 625,000 269,918 50,000 675,000 (100,000) 625,000 — 100,000 1,300,000 (125,000) 1,275,000 (3,093) — 100,000 — 100,000 — 300,000 1,450,000 — 1,750,000 See accompanying Notes to Financial Statements. 135 (7,557) — 300,000 — 300,000
140) ADVISORSHARES TRUST Statements of Changes in Net Assets AdvisorShares Global Echo ETF Year ended June 30, 2015 INCREASE (DECREASE) IN NET ASSETS OPERATIONS Net Investment Income . . . . . . . . . Net Realized Gain (Loss) . . . . . . . . . Net Change in Unrealized Appreciation (Depreciation) . . . . . . . . . . . . . Net Increase (Decrease) In Net Assets Resulting From Operations . . . . . . . . . . . . . . . . . . . $ (6,498) 553,618 AdvisorShares Madrona Domestic ETF Year ended June 30, 2014 $ 26,912 33,814 Year ended June 30, 2015 Year ended June 30, 2014 $ $ 88,604 3,912,009 66,719 2,601,716 . . . . . . . (393,159) 673,768 (2,315,861) 2,619,735 . . . . . . . 153,961 734,494 1,684,752 5,288,170 DISTRIBUTIONS TO SHAREHOLDERS FROM Net Investment Income . . . . . . . . . . . . . . . . Total Distributions . . . . . . . . . . . . . . . . . CAPITAL STOCK TRANSACTIONS Proceeds from Shares Issued . . . . . . . Value of Shares Redeemed . . . . . . . . . Net Increase (Decrease) From Capital Stock Transactions . . . . . . . . . . . Net Increase (Decrease) in Net Assets (2,380) (2,380) (96,271) (96,271) (59,938) (59,938) . . . . . . . . . . . . 1,593,777 (3,058,904) 3,045,916 — 23,992,082 (18,761,355) 10,327,769 (9,393,829) . . . . . . . . . . . . (1,465,127) (1,357,243) 3,045,916 3,778,030 5,230,727 6,819,208 933,940 6,162,172 9,216,115 $ 7,858,872 5,438,085 $9,216,115 24,755,283 $ 31,574,491 18,593,111 $24,755,283 $ $ $ $ Net Assets: Beginning of Period . . . . . . . . . . . . . . . . . . End of Period . . . . . . . . . . . . . . . . . . . . . . Undistributed Net Investment Income (Loss) . . . . Changes in Shares Outstanding Shares Outstanding, Beginning of Period Shares Sold . . . . . . . . . . . . . . . . . Shares Repurchased . . . . . . . . . . . . End of Period . . . . . . . . . . . . . . . . (46,077) (46,077) . . . . . . . . . . . . . . . . . . . . . . . . — 150,000 25,000 (50,000) 125,000 30,808 100,000 50,000 — 150,000 See accompanying Notes to Financial Statements. 136 25,582 600,000 575,000 (450,000) 725,000 33,249 575,000 275,000 (250,000) 600,000
141) ADVISORSHARES TRUST Statements of Changes in Net Assets AdvisorShares Madrona Global Bond ETF AdvisorShares Madrona International ETF AdvisorShares Meidell Tactical Advantage ETF Year ended June 30, 2015 Year ended June 30, 2014 Year ended June 30, 2015 Year ended June 30, 2014 Year ended June 30, 2015 Year ended June 30, 2014 $ $ $ $ $ $ 781,661 (288,084) 763,418 (166,336) 258,341 476,307 265,073 2,099,473 92,797 634,972 67,957 223,038 (1,157,891) 1,351,960 (1,747,956) 1,576,909 (189,353) 491,104 (664,314) 1,949,042 (1,013,308) 3,941,455 538,416 782,099 (823,886) (823,886) (761,153) (761,153) (304,843) (304,843) (318,396) (318,396) (93,938) (93,938) 5,201,228 — 1,282,317 (630,454) 14,565,285 (13,161,115) 6,765,707 (6,088,375) 12,076,557 (11,298,866) 22,189,205 (16,430,574) 5,201,228 3,713,028 651,863 1,839,752 1,404,170 86,019 677,332 4,300,391 777,691 1,222,169 5,758,631 6,540,730 24,382,691 $28,095,719 22,542,939 $24,382,691 19,278,648 $ 19,364,667 14,978,257 $19,278,648 15,749,582 $ 16,971,751 9,208,852 $ 15,749,582 $ $ $ $ $ $ 44 925,000 200,000 — 1,125,000 13,352 900,000 50,000 (25,000) 925,000 162,987 650,000 500,000 (450,000) 700,000 208,792 625,000 250,000 (225,000) 650,000 64,848 525,000 400,000 (375,000) 550,000 See accompanying Notes to Financial Statements. 137 — — 67,182 325,000 750,000 (550,000) 525,000
142) ADVISORSHARES TRUST Statements of Changes in Net Assets AdvisorShares Morgan Creek Global Tactical ETF(1) Year ended June 30, 2015 INCREASE (DECREASE) IN NET ASSETS OPERATIONS Net Investment Income . . . . . . . . . . . . . . . Net Realized Gain (Loss) . . . . . . . . . . . . . . . Net Change in Unrealized Appreciation (Depreciation) . . . . . . . . . . . . . . . . . . . Net Increase (Decrease) In Net Assets Resulting From Operations . . . . . . . . . . . . . . . . . . Year ended June 30, 2014 $ $ 41,083 1,596,746 514,710 2,606,984 . (2,482,888) (845,059) (354,156) — (354,156) $ 4,049,199 DISTRIBUTIONS TO SHAREHOLDERS FROM Net Investment Income . . . . . . . . . . . . . . . . Net Realized Gains . . . . . . . . . . . . . . . . . . . Total Distributions . . . . . . . . . . . . . . . . . Year ended June 30, 2015 927,505 . AdvisorShares Newfleet Multi-Sector Income ETF — — — CAPITAL STOCK TRANSACTIONS Proceeds from Shares Issued . . . . . . . . . . Value of Shares Redeemed . . . . . . . . . . . . Net Increase (Decrease) From Capital Stock Transactions . . . . . . . . . . . . . . . . . . Net Increase (Decrease) in Net Assets . . . . . . . . . . . 2,658,998 (52,072) (2,187,565) 2,057,227 2,051,271 4,664,153 (5,247,098) — (5,247,098) (2,905,125) — (2,905,125) — (23,158,545) 1,306,971 (18,631,777) 69,253,284 (4,927,422) 72,137,339 (2,447,417) . . . . . . (23,158,545) (24,357,760) (17,324,806) (13,275,607) 64,325,862 61,130,035 69,689,922 71,448,950 Undistributed Net Investment Income (Loss) . . . . . . . . $ . . . . . . Net Assets: Beginning of Period . . . . . . . . . . . . . . . . . . End of Period . . . . . . . . . . . . . . . . . . . . . . Changes in Shares Outstanding Shares Outstanding, Beginning of Period Shares Sold . . . . . . . . . . . . . . . . . Shares Repurchased . . . . . . . . . . . . End of Period . . . . . . . . . . . . . . . . 4,866,958 (628,122) Year ended June 30, 2014 . . . . . . . . . . . . 36,666,722 $ 12,308,962 49,942,329 $ 36,666,722 154,810,771 $215,940,806 83,361,821 $154,810,771 $ $ $ $ 82,968 1,400,000 — (900,000) 500,000 (1) 2,100,000 50,000 (750,000) 1,400,000 Formerly known as, AdvisorShares Cambria Global Tactical ETF. * 354,155 Commencement of operations. See accompanying Notes to Financial Statements. 138 46,112 3,100,000 1,400,000 (100,000) 4,400,000 77,533 1,700,000 1,450,000 (50,000) 3,100,000
143) ADVISORSHARES TRUST Statements of Changes in Net Assets AdvisorShares Pacific Asset Enhanced Floating Rate ETF AdvisorShares Peritus High Yield ETF For the period February 18, 2015* to June 30, 2015 $ 329,893 (10,073) Year ended June 30, 2015 $ 45,993,689 (117,866,961) AdvisorShares Pring Turner Business Cycle ETF Year ended June 30, 2014 $ 46,696,979 7,747 Year ended June 30, 2015 $ 50,976 (285,833) Year ended June 30, 2014 $ 48,924 128,393 (179,877) (52,730,083) 28,680,594 (478,129) 580,835 139,943 (124,603,355) 75,385,320 (712,986) 758,152 (316,679) — (316,679) (48,496,620) — (48,496,620) (45,294,692) (385,440) (45,680,132) (53,639) — (53,639) (59,326) — (59,326) 27,488,348 — 192,942,545 (719,848,257) 786,562,567 — 725,852 (640,545) 1,309,926 (2,663,641) 27,488,348 27,311,612 (526,905,712) (700,005,687) 786,562,567 816,267,755 85,307 (681,318) (1,353,715) (654,889) — $27,311,612 1,075,996,590 $ 375,990,903 259,728,835 $1,075,996,590 5,074,236 $4,392,918 5,729,125 $ 5,074,236 $ $ $ $ $ 18,971 — 550,000 — 550,000 1,073,647 20,200,000 4,000,000 (14,950,000) 9,250,000 1,623,319 5,150,000 15,050,000 — 20,200,000 22,133 175,000 25,000 (25,000) 175,000 See accompanying Notes to Financial Statements. 139 18,295 225,000 50,000 (100,000) 175,000
144) ADVISORSHARES TRUST Statements of Changes in Net Assets AdvisorShares QAM Equity Hedge ETF AdvisorShares Ranger Equity Bear ETF Year ended June 30, 2015 INCREASE (DECREASE) IN NET ASSETS OPERATIONS Net Investment Income (Loss) . . . . . . . . . . . . Net Realized Gain (Loss) . . . . . . . . . . . . . . . Net Change in Unrealized Appreciation (Depreciation) . . . . . . . . . . . . . . . . . . . Net Increase (Decrease) In Net Assets Resulting From Operations . . . . . . . . . . . . . . . . . . Year ended June 30, 2014 $ $ * . . . . . . . . $ (4,722,034) (48,679,864) 292,416 12,334,124 (3,692,274) . 73,875 582,601 (10,833,548) (57,094,172) — (64,929) (64,929) — (119,153) (119,153) . . . . . . 1,427,899 (2,808,730) 5,525,090 (1,377,532) 49,008,377 (72,068,067) 66,544,424 (65,855,506) . . . . . . (1,380,831) (1,371,885) 4,147,558 4,611,006 (23,059,690) (33,893,238) 688,918 (56,405,254) Undistributed Net Investment Income (Loss) . . . . . . . . $ (4,060,161) (19,107,511) (191,927) Net Assets: Beginning of Period . . . . . . . . . . . . . . . . . . End of Period . . . . . . . . . . . . . . . . . . . . . . Changes in Shares Outstanding Shares Outstanding, Beginning of Period Shares Sold . . . . . . . . . . . . . . . . . Shares Repurchased . . . . . . . . . . . . End of Period . . . . . . . . . . . . . . . . (48,172) 338,357 Year ended June 30, 2014 . DISTRIBUTIONS TO SHAREHOLDERS FROM Net Investment Income . . . . . . . . . . . . . . . . Net Realized Gains . . . . . . . . . . . . . . . . . . . Total Distributions . . . . . . . . . . . . . . . . . CAPITAL STOCK TRANSACTIONS Proceeds from Shares Issued . . . . . . . . . . Value of Shares Redeemed . . . . . . . . . . . . Net Increase (Decrease) From Capital Stock Transactions . . . . . . . . . . . . . . . . . . Net Increase (Decrease) in Net Assets . . . (34,570) 300,372 Year ended June 30, 2015 . . . . . . . . . . . . — — — — — — 8,542,527 $ 7,170,642 3,931,521 $ 8,542,527 161,951,962 $128,058,724 218,357,216 $161,951,962 $ $ $ (1,549,999) $ (2,033,900) 13,750,000 4,225,000 (6,200,000) 11,775,000 13,500,000 4,950,000 (4,700,000) 13,750,000 (29,206) 300,000 50,000 (100,000) 250,000 — 150,000 200,000 (50,000) 300,000 Commencement of operations. See accompanying Notes to Financial Statements. 140
145) ADVISORSHARES TRUST Statements of Changes in Net Assets AdvisorShares Sage Core Reserves ETF Year ended June 30, 2015 $ 43,627 (34,842) For the period January 14, 2014* to June 30, 2014 $ AdvisorShares Sunrise Global Multi-Strategy ETF AdvisorShares STAR Global Buy-Write ETF 119,779 2,015 Year ended June 30, 2015 Year ended June 30, 2014 For the period July 8, 2014* to June 30, 2015 $ $ $ 8,814 383,334 (102,119) 339,698 (464) (99,852) (13,902) (78,606) 34,935 2,240,003 62,557 (5,117) 43,188 427,083 2,477,582 (37,759) — — — — — — (45,346) — (45,346) (147,384) — (147,384) (119,991) — (119,991) — (2,483,570) 37,495,615 — 1,315,362 (2,635,459) 4,947,012 (2,362,662) 3,736,304 (1,859,387) (2,483,570) (2,636,071) 37,495,615 37,418,812 (1,320,097) (893,014) 2,584,350 5,061,932 1,876,917 1,793,812 37,418,812 $34,782,741 — $37,418,812 27,489,735 $26,596,721 22,427,803 $27,489,735 — $ 1,793,812 $ $ $ $ $ 3,072 375,000 — (25,000) 350,000 8,116 — 375,000 — 375,000 (3,196) 1,050,000 50,000 (100,000) 1,000,000 (60,353) 950,000 200,000 (100,000) 1,050,000 See accompanying Notes to Financial Statements. 141 (45,447) — 150,000 (75,000) 75,000
146) ADVISORSHARES TRUST Statements of Changes in Net Assets AdvisorShares WCM/BNY Mellon Focused Growth ADR ETF AdvisorShares TrimTabs Float Shrink ETF Year ended June 30, 2015 Year ended June 30, 2014 Year ended June 30, 2015 INCREASE (DECREASE) IN NET ASSETS OPERATIONS Net Investment Income . . . . . . . . $ 1,381,231 $ 831,991 $ Net Realized Gain (Loss) . . . . . . . 22,749,625 10,973,199 Net Change in Unrealized Appreciation (Depreciation) . . . . (7,341,753) 5,511,917 Net Increase (Decrease) In Net Assets Resulting From Operations . . . . . . . . . . . . 16,789,103 17,317,107 DISTRIBUTIONS TO SHAREHOLDERS FROM Net Investment Income . . . . . . . . (1,045,971) Total Distributions . . . . . . . . (1,045,971) CAPITAL STOCK TRANSACTIONS Proceeds from Shares Issued . . Value of Shares Redeemed . . . Net Increase (Decrease) From Capital Stock Transactions . Net Increase (Decrease) in Net Assets . . . . . . . . . . . . . . . AdvisorShares YieldPro ETF Year ended June 30, 2014 130,883 $ 353,345 Year ended June 30, 2015 For the period March 4, 2014* to June 30, 2014 48,335 $ 2,014,399 $ 70,960 (3,511,431) 675,347 (769,325) (262,768) 1,505,268 (1,445,645) 1,250,673 221,460 1,624,563 (2,942,677) 1,156,695 (300,553) (300,553) (94,665) (94,665) 709,868,546 402,230,886 (620,154,900) (307,889,188) 3,760,440 (1,003,980) (54,540) (54,540) (2,337,383) (2,337,383) (532,662) (532,662) 5,438,789 5,215,701 (1,694,175) (37,372,924) 72,033,809 (622,577) . . . 89,713,646 94,341,698 2,756,460 3,744,614 (32,157,223) 71,411,232 . . . 105,456,778 111,358,252 2,883,255 5,314,637 (37,437,283) 72,035,265 Net Assets: Beginning of Period . . . . . . . . . . 137,015,345 25,657,093 12,660,243 7,345,606 72,035,265 — End of Period . . . . . . . . . . . . . . $ 242,472,123 $ 137,015,345 $15,543,498 $12,660,243 $ 34,597,982 $72,035,265 Undistributed Net Investment Income (Loss) . . . . . . . . . . . . $ Changes in Shares Outstanding Shares Outstanding, Beginning of Period . . . . . . . . . . . . Shares Sold . . . . . . . . . . . . Shares Repurchased . . . . . . . End of Period . . . . . . . . . . . * . . . . . . . . . . . . 887,332 $ 2,675,000 13,000,000 (11,425,000) 4,250,000 552,118 $ 625,000 8,600,000 (6,550,000) 2,675,000 36,011 $ 325,000 100,000 (25,000) 400,000 — $ 225,000 150,000 (50,000) 325,000 Commencement of operations. See accompanying Notes to Financial Statements. 142 3,170 $ 2,850,000 225,000 (1,575,000) 1,500,000 142,685 — 2,875,000 (25,000) 2,850,000
147) ADVISORSHARES TRUST Statement of Cash Flows AdvisorShares Accuvest Global Long Short ETF AdvisorShares QAM Equity Hedge ETF AdvisorShares Ranger Equity Bear ETF Year ended June 30, 2015 Year ended June 30, 2015 Year ended June 30, 2015 CASH FLOWS PROVIDED (USED) BY OPERATING ACTIVITIES: Dividends and Interest received . . . . . . . . . . . . . . . . . . Operating expenses paid . . . . . . . . . . . . . . . . . . . . . Net purchases of short-term investments . . . . . . . . . . . . Realized gain (loss) on swap contracts and option contracts . Purchases of long-term investments . . . . . . . . . . . . . . . Proceeds from disposition of long-term investments . . . . . . Increase/Decrease in receivables for securities sold . . . . . . . Increase/Decrease in payables for securities purchased . . . . . Net Increase/Decrease in short sales . . . . . . . . . . . . . . . Capital gains paid . . . . . . . . . . . . . . . . . . . . . . . . . Dividends paid . . . . . . . . . . . . . . . . . . . . . . . . . . . Interest paid . . . . . . . . . . . . . . . . . . . . . . . . . . . . Net Cash Flows Provided (Used) By Operating Activities . . . . . . . . . . . . . . . . . . . . . . . . . . . . . . . . . . . . . . . . . . . . . . . . . . . . . . . . . . . . . . . . . . . . . . . . . . . . . . . . $ CASH FLOWS PROVIDED (USED) BY FINANCING ACTIVITIES: Net proceeds from shares issued . . . . . . . . . . . . . . . . . Value of shares redeemed . . . . . . . . . . . . . . . . . . . . . Cash dividends paid to shareholders . . . . . . . . . . . . . . . Deposits with brokers for swap contracts and short sales . . . . Net Cash Flows Provided (Used) By Financing Activities . . NET INCREASE/DECREASE IN CASH . . . . . . . . . . . . . . . . Cash, Beginning of year . . . . . . . . . . . . . . . . . . . . . . Cash, End of year . . . . . . . . . . . . . . . . . . . . . . . . . . . . . . . . . . . . . . . . . . . . . . . . . . . . . . . . . . . . . . . . . . . . . . . . . 12,476,577 (23,467,035) — (251,597) (11,242,055) 35,440 11,952 $ 47,392 1,427,899 (2,808,730) (64,929) 350,254 (1,095,506) 6,516 2,864 $ 9,380 49,008,377 (72,068,067) — 33,677,065 10,617,375 – 76,109,147 $ 76,109,147 RECONCILIATION OF INCREASE/(DECREASE) IN NET ASSETS FROM OPERATIONS TO NET CASH FLOWS PROVIDED (USED) BY OPERATING ACTIVITIES: Increase/Decrease in Net Assets resulting from Operations . . . . Increase/Decrease in investments, at value . . . . . . . . . . . . . . . Increase/Decrease in payable for securities purchased . . . . . . . . . Increase/Decrease in receivable for securities sold . . . . . . . . . . . . Increase/Decrease in dividends and interest receivable . . . . . . . . . Increase/Decrease in unrealized appreciation (depreciation) on swaps Increase/Decrease in due from/to investment advisor . . . . . . . . . Increase/Decrease in prepaid expense . . . . . . . . . . . . . . . . . . Increase/Decrease in interest payable . . . . . . . . . . . . . . . . . . Increase/Decrease in dividends payable . . . . . . . . . . . . . . . . . Increase/Decrease in accrued expenses . . . . . . . . . . . . . . . . . Total Adjustments . . . . . . . . . . . . . . . . . . . . . . . . . . . . Net Cash Flows Provided (Used) By Operating Activities . . . . . . . . . . . . . . . . . . . . . . . . . . . . . . . . $ (1,013,163) 12,286,472 — — 128,330 (103,629) (16,815) 873 (2,100) — (2,473) 12,290,658 $ 11,277,495 $ $(10,833,548) 12,027,213 (8,761,900) (2,941,386) 329 — (45,447) 263 (25,393) (34,833) (2,673) 216,173 $(10,617,375) 382,234 (287,941) (1,629,823) 703,697 (72,886,453) 84,997,881 — — — — — (2,100) 11,277,495 $ 91,190 (123,435) (98,367) (10,033) (9,947,590) 11,530,385 (92,318) 92,454 (334,008) 5,314 — (11,570) 1,102,022 73,875 1,037,256 92,454 (92,318) 1,141 — (5,618) 78 — — (4,846) 1,028,147 $ 1,102,022 See accompanying Notes to Financial Statements. 143 $ 123,905 (2,510,483) 46,446,269 — — — (2,941,386) (8,761,900) (41,192,443) — (643,731) (1,137,606) (10,617,375)
148) ADVISORSHARES TRUST Financial Highlights AdvisorShares Accuvest Global Long Short ETF Year ended June 30, 2015 Selected Data for a Share of Capital Stock Outstanding Net Asset Value, Beginning of Period . . . . . . . Investment Operations Net Investment Income (Loss)(2) . . . . . . Net Realized and Unrealized Gain (Loss) . Net Increase (Decrease) in Net Assets Resulting from Investment Operations(4) . . . . . . . . . . . . . . Distributions from Net Investment Income Distributions from Realized Capital Gains . Total Distributions . . . . . . . . . . . . Net Asset Value, End of Period . . . . . . . . . . . . . . . . . . . . . . . . . . . . . . . . . . . Market Value, End of Period . . . . . . . . . . . . Total Return Total Investment Return Based on Net Asset Value(5) . . . . . . . . . . . . . . . . . . . Total Investment Return Based on Market(5) . . . Ratios/Supplemental Data Net Assets, End of Period (000’s omitted) . . . . . Ratio to Average Net Assets of: Expenses, net of expense waivers and reimbursements(6) . . . . . . . . . . . Expenses, prior to expense waivers and reimbursements(6) . . . . . . . . . . . Net Investment Income (Loss)(6) . . . . . Portfolio Turnover Rate(7) . . . . . . . . . Year ended June 30, 2014 Year ended June 30, 2013 Year ended June 30, 2012 For the period July 9, 2010* to June 30, 2011 $ 20.72 $ 21.83 $ 21.20 $ 20.86 $ 25.00 (0.02) (0.85) (0.08) (1.03) (0.87) — — — $ 19.85 (1.11) — — — $ 20.72 $ 19.85 $ 20.72 (4.20)% (4.20)% $13,892 (5.08)% (5.73)% $25,896 (0.34) 0.97 (0.68) 1.33 (0.67) (3.47) 0.63 — — — $ 21.83 0.65 (0.31) — (0.31) $ 21.20 (4.14) — — — $ 20.86 $ 21.98 $ 21.22 $ 20.86 2.97% 3.58% $42,573 3.15% 3.24% $18,022 (16.56)% (16.56)% $ 9,385 . . . . . 1.50% 1.73%(8) 3.96%(8) 5.77%(8) 3.10%(8) . . . . . . . . . . . . . . . 2.14% (0.09)% 379% 1.89%(8) (0.39)% 226% 4.25%(8) (1.57)% 270% 8.15%(8) (3.20)% 365% 3.33%(8) (2.82)% 751% See accompanying Notes to Financial Statements. 144
149) ADVISORSHARES TRUST Financial Highlights AdvisorShares Athena High Dividend ETF AdvisorShares EquityPro ETF For the period July 29, 2014* to June 30, 2015 Year ended June 30, 2015 Year ended June 30, 2014 For the period July 10, 2012* to June 30, 2013 $ 25.00 $ 32.11 $ 27.13 $ 25.00 1.24 4.08 0.22 2.06 0.90 (6.03) 0.39 (1.04) (5.13) (0.79) — (0.79) $ 19.08 (0.65) (0.28) (0.49) (0.77) $ 30.69 5.32 (0.34) — (0.34) $ 32.11 2.28 (0.13) (0.02) (0.15) $ 27.13 $ 19.08 $ 30.70 $ 32.11 $ 27.12 (20.71)% (20.65)% $15,265 (2.01)% (1.89)% $19,179 19.71% 19.76% $20,070 9.16% 9.11% $ 1,357 0.99% 1.25% 1.25% 1.25% 1.71% 4.60% 193% 1.13% 1.25% 349% 1.92% 4.13% 21% 6.95% 0.88% 43% See accompanying Notes to Financial Statements. 145
150) ADVISORSHARES TRUST Financial Highlights AdvisorShares Gartman Gold/Euro ETF (Consolidated) Year ended June 30, 2015 For the period February 11, 2014* to June 30, 2014 Selected Data for a Share of Capital Stock Outstanding Net Asset Value, Beginning of Period . . . . . . . . . . . . . . . . . . . . . . . . . . . . . $ 13.02 $12.80 Investment Operations Net Investment Income (Loss)(2) . . . . . . . . . . . . . . . . . . . . . Net Realized and Unrealized Gain . . . . . . . . . . . . . . . . . . . . Net Increase in Net Assets Resulting from Investment Operations(4) Distributions from Net Investment Income . . . . . . . . . . . . . . . Distributions from Realized Capital Gains . . . . . . . . . . . . . . . . Total Distributions . . . . . . . . . . . . . . . . . . . . . . . . . . . . Net Asset Value, End of Period . . . . . . . . . . . . . . . . . . . . . . (0.08) 0.97 0.89 (0.14) (0.63) (0.77) $ 13.14 (0.03) 0.25 0.22 — — — $13.02 $ 13.11 $13.07 . . . . . . . . . . . . . . . . . . . . . . . . . . . . . . . . . . . . . . . . . . . . . . . . . . . . . . . . . . . . . . . . . . . . . . Market Value, End of Period . . . . . . . . . . . . . . . . . . . . . . . . . . . . . . . . . . Total Return Total Investment Return Based on Net Asset Value(5) . . . . . . . . . . . . . . . . . . . . Total Investment Return Based on Market(5) . . . . . . . . . . . . . . . . . . . . . . . . . Ratios/Supplemental Data Net Assets, End of Period (000’s omitted) . . . . . . . . . . . . . . . . . . . . . . . . . . Ratio to Average Net Assets of: Expenses, net of expense waivers and reimbursements(6) . Expenses, prior to expense waivers and reimbursements(6) Net Investment Income (Loss)(6) . . . . . . . . . . . . . . . Portfolio Turnover Rate(7) . . . . . . . . . . . . . . . . . . . . . . . . . . . . . . . . . . . . . . . . . . . . . . . . . . . . . . . . . . . . . . . . . . . . . . . . . . . . . . . . . . . 7.33% 6.56% $16,758 0.65% 2.21% (0.63)% 0% See accompanying Notes to Financial Statements. 146 1.72% 2.11% $1,302 0.65% 10.72% (0.63)% 0%
151) ADVISORSHARES TRUST Financial Highlights AdvisorShares Gartman Gold/Yen ETF (Consolidated) AdvisorShares Global Echo ETF Year ended June 30, 2015 For the period February 11, 2014* to June 30, 2014 Year ended June 30, 2015 Year ended June 30, 2014 Year ended June 30, 2013 For the period May 23, 2012* to June 30, 2012 $ 12.94 $12.80 $61.44 $54.38 $50.80 $50.00 (0.08) 0.86 0.78 (0.04) (0.52) (0.56) $ 13.16 (0.03) 0.17 0.14 — — — $12.94 (0.06) 1.92 1.86 (0.43) — (0.43) $62.87 0.22 6.86 7.08 (0.02) — (0.02) $61.44 (0.07) 3.88 3.81 — (0.23) (0.23) $54.38 (0.02) 0.82 0.80 — — — $50.80 $ 13.19 $13.04 $62.28 $61.46 $54.53 $50.99 6.06% 5.45% $23,022 0.65% 1.99% (0.62)% 0% 1.09% 1.88% $3,881 0.65% 4.74% (0.63)% 0% 3.05% 2.06% $7,859 1.50% 1.50% (0.09)% 68% 13.03% 12.75% $9,216 1.50% 1.50% 0.37% 157% 7.54% 7.43% $5,438 1.50% 1.50% (0.13)% 180% See accompanying Notes to Financial Statements. 147 1.60% 1.98% $5,080 1.50% 1.50% (0.32)% 70%
152) ADVISORSHARES TRUST Financial Highlights AdvisorShares Madrona Domestic ETF Year ended June 30, 2015 Year ended June 30, 2014 Year ended June 30, 2013 Year ended June 30, 2012 For the period June 21, 2011* to June 30, 2011 $ 41.26 $ 32.34 $ 25.31 $ 26.07 $25.00 . . . . . . 0.13 2.30 0.11 8.91 0.15 7.01 . . . — — — Selected Data for a Share of Capital Stock Outstanding Net Asset Value, Beginning of Period . . . . . . . Investment Operations Net Investment Income(2) . . . . . . . . . . Net Realized and Unrealized Gain (Loss) . . Distributions of Net Realized Gains by other investment companies . . . . . . . . . . . Net Increase (Decrease) in Net Assets Resulting from Investment Operations(4) . . . . . . . . . . . . . . . Distributions from Net Investment Income . Distributions from Realized Capital Gains . . Total Distributions . . . . . . . . . . . . . Net Asset Value, End of Period . . . . . . . . . . . . . . . . . . . . . . . Market Value, End of Period . . . . . . . . . . . . Total Return Total Investment Return Based on Net Asset Value(5) . . . . . . . . . . . . . . . . . . . Total Investment Return Based on Market(5) . . . Ratios/Supplemental Data Net Assets, End of Period (000’s omitted) . . . . Ratio to Average Net Assets of: Expenses, net of expense waivers and reimbursements(6) . . . . . . . . . . . Expenses, prior to expense waivers and reimbursements(6) . . . . . . . . . . . Net Investment Income(6) . . . . . . . . Portfolio Turnover Rate(7) . . . . . . . . . 0.10 (0.79) — 0.00(3) 1.07 — 2.43 (0.14) — (0.14) $ 43.55 9.02 (0.10) — (0.10) $ 41.26 7.16 (0.13) — (0.13) $ 32.34 (0.69) (0.07) — (0.07) $ 25.31 1.07 — — — $26.07 $ 43.55 $ 41.26 $ 32.34 $ 25.28 $26.07 5.89% 5.89% $31,574 27.93% 27.93% $24,755 28.37% 28.52% $18,593 (2.65)% (2.76)% $15,188 4.28% 4.28% $2,607 . . . . . 1.25% 1.25% 1.25% 1.25% 1.25% . . . . . . . . . . . . . . . 1.37% 0.30% 15% 1.42% 0.31% 14% 1.61% 0.51% 33% 1.46% 0.40% 40% 10.96% 0.23% 0% See accompanying Notes to Financial Statements. 148
153) ADVISORSHARES TRUST Financial Highlights AdvisorShares Madrona Global Bond ETF Year ended Year ended Year ended Year ended June 30, June 30, June 30, June 30, 2015 2014 2013 2012 $ 26.36 0.74 (1.39) 0.04 $ 25.05 0.86 1.30 — $ 25.69 AdvisorShares Madrona International ETF For the period June 21, 2011* to June 30, 2011 $ 25.01 0.01 0.71 0.67 0.01 — — 0.72 (0.66) $25.00 — Year ended Year ended Year ended Year ended June 30, June 30, June 30, June 30, 2015 2014 2013 2012 $ 29.66 0.39 (1.92) — $ 23.97 $ 21.06 0.41 5.77 0.39 2.82 — — $ 26.17 0.32 (5.33) — For the period June 21, 2011* to June 30, 2011 $25.00 0.01 1.16 — (0.61) (0.78) — (0.78) $ 24.97 2.16 (0.85) — (0.85) $ 26.36 0.07 1.38 (0.71) (0.70) — (0.00)(3) (0.71) (0.70) $ 25.05 $ 25.69 0.01 — — — $25.01 (1.53) (0.47) — (0.47) $ 27.66 6.18 (0.49) — (0.49) $ 29.66 3.21 (0.30) — (0.30) $ 23.97 (5.01) (0.08) (0.02) (0.10) $ 21.06 1.17 — — — $26.17 $ 24.96 $ 26.42 $ 24.96 $25.02 $ 27.65 $ 29.58 $ 23.95 $ 21.11 $26.18 (2.37)% (2.63)% $28,096 8.80% 9.44% $24,383 $ 25.68 0.20% (0.13)% $22,543 5.59% 5.49% $21,195 0.04% 0.08% $2,501 (5.06)% (4.82)% $19,365 25.91% 25.64% $19,279 15.24% 14.86% $14,978 (19.11)% (18.95)% $14,219 4.68% 4.72% $2,617 0.95% 0.95% 0.95% 0.95% 0.95% 1.25% 1.25% 1.25% 1.25% 1.25% 0.99% 2.88% 34% 1.07% 3.36% 20% 1.02% 2.73% 28% 0.99% 2.81% 12% 11.08% 1.68% 0% 1.69% 1.41% 85% 1.55% 1.48% 182% 1.65% 1.65% 93% 1.54% 1.48% 110% 10.99% 1.14% 19% See accompanying Notes to Financial Statements. 149
154) ADVISORSHARES TRUST Financial Highlights AdvisorShares Meidell Tactical Advantage ETF Year ended June 30, 2015 Year ended June 30, 2014 Year ended June 30, 2013 Year ended June 30, 2012 For the period June 23, 2011* to June 30, 2011 $ 30.00 $ 28.33 $25.12 $25.06 $25.00 . . . . 0.17 0.87 0.14 1.53 0.14 3.30 . . — — — Selected Data for a Share of Capital Stock Outstanding Net Asset Value, Beginning of Period . . . . . . Investment Operations Net Investment Income(2) . . . . . . . . . . Net Realized and Unrealized Gain (Loss) . . Distributions of Net Realized Gains by other investment companies . . . . . . . . . . . Net Increase (Decrease) in Net Assets Resulting from Investment Operations(4) . . . . . . . . . . . . . . . Distributions from Net Investment Income . Distributions from Realized Capital Gains . . Total Distributions . . . . . . . . . . . . . Net Asset Value, End of Period . . . . . . . . . . . . . . . . . . Market Value, End of Period . . . . . . . . . . . Total Return Total Investment Return Based on Net Asset Value(5) . . . . . . . . . . . . . . . . . . Total Investment Return Based on Market(5) . . Ratios/Supplemental Data Net Assets, End of Period (000’s omitted) . . . . Ratio to Average Net Assets of: Expenses, net of expense waivers and reimbursements(6) . . . . . . . . . . Expenses, prior to expense waivers and reimbursements(6) . . . . . . . . . . Net Investment Income(6) . . . . . . . Portfolio Turnover Rate(7) . . . . . . . . 0.00(3) 0.08 — 0.01 0.05 — 1.04 (0.18) — (0.18) $ 30.86 1.67 — — — $ 30.00 3.44 (0.23) — (0.23) $28.33 0.08 (0.02) — (0.02) $25.12 0.06 — — — $25.06 $ 30.87 $ 30.00 $28.37 $25.48 $25.07 3.47% 3.52% $16,972 5.89% 5.75% $15,750 13.81% 12.33% $9,209 0.31% 1.71% $5,652 0.24% 0.28% $2,506 . . . . . 1.35% 1.35% 1.35% 1.35% 1.35% . . . . . . . . . . . . . . . 1.99% 0.57% 434% 2.12% 0.49% 687% 2.99% 0.51% 605% 3.69% 0.01% 817% 13.70% 1.00% 5% See accompanying Notes to Financial Statements. 150
155) ADVISORSHARES TRUST Financial Highlights AdvisorShares Morgan Creek Global Tactical ETF(1) Year ended June 30, 2015 Year ended June 30, 2014 Year ended June 30, 2013 $ 26.19 $ 23.78 $ 23.69 0.30 2.11 0.38 0.27 0.06 (1.06) 0.07 — 0.00(3) AdvisorShares Newfleet Multi-Sector Income ETF For the period October 26, 2010* Year ended to Year ended June 30, 2012 June 30, 2011 June 30, 2015 $ 25.92 0.21 (2.24) 2.41 — — — $ 26.19 0.65 (0.56) — (0.56) $ 23.78 (2.03) — (0.20) (0.20) $ 23.69 $ 24.60 $ 26.16 $ 23.79 $ 23.64 $12,309 10.13% 9.96% $36,667 2.68% 2.92% $49,942 (7.84)% (8.07)% $78,171 25.10 $ 0.25 0.79 — (0.93) (0.64) — (0.64) $ 24.62 (3.59)% (3.52)% $ $ $ 25.93 4.17% 4.20% $178,837 $ 1.28 (0.77) — 1.04 (0.22) — (0.22) 25.92 49.94 Year ended June 30, 2014 1.26 0.99 — $ 0.51 (1.37) — (1.37) 49.08 $ 49.04 1.04% 0.95% $215,941 49.04 — For the period March 19, 2013* to June 30, 2013 $ 50.00 0.28 (0.99) — $ 2.25 (1.35) — (1.35) 49.94 (0.71) (0.25) — (0.25) $ 49.04 $ 49.94 $ 49.01 4.65% 4.70% $154,811 (1.42)% (1.48)% $83,362 1.25% 1.25% 1.15% 0.99% 1.02% 0.75% 0.75% 0.75% 2.23% 0.23% 244% 1.24% 1.19% 232% 1.15% 1.54% 236% 1.08% 0.87% 475% 1.04% 1.45% 187% 0.82% 2.60% 49% 0.83% 2.55% 85% 1.13% 1.98% 105% See accompanying Notes to Financial Statements. 151
156) ADVISORSHARES TRUST Financial Highlights AdvisorShares Pacific Asset Enhanced Floating Rate ETF For the period February 18, 2015* to June 30, 2015 Selected Data for a Share of Capital Stock Outstanding Net Asset Value, Beginning of Period . . . . . . . . . . . . . . . . . . . . . . . . . . . . . . . . . . . . . . . . . . . $ 50.00 Investment Operations Net Investment Income (Loss)(2) . . . . . . . . . . . . . . . . . . . . . . . . . . . . Net Realized and Unrealized Gain (Loss) . . . . . . . . . . . . . . . . . . . . . . . . Distributions of Net Realized Gains by other investment companies . . . . . . . . Net Increase (Decrease) in Net Assets Resulting from Investment Operations(4) . Distributions from Net Investment Income . . . . . . . . . . . . . . . . . . . . . . Distributions from Realized Capital Gains . . . . . . . . . . . . . . . . . . . . . . . Total Distributions . . . . . . . . . . . . . . . . . . . . . . . . . . . . . . . . . . . Net Asset Value, End of Period . . . . . . . . . . . . . . . . . . . . . . . . . . . . . 0.62 (0.38) — 0.24 (0.58) — (0.58) $ 49.66 . . . . . . . . . . . . . . . . . . . . . . . . . . . . . . . . . . . . . . . . . . . . . . . . . . . . . . . . . . . . . . . . . . . . . . . . . . . . . . . . . . . . . . . . . . . . . . . . . . . . . . . . . . . . . . . . . . . . . . . . . . . . . . . . . . . . . . . . Market Value, End of Period . . . . . . . . . . . . . . . . . . . . . . . . . . . . . . . . . . . . . . . . . . . . . . . . Total Return Total Investment Return Based on Net Asset Value(5) . . . . . . . . . . . . . . . . . . . . . . . . . . . . . . . . . . Total Investment Return Based on Market(5) . . . . . . . . . . . . . . . . . . . . . . . . . . . . . . . . . . . . . . . Ratios/Supplemental Data Net Assets, End of Period (000’s omitted) . . . . . . . . . . . . . . . . . . . . . . . . . . . . . . . . . . . . . . . . Ratio to Average Net Assets of: Expenses, net of expense waivers and reimbursements(6) . Expenses, prior to expense waivers and reimbursements(6) Net Investment Income(6) . . . . . . . . . . . . . . . . . . . Portfolio Turnover Rate(7) . . . . . . . . . . . . . . . . . . . . . . . . . . . . . . . . . . . . . . . . . . . . . . . . . . . . . . . . . . . . . . . . . . . . . . . . . . . . . . . . . . . . . . . . . . . . . . . . . . . . . . . . . . . . . . . See accompanying Notes to Financial Statements. 152 . . . . . . . . . . . . . . . . . . . . . . . . . . . . $ 49.78 0.47% 0.71% $27,312 1.10% 1.41% 3.46% 102%
157) ADVISORSHARES TRUST Financial Highlights AdvisorShares Peritus High Yield ETF Year ended June 30, 2015 $ 53.27 Year ended June 30, 2014 $ 50.43 3.59 (12.33) — (8.74) (3.88) — (3.88) $ 40.65 $ 40.58 (16.82)% (16.88)% $375,991 1.23% 1.23% 7.65% 88% Year ended June 30, 2013 AdvisorShares Pring Turner Business Cycle ETF Year ended June 30, 2012 For the period December 1, 2010* to June 30, 2011 Year ended June 30, 2015 Year ended June 30, 2014 For the period December 18, 2012* to June 30, 2013 $ 48.59 $ 51.59 $ 50.00 $ 29.00 $25.46 $25.00 $ 4.14 2.69 — 6.83 (3.95) (0.04) (3.99) 53.27 $ 4.28 1.66 — 5.94 (4.09) (0.01) (4.10) 50.43 4.20 (2.74) 0.00(3) 1.46 (3.99) (0.47) (4.46) $ 48.59 2.25 1.30 — 3.55 (1.96) — (1.96) $ 51.59 0.28 (3.87) — (3.59) (0.31) — (0.31) $ 25.10 0.24 3.60 — 3.84 (0.30) — (0.30) $29.00 0.18 0.28 — 0.46 — — — $25.46 $ 53.27 $ 49.91 $ 48.64 $ 51.87 25.11 $29.04 $25.47 14.04% 15.20% $1,075,997 1.18% 1.18% 7.95% 87% 12.58% 11.29% $259,729 1.25% 1.23% 8.44% 37% 3.27% 2.75% $92,328 1.35% 1.35% 8.64% 80% 7.16% 7.73% $43,851 1.34% 1.57% 7.47% 81% (12.42)% (12.50)% $ 4,393 1.49% 3.20% 1.04% 73% See accompanying Notes to Financial Statements. 153 15.19% 15.30% $5,074 1.49% 2.55% 0.91% 35% 1.84% 1.88% $5,729 1.49% 4.70% 1.35% 26%
158) ADVISORSHARES TRUST Financial Highlights AdvisorShares QAM Equity Hedge ETF Year ended June 30, 2015 Selected Data for a Share of Capital Stock Outstanding Net Asset Value, Beginning of Period . . . . . . . . . . . . . . . . Investment Operations Net Investment Income (Loss)(2) . . . . . . . . . . . . . Net Realized and Unrealized Gain (Loss) . . . . . . . . . Distributions of Net Realized Gains by other investment companies . . . . . . . . . . . . . . . . . . . . . . . . Net Increase (Decrease) in Net Assets Resulting from Investment Operations(4) . . . . . . . . . . . . . . Distributions from Net Investment Income . . . . . . . Distributions from Realized Capital Gains . . . . . . . . Total Distributions . . . . . . . . . . . . . . . . . . . . Net Asset Value, End of Period . . . . . . . . . . . . . . Year ended June 30, 2014 For the period August 7, 2012* to June 30, 2013 $28.48 $26.21 $25.00 . . . . . . . . . . (0.13) 0.54 . . . . . 0.01 . . . . . . . . . . . . . . . . . . . . . . . . . Market Value, End of Period . . . . . . . . . . . . . . . . . . . . . Total Return Total Investment Return Based on Net Asset Value(5) . . . . . . . Total Investment Return Based on Market(5) . . . . . . . . . . . . Ratios/Supplemental Data Net Assets, End of Period (000’s omitted) . . . . . . . . . . . . . Ratio to Average Net Assets of: Expenses, net of expense waivers and reimbursements(6) . Expenses, prior to expense waivers and reimbursements(6) Net Investment Income (Loss)(6) . . . . . . . . . . . . . . . Portfolio Turnover Rate(7) . . . . . . . . . . . . . . . . . . . . . . . . . . . . . . . (0.20) 2.95 — (0.12) 1.51 — 0.42 — (0.22) (0.22) $28.68 2.75 — (0.48) (0.48) $28.48 1.39 (0.08) (0.10) (0.18) $26.21 $28.68 $28.45 $26.16 1.48% 1.60% $7,171 1.65%(9) 2.83%(9) (0.46)% 131% 10.52% 10.62% $8,543 1.70%(9) 2.66%(9) (0.71)% 179% See accompanying Notes to Financial Statements. 154 5.57% 5.36% $3,932 1.56%(9) 4.61%(9) (0.50)% 114%
159) ADVISORSHARES TRUST Financial Highlights AdvisorShares Ranger Equity Bear ETF Year ended June 30, 2015 $ 11.78 Year ended June 30, 2014 $ (0.31) (0.59) $ $ 10.88 (7.64)% (7.72)% $128,059 2.80%(10) 2.80%(10) (2.72)% 419% $ (0.38) (4.01) — (0.90) — — — 10.88 16.17 Year ended June 30, 2013 $ 11.79 $ $ (27.15)% (27.04)% $161,952 (7.16) — — — 16.17 16.16 (30.69)% (30.76)% $218,357 2.87%(10) 2.87%(10) (2.81)% 484% 3.12%(10) 3.12%(10) (3.11)% 697% 22.65 (0.72) 1.40 — (4.39) — — — 11.78 $ Year ended June 30, 2012 (0.60) (6.56) — $ 23.33 AdvisorShares Sage Core Reserves ETF — For the period January 27, 2011* to June 30, 2011 Year ended June 30, 2015 For the period January 14, 2014* to June 30, 2014 $ 25.00 $ 99.78 $100.00 (0.30) (2.05) — 0.12 (0.12) — 0.36 (0.25) — $ 0.68 — — — 23.33 (2.35) — — — $ 22.65 — (0.40) — (0.40) $ 99.38 0.11 (0.33) — (0.33) $ 99.78 $ 23.34 $ 22.65 $ 99.40 $ 99.80 3.00% 3.05% $313,223 3.07%(10) 3.06%(10) (3.06)% 756% (9.40)% (9.40)% $50,389 3.07%(10) 3.16%(10) (3.07)% 635% See accompanying Notes to Financial Statements. 155 (0.00)%(3) (0.00)%(3) $34,783 0.35% 0.73% 0.12% 59% 0.11% 0.13% $37,419 0.35% 0.73% 0.78% 12%
160) ADVISORSHARES TRUST Financial Highlights AdvisorShares STAR Global Buy-Write ETF Year ended June 30, 2015 Selected Data for a Share of Capital Stock Outstanding Net Asset Value, Beginning of Period . . . . . . . . . . . . . . . . Investment Operations Net Investment Income (Loss)(2) . . . . . . . . . . . . . Net Realized and Unrealized Gain (Loss) . . . . . . . . . Net Increase (Decrease) in Net Assets Resulting from Investment Operations(4) . . . . . . . . . . . . . . Distributions from Net Investment Income . . . . . . . Distributions from Realized Capital Gains . . . . . . . . Total Distributions . . . . . . . . . . . . . . . . . . . . Net Asset Value, End of Period . . . . . . . . . . . . . . . . . . . . . . . . . . . . . . . . . . . . . . . . . . . . Year ended June 30, 2014 For the period September 17, 2012* to June 30, 2013 $ 26.18 $ 23.61 $ 25.00 0.01 0.41 (0.10) 2.67 (0.03) (1.16) . . . . . 0.42 — — — $ 26.60 2.57 — — — $ 26.18 (1.19) (0.17) (0.03) (0.20) $ 23.61 Market Value, End of Period . . . . . . . . . . . . . . . . . . . . . $ 26.61 $ 26.22 $ 23.62 Total Return Total Investment Return Based on Net Asset Value(5) . . . . . . . Total Investment Return Based on Market(5) . . . . . . . . . . . . Ratios/Supplemental Data Net Assets, End of Period (000’s omitted) . . . . . . . . . . . . . Ratio to Average Net Assets of: Expenses, net of expense waivers and reimbursements(6) . Expenses, prior to expense waivers and reimbursements(6) Net Investment Income (Loss)(6) . . . . . . . . . . . . . . . Portfolio Turnover Rate(7) . . . . . . . . . . . . . . . . . . . . . . . . . . . . . . . 1.60% 1.49% $26,597 1.85% 1.87% 0.03% 45% 10.89% 11.01% $27,490 1.85% 1.79% (0.42)% 166% See accompanying Notes to Financial Statements. 156 (4.80)% (4.76)% $22,428 1.85% 2.35% (0.14)% 40%
161) ADVISORSHARES TRUST Financial Highlights AdvisorShares Sunrise Global Multi-Strategy ETF For the period July 8, 2014* to June 30, 2015 $25.00 AdvisorShares TrimTabs Float Shrink ETF Year ended June 30, 2013 For the period October 4, 2011* to June 30, 2012 41.05 $ 33.16 $26.20 0.42 5.75 0.43 9.89 0.23 7.99 0.07 6.90 $ 10.32 (0.15) — (0.15) 51.22 8.22 (0.21) (0.12) (0.33) $ 41.05 6.97 (0.01) — (0.01) $33.16 $ 51.25 $ 41.13 $33.24 Year ended June 30, 2015 $ (0.01) (0.62) 51.22 (0.63) (0.45) — (0.45) $23.92 $ 6.17 (0.34) — (0.34) 57.05 $23.90 $ 57.05 (2.58)% (2.61)% $1,794 1.75% 6.20% (0.02)% 203% 12.06% 11.99% $242,472 0.99% 1.11% 0.76% 52% Year ended June 30, 2014 $ 25.18% 25.00% $137,015 0.99% 1.16% 0.90% 7% 25.01% 24.96% $25,657 0.99% 1.90% 0.62% 57% See accompanying Notes to Financial Statements. 157 26.62% 26.93% $8,291 0.99% 2.34% 0.31% 201%
162) ADVISORSHARES TRUST Financial Highlights AdvisorShares WCM/BNY Mellon Focused Growth ADR ETF Year ended Year ended Year ended Year ended June 30, June 30, June 30, June 30, 2015 2014 2013 2012 Selected Data for a Share of Capital Stock Outstanding Net Asset Value, Beginning of Period . . . . Investment Operations Net Investment Income(2) . . . . . . . . . . . Net Realized and Unrealized Gain (Loss) . . . Distributions of Net Realized Gains by other investment companies . . . . . . . . . . . Net Increase (Decrease) in Net Assets Resulting from Investment Operations(4) . . . . . . . . . . . . . . . Distributions from Net Investment Income . Distributions from Realized Capital Gains . . Total Distributions . . . . . . . . . . . . . Net Asset Value, End of Period . . . . . . . . Market Value, End of Period . . . . . . . . . Total Return Total Investment Return Based on Net Asset Value(5) . . . . . . . . . . . . . . . . Total Investment Return Based on Market(5) Ratios/Supplemental Data Net Assets, End of Period (000’s omitted) . . Ratio to Average Net Assets of: Expenses, net of expense waivers and reimbursements(6) . . . . . . . . . . Expenses, prior to expense waivers and reimbursements(6) . . . . . . . . . . Net Investment Income(6) . . . . . . . . Portfolio Turnover Rate(7) . . . . . . . . * $ 38.95 0.34 (0.20) — 0.14 (0.23) — (0.23) $ 38.86 $ 38.77 0.36% 0.19% $15,543 $ 32.65 $ 28.72 0.18 6.29 0.11 3.99 — 0.00(3) 6.47 (0.17) — (0.17) $ 38.95 $ 38.93 19.85% 19.85% $12,660 4.10 (0.17) — (0.17) $ 32.65 $ 32.63 14.30% 14.29% $ 7,346 $31.46 For the period July 21, 2010* to June 30, 2011 AdvisorShares YieldPro ETF For the period Year March 4, ended 2014* to June 30, June 30, 2015 2014 $25.00 $ 25.28 0.07 (2.58) 0.15 6.40 — (2.51) (0.11) (0.12) (0.23) $28.72 $28.70 — 6.55 (0.09) — (0.09) $31.46 $31.58 (7.94)% (8.36)% $6,462 26.21% 26.69% $8,651 0.85 (2.07) 0.00(3) (1.22) (0.99) — (0.99) $ 23.07 $ 23.03 (4.92)% (5.20)% $34,598 $ 25.00 0.29 0.20 — 0.49 (0.21) — (0.21) $ 25.28 $ 25.31 1.95% 2.07% $72,035 . . . 1.25% 1.25% 1.25% 1.25% 1.25% 1.05% 1.07% . . . . . . . . . 1.63% 0.88% 27% 1.67% 0.50% 24% 2.52% 0.36% 38% 4.17% 0.24% 16% 3.04% 0.52% 34% 1.05% 3.49% 128% 1.07% 3.64% 8% Commencement of operations. (1) (2) (3) (4) Formerly known as, AdvisorShares Cambria Global Tactical ETF. Based on average shares outstanding. Amount represents less than $0.005 or 0.005%. The amount shown for a share distribution throughout the period may not correlate with the Statement of Operations for the period due to the timing of sales and repurchases of Fund Shares in relation to income earned and/or fluctuating fair value of the investments of the Fund. (5) Net asset value total investment return is calculated assuming an initial investment made at the net asset value at the beginning of the period, reinvestment of all dividends and distributions, if any, at net asset value during the period, and redemption on the last day of the period. Periods less than one year are not annualized. Market value total return is calculated assuming an initial investment made at the market value at the beginning of the period, reinvestment of all dividends and distributions at market value during the period, and sale at the market value on the last day of the period. (6) Ratios of periods of less than one year have been annualized. (7) Portfolio turnover rate is not annualized and excludes the value of portfolio securities received or delivered as in-kind creations or redemptions of the Fund’s capital shares. (8) The expense ratio includes interest and dividend expenses on short sales of 0.23%, 2.46%, 4.27%, and 1.60% for the periods ended June 30, 2014, June 30, 2013, June 30, 2012, and June 30, 2011, respectively. (9) The expense ratio includes interest and dividend expenses on short sales of 0.15%, 0.20%, and 0.06% for the periods ended June 30, 2015, June 30, 2014, and June 30, 2013, respectively. (10) The expense ratio includes interest and dividend expenses on short sales of 1.15%, 1.22%, 1.51%, 1.38%, and 1.28% for the periods ended June 30, 2015, June 30, 2014, June 30, 2013, June 30, 2012, and June 30, 2011, respectively. See accompanying Notes to Financial Statements. 158
163) ADVISORSHARES TRUST Notes to Financial Statements June 30, 2015 1. Organization AdvisorShares Trust (the ‘‘Trust’’) was organized as a Delaware statutory trust on July 30, 2007 and has authorized capital of unlimited shares. The Trust is an open-end management investment company, registered under the Investment Company Act of 1940, as amended (the ‘‘Act’’). The Trust is comprised of 23 active funds (the ‘‘Funds’’ or ‘‘ETFs’’ and individually, the ‘‘Fund’’ or ‘‘ETF’’): Ticker Fund AdvisorShares Accuvest Global Long Short ETF . . . . . . . . . AdvisorShares Athena High Dividend ETF . . . . . . . . . . . . . AdvisorShares EquityPro ETF . . . . . . . . . . . . . . . . . . . . . . . AdvisorShares Gartman Gold/Euro ETF . . . . . . . . . . . . . . . AdvisorShares Gartman Gold/Yen ETF . . . . . . . . . . . . . . . . AdvisorShares Global Echo ETF . . . . . . . . . . . . . . . . . . . . . AdvisorShares Madrona Domestic ETF . . . . . . . . . . . . . . . . AdvisorShares Madrona Global Bond ETF . . . . . . . . . . . . . AdvisorShares Madrona International ETF . . . . . . . . . . . . . AdvisorShares Meidell Tactical Advantage ETF . . . . . . . . . . AdvisorShares Morgan Creek Global Tactical ETF* . . . . . . . AdvisorShares Newfleet Multi-Sector Income ETF . . . . . . . . AdvisorShares Pacific Asset Enhanced Floating Rate ETF . . . AdvisorShares Peritus High Yield ETF . . . . . . . . . . . . . . . . . AdvisorShares Pring Turner Business Cycle ETF . . . . . . . . . AdvisorShares QAM Equity Hedge ETF . . . . . . . . . . . . . . . . AdvisorShares Ranger Equity Bear ETF . . . . . . . . . . . . . . . . AdvisorShares Sage Core Reserves ETF . . . . . . . . . . . . . . . . AdvisorShares STAR Global Buy-Write ETF . . . . . . . . . . . . . AdvisorShares Sunrise Global Multi-Strategy ETF . . . . . . . . AdvisorShares TrimTabs Float Shrink ETF . . . . . . . . . . . . . . AdvisorShares WCM/BNY Mellon Focused Growth ADR ETF AdvisorShares YieldPro ETF . . . . . . . . . . . . . . . . . . . . . . . . * . . . . . . . . . . . . . . . . . . . . . . . . . . . . . . . . . . . . . . . . . . . . . . . . . . . . . . . . . . . . . . . . . . . . . . . . . . . . . . . . . . . . . . . . . . . . Commencement of Operations AGLS DIVI EPRO GEUR GYEN GIVE FWDD FWDB FWDI MATH GTAA MINC FLRT HYLD DBIZ QEH HDGE HOLD VEGA MULT TTFS AADR YPRO July 9, 2010 July 29, 2014 July 10, 2012 February 11, 2014 February 11, 2014 May 23, 2012 June 21, 2011 June 21, 2011 June 21, 2011 June 23, 2011 October 26, 2010 March 19, 2013 February 18, 2015 December 1, 2010 December 18, 2012 August 7, 2012 January 27, 2011 January 14, 2014 September 17, 2012 July 8, 2014 October 4, 2011 July 21, 2010 March 4, 2014 Effective July 28, 2014, AdvisorShares Cambria Global Tactical ETF changed its name to AdvisorShares Morgan Creek Global Tactical ETF. AdvisorShares Accuvest Global Long Short ETF (‘‘Accuvest Global Long Short ETF’’) seeks average annual returns in excess of the total return of the MSCI World Index by investing in both long and short positions in Underlying ETFs that offer diversified exposure to global regions. The Fund may also use derivatives tied to the broad market indices when establishing net long and net short exposure on top of the core long/short portfolio. AdvisorShares Athena High Dividend ETF (‘‘Athena High Dividend ETF’’) seeks long-term capital appreciation. The Portfolio Manager uses a behavioral finance approach to identifying securities for DIVI’s portfolio. Stocks are screened and selected using the Portfolio Manager’s patented research. AdvisorShares EquityPro ETF (‘‘EquityPro ETF’’) is a broadly diversified global equity ETF which seeks long-term capital growth. EPRO utilizes a ‘‘top-down’’ thematic approach while employing a proprietary security selection process and from time to time will employ risk management techniques 159
164) ADVISORSHARES TRUST Notes to Financial Statements (Continued) June 30, 2015 1. Organization − (continued) to lower portfolio volatility and risk. The Portfolio Manager seeks to achieve this objective by investing primarily in other ETFs, individual stocks, and American Depositary Receipts (ADRs) that provide investment exposure to global equity markets and that meet certain selection criteria established by the Portfolio Manager. AdvisorShares Gartman Gold/Euro ETF (‘‘Gartman Gold/Euro ETF’’) seeks to provide positive returns by utilizing the European Union’s Euro to invest its assets in the gold market. GEUR offers investors an alternative method to invest in gold by financing gold purchases in liquid currencies other than the U.S. dollar. Euros are obtained through the sale of either exchange-traded currency futures or ‘‘over-the-counter’’ foreign exchange forward contracts. AdvisorShares Gartman Gold/Yen ETF (‘‘Gartman Gold/Yen ETF’’) seeks to provide positive returns by utilizing the Japanese yen to invest its assets in the gold market. GYEN offers investors an alternative method to invest in gold by financing gold purchases in liquid currencies other than the U.S. dollar. The Japanese yen is obtained through the sale of either exchange-traded currency futures or ‘‘over-the-counter’’ foreign exchange forward contracts. AdvisorShares Global Echo ETF (‘‘Global Echo ETF’’) seeks long-term capital appreciation with an emphasis on absolute (positive) returns and low sensitivity to traditional financial market indices, such as the S&P 500 Index, over a full market cycle. The Fund is a multi-manager, multi-strategy, broadly diversified, and actively managed ETF with a focus on sustainable investing. AdvisorShares Madrona Domestic ETF (‘‘Madrona Domestic ETF’’) seeks to provide long-term capital appreciation above the capital appreciation of its benchmark, the S&P 500 Index by selecting a portfolio of up to 500 of the largest U.S. traded equity securities using a weighted allocation system based on consensus analyst estimates of the present value of future expected earnings relative to the share price of each security. AdvisorShares Madrona Global Bond ETF (‘‘Madrona Global Bond ETF’’) seeks investment results that exceed the price and yield performance of its benchmark, the Barclays Capital Aggregate Bond Index. The Portfolio Manager seeks to achieve this objective by selecting a diversified portfolio of fixed income exchange-traded products (ETPs), including but not limited to, exchange-traded notes (ETNs), exchange-traded currency trusts and exchange-traded commodity pools. FWDB invests in at least 12 distinct global bond classes that cover the entire global investable bond universe. The Portfolio Manager constructs FWDB’s portfolio using a weighted allocation system based on historic yield curve analysis and a mean reversion strategy. AdvisorShares Madrona International ETF (‘‘Madrona International ETF’’) seeks to provide long-term capital appreciation above the capital appreciation of its international benchmarks, such as the MSCI EAFE Index, the Fund’s primary benchmark, and the BNY Mellon Classic ADR Index, the Fund’s secondary benchmark. The Fund seeks to achieve this objective by selecting a portfolio primarily composed of at least 250 of the largest American Depositary Receipts (ADRs) from among the largest issuers of Europe, Australasia and the Far East (EAFE) and Canada. Its portfolio may also include ADRs that provide exposure to certain markets deemed to be emerging markets. AdvisorShares Meidell Tactical Advantage ETF (‘‘Meidell Tactical Advantage ETF’’) seeks to provide long-term capital appreciation and capital preservation. The Fund is considered a ‘‘fund-of-funds’’ that seeks to achieve this investment objective by managing a tactical strategy that has the ability to dynamically rebalance the Fund’s portfolio from as much as 100% equity assets to 100% fixed income assets or cash and cash equivalents depending on market trends. The Fund employs a long tactical strategy that seeks to minimize portfolio losses by rotating out of higher volatility assets and lower volatility assets depending on the Fund’s current view of risks in different asset classes. 160
165) ADVISORSHARES TRUST Notes to Financial Statements (Continued) June 30, 2015 1. Organization − (continued) AdvisorShares Morgan Creek Global Tactical ETF (‘‘Morgan Creek Global Tactical ETF’’) seeks to preserve and grow capital from investments in the U.S. and foreign equity, fixed income, commodity and currency markets, independent of market direction. The Portfolio Manager seeks to achieve GTAA’s objective by utilizing a combination a qualitative and quantitative approaches with established risk management controls to actively manage the portfolio in an attempt to control the downside losses and protect capital. AdvisorShares Newfleet Multi-Sector Income ETF (‘‘Newfleet Multi-Sector Income ETF’’) seeks to provide current income consistent with preservation of capital, while limiting fluctuations in net asset value (‘‘NAV’’) due to changes in interest rates. In seeking to achieve the Fund’s investment objective, the Sub-Advisor applies a time-tested approach and extensive credit research to capitalize on opportunities across undervalued areas of the bond markets. The Fund principally invests in investment-grade securities, which are securities with credit ratings within the four highest rating categories of a nationally recognized statistical rating organization or, if unrated, those securities that the Sub-Advisor determines to be of comparable quality. AdvisorShares Pacific Asset Enhanced Floating Rate ETF (‘‘Pacific Asset Enhanced Floating Rate ETF’’) seeks to provide a high level of current income. The fund seeks to achieve its investment objective by selecting a focused portfolio comprised primarily of income producing floating rate loans and floating rate debt securities. Under normal circumstances, it will invest at least 80% of its net assets (plus any borrowings for investment purposes) in floating rate loans and other floating rate debt securities and in derivatives or other instruments that have economic characteristics similar to such securities (such as swap agreements, including, but not limited to, total return swaps, credit default swaps, and interest rate swaps). AdvisorShares Peritus High Yield ETF (‘‘Peritus High Yield ETF’’) seeks high current income by investing in a focused portfolio of high yield debt securities commonly referred to as ‘‘junk bonds’’. The Fund does not have any portfolio maturity limitation and may invest in instruments with short-term, medium-term or long-term maturities. AdvisorShares Pring Turner Business Cycle ETF (‘‘Pring Turner Business Cycle ETF’’) seeks long-term growth from capital appreciation and income. The cornerstone of the Portfolio Manager’s investment philosophy rests on the core belief of building wealth consistently while minimizing portfolio risk. DBIZ is a multi-asset class fund that dynamically allocates among stock, bond, inflation-sensitive securities, and cash. The Portfolio Manager has developed a pro-active asset allocation and sector rotation process designed around the stage changes in the business cycle. DBIZ’s disciplined decision-making employs multiple layers of input including business cycle, fundamental, and technical analysis. This adaptive approach combines continuous asset allocation changes, diversification with careful sector selections, and income emphasis. AdvisorShares QAM Equity Hedge ETF (‘‘QAM Equity Hedge ETF’’) seeks investment results that exceed the risk adjusted performance of approximately 50% of the long/short equity hedge fund universe as defined by the HFRI Equity Hedge Total Index constituents. The Portfolio Manager seeks to achieve this objective by employing an actively managed long/short equity strategy that attempts to gain global net equity exposures that approximate those of the universe of managers in the HFRI Equity Hedge Total Index. Additionally, the Portfolio Manager utilizes advanced algorithms including Markov Processes International’s (MPI) proprietary and patented style analysis technique and associated algorithms, DSA (Dynamic Style Analysis), patented hedge fund analysis software, combined with the Portfolio Manager’s qualitative knowledge of the hedge fund investor community to develop investment strategies. 161
166) ADVISORSHARES TRUST Notes to Financial Statements (Continued) June 30, 2015 1. Organization − (continued) AdvisorShares Ranger Equity Bear ETF (‘‘Ranger Equity Bear ETF’’) seeks capital appreciation through short sales of domestically traded equity securities. The portfolio management team implements a bottom-up, fundamental, research driven security selection process. In selecting short positions, the Fund seeks to identify securities with low earnings quality or aggressive accounting which may be intended on the part of company management to mask operational deterioration and bolster the reported earnings per share over a short time period. In addition, the portfolio management team seeks to identify earnings driven events that may act as a catalyst to the price decline of a security, such as downwards earnings revisions or reduced forward guidance. AdvisorShares Sage Core Reserves ETF (‘‘Sage Core Reserves ETF’’) seeks to preserve capital while maximizing income. The Sub-Advisor seeks to achieve the fund’s investment objective by investing in a variety of fixed income securities, including bonds, forwards and instruments issued by U.S. and foreign issuers. It will invest in U.S. dollar-denominated investment grade debt securities, including mortgage- or asset-backed securities, rated Baa- or higher by Moody’s Investors Service, Inc. (‘‘Moody’s’’), or equivalently rated by Standard & Poor’s Ratings Services (‘‘S&P’’) or Fitch, Inc. (‘‘Fitch’’), or, if unrated, determined by the Sub-Advisor to be of comparable quality. AdvisorShares STAR Global Buy-Write ETF (‘‘STAR Global Buy-Write ETF’’) seeks consistent repeatable returns across all market cycles. The Portfolio Manager seeks to achieve this investment objective by using a proprietary strategy known as Volatility Enhanced Global Appreciation (VEGA). VEGA employs a ‘‘Buy-Write’’ or ‘‘Covered Call’’ overlay for their global allocation strategy using ETPs. The strategy simultaneously writes (sells) a call option against each position in order to seek cumulative price appreciation from the portfolio’s global exposure, while generating a consistent income stream from the sale of covered call and/or cash-secured put options. When volatility is low the portfolio manager buys protective put options to manage downside risk. AdvisorShares Sunrise Global Multi-Strategy ETF (‘‘Sunrise Global Multi-Strategy ETF’’) seeks to provide long-term total returns by investing long and short in a variety of asset classes and investment strategies. The Portfolio Manager seeks to achieve MULT’s objective by tactically investing, both long and short, in global equity, bond, currency and commodity markets as opportunities arise within those markets. AdvisorShares TrimTabs Float Shrink ETF (‘‘TrimTabs Float Shrink ETF’’) seeks to generate long-term returns in excess of the total return of the Russell 3000௡ Index, with less volatility than the Russell 3000௡ Index. The Fund is an actively managed exchange-traded fund that seeks to achieve its investment objective by primarily investing in the broad U.S. equity market, as represented by the Russell 3000௡ Index. The Fund seeks to achieve this goal by investing in stocks with liquidity and fundamental characteristics that are historically associated with superior long-term performance. AdvisorShares WCM/BNY Mellon Focused Growth ADR ETF (‘‘WCM/BNY Mellon Focused Growth ADR ETF’’) seeks long-term capital appreciation by investing primarily in other Underlying ETFs, American Depository Receipts (ADRs) included in the BNY Mellon Classic ADR Index, the Fund’s primary index, and swap contracts. AdvisorShares YieldPro ETF (‘‘YieldPro ETF’’) seeks to provide current income and capital appreciation. The fund is considered a ‘‘fund of funds’’ that seeks to achieve its investment objective by primarily investing in both long and short positions in other affiliated and unaffiliated exchange traded funds (‘‘ETFs’’) that offer diversified exposure to fixed income and other income producing securities. It may also invest in equity, inverse or other types of ETFs to supplement its fixed income ETF positions. The fund intends to invest the majority of its assets in investments that provide a competitive yield on a risk-adjusted basis. 162
167) ADVISORSHARES TRUST Notes to Financial Statements (Continued) June 30, 2015 2. Consolidation of Subsidiaries The Consolidated Schedules of Investments; Consolidated Statements of Assets and Liabilities, of Operations and of Changes in Net Assets; and the Consolidated Financial Highlights of the ETFs listed below include the accounts of wholly owned subsidiaries. All inter-company accounts and transactions have been eliminated in consolidation. Funds Wholly Owned Subsidiary Gartman Gold/Euro ETF . . . . . . . . . . . . . . . . . . . . . Gartman Gold/Yen ETF . . . . . . . . . . . . . . . . . . . . . . AdvisorShares Gartman Gold/Euro CFC AdvisorShares Gartman Gold/Yen CFC A summary of each ETF’s investment in its corresponding subsidiary is as follows: Inception Date of Subsidiary Subsidiary Net Assets at June 30, 2015 February 11, 2014 February 11, 2014 $2,502,550 4,052,733 Funds Gartman Gold/Euro ETF . . . . . . . . . . . . . . . Gartman Gold/Yen ETF . . . . . . . . . . . . . . . . % of ETF’s Total Net Assets at June 30, 2015 14.9% 17.6 3. Summary of Significant Accounting Policies These financial statements are prepared in accordance with U.S. generally accepted accounting principles (‘‘GAAP’’) which require management to make estimates and assumptions that affect the reported amounts of assets and liabilities and disclosures of contingent assets and liabilities at the date of the financial statements and the reported amounts of increases and decreases in net assets from operations during the reporting period. Actual results could differ from those estimates. Investment Valuation In computing each Fund’s NAV, the Fund’s securities holdings are valued based on their last readily available market price. Price information on listed securities, including Underlying ETFs, is taken from the exchange where the security is primarily traded. Securities regularly traded in an OTC market are valued at the latest quoted sales price on the primary exchange or national securities market on which such securities are traded. Securities not listed on an exchange or national securities market, or securities in which there was no last reported sales price, are valued at the most recent bid price. Other portfolio securities and assets for which market quotations are not readily available are valued based on fair value as determined in good faith by the Board of Trustees of the Trust. Investment Transactions Investment transactions are accounted for on the trade date. Realized gains and losses on sales of investment securities are calculated using the identified cost method. Dividend income and distributions to shareholders are recognized on the ex-dividend date and interest income and expenses are recognized on the accrual basis. Premiums and discounts are amortized over the life of the bond using the effective interest method. Expenses Expenses of the Trust, which are directly identifiable to a specific Fund, are applied to that Fund. Expenses which are not readily identifiable to a specific Fund are allocated in such a manner as deemed equitable, taking into consideration the nature and type of expense and the relative net assets of each Fund. 163
168) ADVISORSHARES TRUST Notes to Financial Statements (Continued) June 30, 2015 3. Summary of Significant Accounting Policies − (continued) Swap Agreements Certain funds may invest in equity swaps to obtain exposure to the underlying referenced security, obtain leverage or enjoy the returns from ownership without actually owning equity. Equity swaps are two-party contracts that generally obligate one party to pay the positive return and the other party to pay the negative return on a specified reference security, basket of securities, security index or index component during the period of the swap. Equity swap contracts are marked to market daily based on the value of the underlying security and the change, if any, is recorded as an unrealized gain or loss. Equity swaps normally do not involve the delivery of securities or other underlying assets. Accordingly, the risk of loss with respect to equity swaps is normally limited to the net amount of payments that a Fund is contractually obligated to make. If the other party to an equity swap defaults a Fund’s risk of loss consists of the net amount of payments that the Fund is contractually entitled to receive, if any. Equity swaps are derivatives and their value can be very volatile. To the extent that the Adviser or Sub-Adviser, as applicable, do not accurately analyze and predict future market trends, the values of assets or economic factors, the Funds may suffer a loss, which may be substantial. The swap markets in which many types of swap transactions are traded have grown substantially in recent years, with a large number of banks and investment banking firms acting both as principals and as agents. As a result, the markets for certain types of swaps have become relatively liquid. Periodic payments received or paid by the Funds are recorded as realized gains or losses. Repurchase Agreements The Funds may enter into repurchase agreements provided that the value of the underlying collateral, including accrued interest, will equal or exceed the value of the repurchase agreement during the term of the agreement. The underlying collateral for all repurchase agreements is held in safekeeping by the Fund’s custodian or at the Federal Reserve Bank. If the seller defaults and the value of the collateral declines, or if bankruptcy proceedings commence with respect to the seller of the security, realization of the collateral by the Fund may be delayed or limited. At June 30, 2015 the market values of repurchase agreements outstanding are included as cash collateral for securities on loan on the Statements of Assets and Liabilities. Short Sales Certain Funds may sell securities it does not own as a hedge against some of its long positions and/or in anticipation of a decline in the market value of that security (short sale). When the Funds make a short sale, it must borrow the security sold short and deliver it to the broker-dealer through which it made the short sale. The Funds may have to pay a fee to borrow the particular security and may be obligated to remit any interest or dividends received on such borrowed securities. Dividends declared on short positions open are recorded on the ex-date as an expense. A gain, limited to the price at which the Funds sold the security short, or a loss, unlimited in magnitude, will be recognized upon the termination of a short sale if the market price at termination is less than or greater than, respectively, the proceeds originally received. The Funds are also subject to the risk that it may be unable to reacquire a security to terminate a short position except at a price substantially in excess of the last quoted price. 164
169) ADVISORSHARES TRUST Notes to Financial Statements (Continued) June 30, 2015 3. Summary of Significant Accounting Policies − (continued) The Funds are required to pledge cash or securities to the broker as collateral for the securities sold short. Collateral requirements are calculated daily based on the current market value of the short positions. Cash deposited with broker for collateral for securities sold short is recorded as an asset on the Statements of Assets and Liabilities and securities segregated as collateral are denoted in the Schedule of Investments. The Funds may receive or pay the net of the following amounts: (i) a portion of the income from the investment of cash collateral; (ii) the broker’s fee on the borrowed securities; and (iii) a financing charge for the difference in the market value of the short position and cash collateral deposited with the broker. This income or fee is calculated daily based upon the market value of each borrowed security and a variable rate that is dependent on the availability of the security. The net amounts of income or fees paid by QAM Equity Hedge ETF and Ranger Equity Bear ETF for the year ended June 30, 2015 are $11,570 and $1,112,213, respectively, which are included as Interest on Securities Sold Short, Not Yet Purchased in the Statements of Operations. Deposits with brokers and segregated cash for securities sold short represent cash balances on deposit with the Funds’ prime brokers and custodian. The Funds are subject to credit risk should the prime brokers be unable to meet its obligations to the Funds. Futures Contracts Certain Funds may invest in futures contracts (‘‘futures’’), may invest in futures in order to hedge its investments against fluctuations in value caused by changes in prevailing interest rates or market conditions. Such Funds may invest in futures as a primary investment strategy. Investments in futures may increase or leverage exposure to a particular market risk, thereby increasing price volatility of derivative instruments a Fund holds. No monies are paid or received by a Fund upon the purchase or sale of a futures contract. Initially, a Fund will be required to deposit with the broker an amount of cash or cash equivalents, known as initial margin, based on the value of the contract. Subsequent payments, called variation margin, to and from the broker, will be made on a daily basis as the price of the underlying instruments fluctuates, making the long and short positions in the futures contract more or less valuable, a process known as ‘marking-to-the-market.’ Once a final determination of variation margin is made, additional cash is required to be paid by or released to a Fund, and a Fund will realize a loss or gain. The Funds may be subject to the risk that the change in the value of the futures contract may not correlate perfectly with the underlying index. Use of long futures contracts subjects the Funds to risk of loss in excess of the amounts shown on the Statements of Assets and Liabilities, up to the notional value of the futures contracts. Use of short futures contracts subjects the Funds to unlimited risk of loss. The Funds may enter into futures contracts only on exchanges or boards of trade. The exchange or board of trade acts as the counterparty to each futures contract; therefore, the Funds’ credit risk is limited to failure of the exchange or board of trade. Under some circumstances, futures exchanges may establish daily limits on the amount that the price of a futures contract can vary from the previous day’s settlement price, which could effectively prevent liquidation of unfavorable positions. Options Certain Funds are authorized to write and purchase put and call options. When a Fund writes an option, an amount equal to the premium received by the Fund is reflected as an asset and an equivalent liability. The amount of the liability is subsequently marked to market to reflect the current market value of the option written. When a security is purchased or sold through an exercise of an option, the related premium paid (or received) is added to (or deducted from) the basis of the security acquired or deducted from (or added to) the proceeds of the security sold. When an option expires (or the Fund enters into a closing transaction), the Fund realizes a gain or loss on the option to the extent of the premiums received or paid (or gain or loss to the extent the cost of the closing transaction 165
170) ADVISORSHARES TRUST Notes to Financial Statements (Continued) June 30, 2015 3. Summary of Significant Accounting Policies − (continued) exceeds the premium paid or received). The Fund, as writer of an option, bears the market risk of an unfavorable change in the price of the security underlying the written option. Written and purchased options are non-income producing investments. Short-Term Investments Each Fund may invest in high-quality short-term debt securities and money market instruments on an ongoing basis to maintain liquidity or pending selection of investments in accordance with its policies. These short-term debt securities and money market instruments include shares of other mutual funds, commercial paper, certificates of deposit, bankers’ acceptances, U.S. Government securities and repurchase agreements. Securities Lending The Funds participate in a securities lending program offered by The Bank of New York Mellon (‘‘BNYM’’) (the ‘‘Program’’), providing for the lending of securities to qualified brokers. Securities lending income includes earnings of such temporary cash investments, plus or minus any rebate to a borrower. These earnings (after any rebate) are then divided between BNYM, as a fee for its services under the Program, and the Funds, according to agreed-upon rates. Collateral on all securities loaned is accepted in cash and is maintained at a minimum level of 102% (105% in the case of certain foreign securities) of the market value, plus interest, if applicable, of investments on loan. It is the Fund’s policy to obtain additional collateral from or return excess collateral to the borrower by the end of the next business day, following the valuation date of the securities loaned. Therefore, the value of the collateral held may be temporarily less than the value of the securities on loan. Lending securities entails a risk of loss to the Funds if and to the extent that the market value of the securities loaned were to increase and the borrower did not increase the collateral accordingly, and the borrower fails to return the securities. Under the terms of the Program, the Funds are indemnified for such losses by BNYM. Cash collateral is held in a separate account managed by BNYM, who is authorized to exclusively enter into overnight repurchase agreements. BNYM bears the risk of any deficiency in the amount of the cash collateral available for return to the borrower due to any loss on the collateral invested. The repurchase agreement income related to the Program earned by the Funds is disclosed on the Statements of Operations. 166
171) ADVISORSHARES TRUST Notes to Financial Statements (Continued) June 30, 2015 3. Summary of Significant Accounting Policies − (continued) The value of loaned securities and related collateral outstanding at June 30, 2015 are shown in the Schedules of Investments and Statements of Assets and Liabilities. Liabilities: Fund Description Accuvest Global Long Short ETF . . . . . . Athena High Dividend ETF . . . . . . . . . . EquityPro ETF . . . . . Global Echo ETF . . . . Madrona Domestic ETF . . . . . . . . . . Madrona Global Bond ETF . . . . . . . . . . Madrona International ETF . . . . . . . . . . Meidell Tactical Advantage ETF . . . Morgan Creek Global Tactical ETF . . . . . Newfleet Multi-Sector Income ETF . . . . . Pacific Asset Enhanced Floating Rate ETF . . Peritus High Yield ETF . . . . . . . . . . Pring Turner Business Cycle ETF . . . . . . Sage Core Reserves ETF . . . . . . . . . . TrimTabs Float Shrink ETF . . . . . . . . . . WCM/BNY Mellon Focused Growth ADR ETF . . . . . . . * (1) Swaps Gross Amounts of Recognized Assets (Liabilities) Financial Instruments Net Amount Repurchase Agreements Repurchase Agreements Repurchase Agreements 2,000,530 2,357,879 179,836 — — — 2,000,530 2,357,879 179,836 2,000,530* 2,357,879* 179,836* 2,040,543 2,405,039 290,632(1) — — — Repurchase Agreements 769,212 — 769,212 769,212* 944,309(1) — Repurchase Agreements 8,327,697 — 8,327,697 8,327,697* 8,494,258 — Repurchase Agreements 2,436,360 — 2,436,360 2,436,360* 2,485,088 — Repurchase Agreements 4,117,585 — 4,117,585 4,117,585* 4,199,940 — Repurchase Agreements 1,842,084 — 1,842,084 1,842,084* 1,878,928 — Repurchase Agreements 753,918 — 753,918 753,918* 1,427,082(1) — — 134,658 $ Collateral Pledged/ Received $ — (2,712) $ Gross Amounts not offset in the Statements of Assets and Liabilities 134,658 Swaps $ Gross Net Amounts Amounts Presented Offset in the in the Statements Statements of Financial of Financial Position Position (2,712) 134,658 $ 5,615,680 (2,712) $ — — 51,883,351* 59,886,589(1) — — Repurchase Agreements 51,883,351 — 51,883,351 Repurchase Agreements 350,292 — 350,292 350,292* 357,298 — Repurchase Agreements 265,875 — 265,875 265,875* 271,192 — Repurchase Agreements 759,509 — 759,509 759,509* 3,086,234(1) — Repurchase Agreements 2,440,719 — 2,440,719 2,440,719* 2,489,536 — Collateral for securities on loan included in the Schedules of Investments. Includes the value of securities received as collateral which are not shown on the Statements of Assets and Liabilities because the Fund does not have the right to sell or repledge the securities received as collateral. Dividends and Distributions Each Fund will generally pay out dividends to shareholders at least annually. Each Fund will distribute its net capital gains, if any, to shareholders annually. Income and capital gain distributions are determined in accordance with income tax regulations which may differ from U.S. generally accepted accounting principles. Distributions are recorded on ex-dividend date. Indemnifications In the normal course of business, each Fund enters into contracts that contain a variety of representations which provide general indemnifications. The Trust’s maximum exposure under these arrangements cannot be known; however, the Trust expects any risk of loss to be remote. 167
172) ADVISORSHARES TRUST Notes to Financial Statements (Continued) June 30, 2015 4. Investment Advisory Agreement and Other Agreements Investment Advisory Agreement Each Fund has entered into an investment advisory agreement with AdvisorShares Investments, LLC (the ‘‘Advisor’’) pursuant to which the Advisor acts as the Fund’s investment adviser. Pursuant to the agreement, the Advisor has overall supervisory responsibility for the general management and investment of each Fund’s securities portfolio, and has ultimate responsibility (subject to oversight by the Trust’s Board of Trustees) for oversight of the Trust’s sub-advisers. For its services, each Fund pays the Advisor an annual management fee and which is calculated daily and paid monthly based on average daily net assets. From time to time, the Advisor may waive all or a portion of its fee. The Advisor’s annual management fee for each Fund is as follows: Fund: Rate: Accuvest Global Long Short ETF . . . . . . . . . Athena High Dividend ETF . . . . . . . . . . . . . . EquityPro ETF . . . . . . . . . . . . . . . . . . . . . . . Gartman Gold/Euro ETF . . . . . . . . . . . . . . . Gartman Gold/Yen ETF . . . . . . . . . . . . . . . . Global Echo ETF . . . . . . . . . . . . . . . . . . . . . Madrona Domestic ETF . . . . . . . . . . . . . . . . Madrona Global Bond ETF . . . . . . . . . . . . . Madrona International ETF . . . . . . . . . . . . . Meidell Tactical Advantage ETF . . . . . . . . . . Morgan Creek Global Tactical ETF $0 − $250,000,000 . . . . . . . . . . . . . . . . . $250,000,001 − $1,000,000,000 . . . . . . . $1,000,000,001 − $5,000,000,000 . . . . . $5,000,000,001 + . . . . . . . . . . . . . . . . . . Newfleet Multi-Sector Income ETF . . . . . . . . Pacific Asset Enhanced Floating Rate ETF . . . Peritus High Yield ETF . . . . . . . . . . . . . . . . . Pring Turner Business Cycle ETF . . . . . . . . . . QAM Equity Hedge ETF . . . . . . . . . . . . . . . . Ranger Equity Bear ETF . . . . . . . . . . . . . . . . Sage Core Reserves ETF . . . . . . . . . . . . . . . . STAR Global Buy-Write ETF . . . . . . . . . . . . . Sunrise Global Multi-Strategy ETF . . . . . . . . TrimTabs Float Shrink ETF . . . . . . . . . . . . . . WCM/BNY Mellon Focused Growth ADR ETF YieldPro ETF . . . . . . . . . . . . . . . . . . . . . . . . . . . . . . . . . . . . . . . . . . . . . . . . . . . . . . . . . . . . . . . . . . . . . . . . . . . . . . . . . . . . . . . . . . . . . . . . . . . . . . . . . . . . . . . . . . . . . . . . . . . . . . . . . . . . . . . . . . . . . . . . . . . . . . . . . . . . . . . . . . . . . . . . . . . . . . . . . . . . . . . . . . . . . . . . . . . . . . . . . . . . . . . . . . . . . . . . . . . . . . . . . . . . . . . . . . . . . . . . . . . . . . . . . . . . . . . . . . . . . . . . . . . . . . . . . . . . . . . . . . . . . . . . . . . . . . 1.35% 0.80% 0.80% 0.55% 0.55% 1.10% 0.80% 0.50% 0.80% 1.20% . . . . . . . . . . . . . . . . . . . . . . . . . . . . . . . . . . . . . . . . . . . . . . . . . . . . . . . . . . . . . . . . . . . . . . . . . . . . . . . . . . . . . . . . . . . . . . . . . . . . . . . . . . . . . . . . . . . . . . . . . . . . . . . . . . . . . . . . . . . . . . . . . . . . . . . . . . . . . . . . . . . . . . . . . . . . . . . . . . . . . . . . . . . . . . . . . . . . . . . . . . . . . . . . . . . . . . . . . . . . . . . . . . . . . . . . . . . . . . . . . . . . . . . . . . . . . . . . . . . . . . . . . . . . . . . . . . . . . . . . . . . . . . . . . . . . . . . . . . . . . . . . . . . . . . . . . . . . . . . . . . . . . . . . . . . . . . . . . . . . . . . . . . . . . . . . . . . . . . . . . . . . . . . . . . . . . . . . . . . . . . . . . . . . . . . . . . . . . . . . . . . . . . . . . . . . . . . . . . . . . . . . . . . . . . . . 0.90% 0.80% 0.70% 0.60% 0.65% 0.95% 1.10% 1.00% 1.00% 1.50% 0.30% 1.35% 1.50% 0.99% 0.75% 0.80% For the Global Echo Fund, as part of its agreement with the Trust, the Advisor has contractually agreed to pay all operating expenses of the Fund, including transfer agency, custody, fund administration, legal, audit and other services, except management fees, interest expense, taxes (expected to be de minimis), brokerage commissions and other expenses connected with the execution of portfolio transactions, acquired fund fees and expenses, short dividend expenses, expenses of Independent Trustees (including any Trustees’ counsel fees), and extraordinary expenses. 168
173) ADVISORSHARES TRUST Notes to Financial Statements (Continued) June 30, 2015 4. Investment Advisory Agreement and Other Agreements − (continued) Sub-Advisory Agreements Each Fund’s investment sub-advisor provides investment advice and management services to the Fund. AdvisorShares supervises the day-to-day investment and reinvestment of the assets in the Fund and is responsible for monitoring the Fund’s adherence to its investment mandate. Pursuant to an investment sub-advisory agreement between each sub-advisor and the Advisor, the sub-advisor receives an annual fee. From time to time, each sub-advisor may waive all or a portion of its fee. Expense Limitation Agreement The Advisor has contractually agreed to reduce their fees and reimburse expenses in order to keep net expenses (excluding interest, taxes, brokerage commissions, acquired fund fees and expenses, and extraordinary expenses) from exceeding a specified amount for each Fund’s average daily net assets (with the exception of Global Echo ETF). The expense limitation agreement will be terminated upon termination of the investment advisory agreement between the Advisor and the Fund. The investment advisory agreement may only be terminated with the approval of the Fund’s Board. The expense caps in effect for each Fund during the year ended June 30, 2015 were as follows: Fund: Rate: Accuvest Global Long Short ETF . . . . . . . . . Athena High Dividend ETF . . . . . . . . . . . . . . EquityPro ETF . . . . . . . . . . . . . . . . . . . . . . . Gartman Gold/Euro ETF . . . . . . . . . . . . . . . Gartman Gold/Yen ETF . . . . . . . . . . . . . . . . Global Echo ETF . . . . . . . . . . . . . . . . . . . . . Madrona Domestic ETF . . . . . . . . . . . . . . . . Madrona Global Bond ETF . . . . . . . . . . . . . Madrona International ETF . . . . . . . . . . . . . Meidell Tactical Advantage ETF . . . . . . . . . . Morgan Creek Global Tactical ETF . . . . . . . . Newfleet Multi-Sector Income ETF . . . . . . . . Pacific Asset Enhanced Floating Rate ETF . . . Peritus High Yield ETF . . . . . . . . . . . . . . . . . Pring Turner Business Cycle ETF . . . . . . . . . . QAM Equity Hedge ETF . . . . . . . . . . . . . . . . Ranger Equity Bear ETF . . . . . . . . . . . . . . . . Sage Core Reserves ETF . . . . . . . . . . . . . . . . STAR Global Buy-Write ETF . . . . . . . . . . . . . Sunrise Global Multi-Strategy ETF . . . . . . . . TrimTabs Float Shrink ETF . . . . . . . . . . . . . . WCM/BNY Mellon Focused Growth ADR ETF YieldPro ETF . . . . . . . . . . . . . . . . . . . . . . . . . . . . . . . . . . . . . . . . . . . . . . . . . . . . . . . . . . . . . . . . . . . . . . . . . . . . . . . . . . . . . . . . . . . . . 169 . . . . . . . . . . . . . . . . . . . . . . . . . . . . . . . . . . . . . . . . . . . . . . . . . . . . . . . . . . . . . . . . . . . . . . . . . . . . . . . . . . . . . . . . . . . . . . . . . . . . . . . . . . . . . . . . . . . . . . . . . . . . . . . . . . . . . . . . . . . . . . . . . . . . . . . . . . . . . . . . . . . . . . . . . . . . . . . . . . . . . . . . . . . . . . . . . . . . . . . . . . . . . . . . . . . . . . . . . . . . . . . . . . . . . . . . . . . . . . . . . . . . . . . . . . . . . . . . . . . . . . . . . . . . . . . . . . . . . . . . . . . . . . . . . . . . . . . . . . . . . . . . . . . . . . . . . . . . . . . . . . . . . . . . . . . . . . . . . . . . . . . . . . . . . . . . . . . . . . . . . . . . . . . . . . . . . . . . . . . . . . . . . . . . . . . . . . . . . . . . . . . . . . . . . . . . . . . . . . . . . . . . . . . . . . . . . . . . . . . . . . . . . . . . . . . . . . . . . . . . . . . . . . . . . . . . . . . . . . . . . . . . . . . . . . . . . . . . . . . . . . . . . . . . . . . . . . . . . . . . . . . . . . . . . . . . . . . . . . . . . . . . . . . . . . . . 1.50% 0.99% 1.25% 0.65% 0.65% — 1.25% 0.95% 1.25% 1.35% 1.25% 0.75% 1.10% 1.35% 1.49% 1.50% 1.85% 0.35% 1.85% 1.75% 0.99% 1.25% 1.25%
174) ADVISORSHARES TRUST Notes to Financial Statements (Continued) June 30, 2015 4. Investment Advisory Agreement and Other Agreements − (continued) For the year ended June 30, 2015, the Advisor waived fees and reimbursed expenses for each Fund as follows. Each Fund may recoup such waivers until the date indicated. Expenses Reimbursed: Recoupment Balance: Recoupment Expiration: Accuvest Global Long Short ETF . . . . . . . . . . . . . . . . . . . . . . $ 83,973 63,291 115,138 Total Accuvest Global Long Short ETF . . . . . . . . . . . . . . . . 262,402 $ 81,563 63,291 115,138 259,992 6/30/2016 6/30/2017 6/30/2018 Fund: Athena High Dividend ETF . . . . . . . . . . . . . . . . . . . . . . . . . . Total Athena High Dividend ETF . . . . . . . . . . . . . . . . . . . . 83,036 83,036 79,776 79,776 6/30/2018 EquityPro ETF . . . . . . . . . . . . . . . . . . . . . . . . . . . . . . . . . . . 83,603 67,622 802 152,027 52,349 67,622 802 120,773 6/30/2016 6/30/2017 6/30/2018 49,169 118,897 168,066 49,169 118,897 168,066 6/30/2017 6/30/2018 48,900 122,306 171,206 48,900 122,306 171,206 6/30/2017 6/30/2018 59,617 35,931 35,654 131,202 59,418 35,931 35,654 131,003 6/30/2016 6/30/2017 6/30/2018 28,515 27,899 12,090 68,504 16,462 27,899 12,090 56,451 6/30/2016 6/30/2017 6/30/2018 60,597 54,221 79,853 194,671 60,597 54,221 79,853 194,671 6/30/2016 6/30/2017 6/30/2018 119,857 106,095 103,519 329,471 117,592 106,095 103,519 327,206 6/30/2016 6/30/2017 6/30/2018 15,570 4,358 175,707 195,635 — — 165,254 165,254 6/30/2016 6/30/2017 6/30/2018 Total EquityPro ETF . . . . . . . . . . . . . . . . . . . . . . . . . . . . . . Gartman Gold Euro ETF . . . . . . . . . . . . . . . . . . . . . . . . . . . . Total Gartman Gold Euro ETF . . . . . . . . . . . . . . . . . . . . . . Gartman Gold Yen ETF . . . . . . . . . . . . . . . . . . . . . . . . . . . . Total Gartman Gold Yen ETF . . . . . . . . . . . . . . . . . . . . . . . Madrona Domestic ETF . . . . . . . . . . . . . . . . . . . . . . . . . . . . Total Madrona Domestic ETF . . . . . . . . . . . . . . . . . . . . . . . Madrona Global Bond ETF . . . . . . . . . . . . . . . . . . . . . . . . . . Total Madrona Global Bond ETF . . . . . . . . . . . . . . . . . . . . Madrona International ETF . . . . . . . . . . . . . . . . . . . . . . . . . . Total Madrona International ETF . . . . . . . . . . . . . . . . . . . . Meidell Tactical Advantage ETF . . . . . . . . . . . . . . . . . . . . . . Total Meidell Tactical Advantage ETF . . . . . . . . . . . . . . . . Morgan Creek Global Tactical ETF . . . . . . . . . . . . . . . . . . . . Total Morgan Creek Global Tactical ETF . . . . . . . . . . . . . . 170
175) ADVISORSHARES TRUST Notes to Financial Statements (Continued) June 30, 2015 4. Investment Advisory Agreement and Other Agreements − (continued) Expenses Reimbursed: Recoupment Balance: Recoupment Expiration: Newfleet Multi-Sector Income ETF . . . . . . . . . . . . . . . . . . . . $ 76,615 88,416 139,832 Total Newfleet Multi-Sector Income ETF . . . . . . . . . . . . . . 304,863 $ 76,615 88,416 139,832 304,863 6/30/2016 6/30/2017 6/30/2018 Fund: Pacific Asset Enhanced Floating Rate ETF . . . . . . . . . . . . . . . . Total Pacific Asset Enhanced Floating Rate ETF . . . . . . . . . 30,047 30,047 30,047 30,047 6/30/2018 Pring Turner Business Cycle ETF . . . . . . . . . . . . . . . . . . . . . . 68,085 57,187 83,991 209,263 68,085 57,187 83,991 209,263 6/30/2016 6/30/2017 6/30/2018 98,205 65,019 88,514 251,738 98,205 65,019 88,514 251,738 6/30/2016 6/30/2017 6/30/2018 58,758 141,235 199,993 55,754 141,235 196,989 6/30/2017 6/30/2018 32,717 3,240 13,786 49,743 6/30/2016 6/30/2017 6/30/2018 Total STAR Global Buy-Write ETF . . . . . . . . . . . . . . . . . . . . 58,584 3,240 13,786 75,610 Sunrise Global Multi-Strategy ETF . . . . . . . . . . . . . . . . . . . . Total Sunrise Global Multi-Strategy ETF . . . . . . . . . . . . . . . 97,168 97,168 92,537 92,537 6/30/2018 TrimTabs Float Shrink ETF . . . . . . . . . . . . . . . . . . . . . . . . . . 113,494 159,385 211,220 484,099 113,494 159,385 211,220 484,099 6/30/2016 6/30/2017 6/30/2018 93,571 40,767 55,807 190,145 89,500 40,767 55,807 186,074 6/30/2016 6/30/2017 6/30/2018 Total Pring Turner Business Cycle ETF . . . . . . . . . . . . . . . . QAM Equity Hedge ETF . . . . . . . . . . . . . . . . . . . . . . . . . . . . Total QAM Equity Hedge ETF . . . . . . . . . . . . . . . . . . . . . . . Sage Core Reserves ETF . . . . . . . . . . . . . . . . . . . . . . . . . . . . Total Sage Core Reserves ETF . . . . . . . . . . . . . . . . . . . . . . . STAR Global Buy-Write ETF . . . . . . . . . . . . . . . . . . . . . . . . . . Total TrimTabs Float Shrink ETF . . . . . . . . . . . . . . . . . . . . . WCM/BNY Mellon Focused Growth ADR ETF . . . . . . . . . . . . Total WCM/BNY Mellon Focused Growth ADR ETF . . . . . . As part of its agreement with the Trust, the Advisor has contractually agreed to pay all operating expenses of the Global Echo ETF. There are no expenses reimbursed or recouped for that Fund. Administrator, Custodian, Fund Accountant and Transfer Agent The Bank of New York Mellon (‘‘BNYM’’) (in each capacity, the ‘‘Administrator’’, ‘‘Custodian’’, ‘‘Fund Accountant’’ or ‘‘Transfer Agent’’), serves as the Fund’s Administrator, Custodian, Fund Accountant and Transfer Agent pursuant to a certain Fund Administration and Accounting Agreement, a Custody Agreement or a Transfer Agency and Service Agreement, as the case may be. 171
176) ADVISORSHARES TRUST Notes to Financial Statements (Continued) June 30, 2015 4. Investment Advisory Agreement and Other Agreements − (continued) Distribution and Service (12b-1) Plan Foreside Fund Services, LLC (the ‘‘Distributor’’) serves as the Fund’s distributor of Creation Units for the Fund pursuant to the distribution agreement. The Distributor does not maintain any secondary market shares. The Funds have adopted a Distribution and Service Plan (‘‘Plan’’) pursuant to Rule 12b-1 under the 1940 Act. In accordance with its Plan, each Fund is authorized to pay an amount up to 0.25% of its average daily net assets each year for certain distribution-related activities. No fees are currently paid by each Fund under the Plan, and there are no current plans to impose these fees. However, in the event Rule 12b-1 fees were charged, over time they would increase the cost of an investment in each Fund. 5. Creation and Redemption Transactions The Funds issue and redeem shares on a continuous basis at NAV in groups of 25,000 shares, at minimum, called ‘‘Creation Units.’’ Except when aggregated in Creation Units, shares are not redeemable securities of a Fund. Only ‘‘Authorized Participants’’ may purchase or redeem shares directly from each Fund. An Authorized Participant is either (i) a broker-dealer or other participant in the clearing process through the Continuous Net Settlement System of the National Securities Clearing Corporation or (ii) a DTC participant and, in each case, must have executed a Participant Agreement with the Distributor. Most retail investors will not qualify as Authorized Participants or have the resources to buy and sell whole Creation Units. Therefore, they will be unable to purchase or redeem the shares directly from the Fund. Rather, most retail investors will purchase shares in the secondary market with the assistance of a broker and will be subject to customary brokerage commissions or fees. 6. Summary of Fair Value Disclosure The Financial Accounting Standard Board’s (‘‘FASB’’) Accounting Standards Codification (‘‘ASC’’) 820-10, Fair Value Measurements and Disclosures, defines fair value, establishes an authoritative framework for measuring fair value in accordance with generally accepted accounting principles, and expands disclosure about fair value measurements. Various inputs are used in determining the value of the Fund’s investments. These inputs are summarized in the three broad levels listed below: Level 1 — Unadjusted quoted prices in active markets for identical assets or liabilities that the company has the ability to access. Level 2 — Observable inputs other than quoted prices included in Level 1 that are observable for the asset or liability either directly or indirectly. These inputs may include quoted prices for the identical instrument on an inactive market, prices for similar instruments, interest rates, prepayment speeds, credit risk, yield curves, default rates, and similar data. Level 3 — Unobservable inputs for the asset or liability to the extent that relevant observable inputs are not available, representing the company’s own assumptions about the assumptions that a market participant would use in valuing the asset or liability, and that would be based on the best information available. Investments that use Level 2 or Level 3 inputs may include, but are not limited to: (i) an unlisted security related to corporate actions; (ii) a restricted security (e.g., one that may not be publicly sold without registration under the Securities Act of 1933 as amended); (iii) a security whose trading has been suspended or which has been de-listed from its primary trading exchange; (iv) a security that is thinly traded; (v) a security in default or bankruptcy proceedings for which there is no current market 172
177) ADVISORSHARES TRUST Notes to Financial Statements (Continued) June 30, 2015 6. Summary of Fair Value Disclosure − (continued) quotation; (vi) a security affected by currency controls or restrictions; and (vii) a security affected by a significant event (e.g., an event that occurs after the close of the markets on which the security is traded but before the time as of which a Fund’s net asset value is computed and that may materially affect the value of the Fund’s investment). Examples of events that may be ‘‘significant events’’ are government actions, natural disasters, armed conflicts and acts of terrorism. The inputs or methodology used for valuing securities are not necessarily an indication of the risk associated with investing in those securities. The following is a summary of the inputs used as of June 30, 2015 in valuing the Funds’ assets carried at fair value: Accuvest Global Long Short ETF Assets Level 1 Exchange Traded Funds . . Common Stocks . . . . . . Money Market Funds . . . . Futures† . . . . . . . . . . . Level 2 Municipal Bonds . . . . . . Asset Backed Securities . . . U.S. Government Agency Securities . . . . . . . . . Repurchase Agreements for Securities Loaned . . . . Swaps Contracts† . . . . . . . . . . . . . . $10,852,304 . — . 2,591,519 . — Athena High Dividend ETF EquityPro ETF $ — 15,154,349 80,184 — $18,714,718 — 464,567 — Gartman Gold/Yen ETF $ $ — — 11,026,789 267,757 Global Echo ETF — — 15,460,955 — $ — 5,263,154 324,692 — . . . . . . — — — — — — — — — — 300,000 1,170,379 . . . — — — — — 797,270 . . . . . . — 147,769 2,000,530 — 2,357,879 — — — — — 179,836 — Liabilities Level 1 Futures† . . . . . . . . . . . . . . — — Level 2 Swaps Contracts† . . . . . . . . (13,111) — Total . . . . . . . . . . . . . . . . $13,578,481 $17,235,063 Madrona Domestic ETF Assets Level 1 Exchange Traded Funds . . Closed End Fund . . . . . . Common Stocks . . . . . . Money Market Funds . . . . Level 2 Corporate Bonds . . . . . . Foreign Bonds . . . . . . . . US Treasury Notes . . . . . U.S. Government Agency Securities . . . . . . . . . Asset Backed Securities . . . Mortgage Backed Securities Term Loans . . . . . . . . . Repurchase Agreements for Securities Loaned . . . . Total . . . . . . . . . . . . . Gartman Gold/Euro ETF . . . . . . . . . $ — . — . 31,260,189 . 345,390 Madrona Global Bond ETF $27,812,843 — — 326,686 — (255,134) (408,175) — — $21,537,164 — $11,039,412 — $15,052,780 — $8,035,331 Madrona International ETF Meidell Tactical Advantage ETF Morgan Creek Global Tactical ETF Newfleet MultiSector Income ETF — — 18,818,244 516,762 $16,358,834 — — 614,679 $ 8,997,190 658,862 — 2,672,595 $ $ — — — 10,181,323 . . . . . . . . . — — — — — — — — — — — — — — — 40,700,400 13,036,071 4,214,257 . . . . — — — — — — — — — — — — — — — — — — — — 1,348,585 56,980,504 63,214,617 26,381,707 . . . 769,212 . . . $32,374,791 8,327,697 $36,467,226 2,436,360 $21,771,366 4,117,585 $21,091,098 1,842,084 $14,170,731 753,918 $216,811,382 . . . . . . . . 173
178) ADVISORSHARES TRUST Notes to Financial Statements (Continued) June 30, 2015 6. Summary of Fair Value Disclosure − (continued) Pacific Asset Enhanced Floating Rate ETF Assets Level 1 Exchange Traded Funds . . . . Common Stocks . . . . . . . . Money Market Funds . . . . . . Futures† . . . . . . . . . . . . . Level 2 Corporate Bonds . . . . . . . . Foreign Bonds . . . . . . . . . . Municipal Bonds . . . . . . . . US Treasury Notes . . . . . . . US Treasury Bills . . . . . . . . Asset Backed Securities . . . . . Commercial Mortgage Backed Securities . . . . . . . . . . . Term Loans . . . . . . . . . . . Repurchase Agreements for Securities Loaned . . . . . . Pring Turner Business Cycle ETF QAM Equity Hedge ETF Ranger Equity Bear ETF — 116,051 — — $1,605,194 2,347,069 466,381 — $6,579,930 — 570,159 — $ 29,811,000 — 12,574,072 — Peritus High Yield ETF . $ — $ . — . 1,216,054 . — Sage Core Reserves ETF $ — — 3,653,086 2,646 . . . . . . 3,662,423 — — — — — 253,563,342 48,170,150 — — — — — — — — — — — — — — — — — — — — — — 15,638,484 3,113,561 765,742 1,860,727 100,004 5,167,796 . . — 23,773,772 — 70,692,776 — — — — — — 4,709,931 — . — 51,883,351 350,292 — — 265,875 Liabilities Level 1 Exchange Traded Funds . . . . . — — — — — — — — — — — — — — — — — . . . . . (2,712) — . . . . . $28,649,537 $424,425,670 — $4,768,936 — $6,587,082 Liabilities Level 1 Exchange Traded Funds Common Stocks . . . . Futures† . . . . . . . . . Level 2 Swaps Contracts† . . . Total . . . . . . . . . . . . . . . . . . . . . . . . . . Assets Level 1 Exchange Traded Funds . . . Common Stocks . . . . . . . Money Market Funds . . . . Level 2 U.S. Treasury Notes . . . . . Repurchase Agreements for Securities Loaned . . . . . † — — — (2,426) — — $ (83,298,380) $35,275,426 YieldPro ETF — 242,217,774 268,307 $ — 14,864,528 651,100 $34,165,928 — 492,809 — — — — — 759,509 2,440,719 — — $1,538,789 — $243,245,590 — $17,956,347 — $34,658,737 Sunrise Global Multi-Strategy ETF . . . . . . . . . $23,939,303 405,235 1,046,062 $1,423,528 — 115,261 . . . 1,026,993 . . . — (13,449) $26,404,144 — (125,683,452) — WCM/BNY Mellon Focused Growth ADR ETF STAR Global Buy-Write ETF Liabilities Level 1 Written Options† . . . . . . . . . Total . . . . . . . . . . . . . . . . . (563,007) TrimTabs Float Shrink ETF $ Derivative instruments, including swap contracts and futures, are valued at the net unrealized gain (loss) on the instrument. 174
179) ADVISORSHARES TRUST Notes to Financial Statements (Continued) June 30, 2015 6. Summary of Fair Value Disclosure − (continued) There were no transfers between Level 1 and Level 2 fair value measurements that occurred during the year ended June 30, 2015. The Funds did not hold any Level 3 securities as of June 30, 2015. 7. Valuation of Derivative Instruments The Funds have adopted authoritative standards of accounting for derivative instruments which establish disclosure requirement for derivative instruments. These standards improve financial reporting for derivative instruments by requiring enhanced disclosures that enables investors to understand how and why a fund uses derivatives instruments, how derivatives instruments are accounted for and how derivative instruments affect a fund’s financial position and results of operations. The Funds use derivative instruments as part of their principal investment strategy to achieve their investment objective. At June 30, 2015, the fair values of derivative instruments were as follows: Statements of Assets and Liabilities: Fund: Asset Derivatives: Accuvest Global Long Short ETF . . Unrealized Appreciation on Swaps Contracts $147,769 $ Fund: Liability Derivatives: Accuvest Global Long Short ETF . . Unrealized Depreciation on Swaps Contracts 267,757 — — — — $147,769 $267,757 — $ — 2,646 $2,646 Commodity Risk Interest Rate Risk $ $ — Equity Risk Gartman Gold/Yen ETF . . . . . . . . Unrealized Depreciation on Futures Contracts — STAR Global Buy-Write ETF. . . . . . Options Written, at Value 175 Foreign Exchange Risk $(13,111) $ — Sage Core Reserves ETF . . . . . . . Unrealized Depreciation on Futures Contracts Interest Rate Risk $ — Gartman Gold/Euro ETF . . . . . . . Unrealized Depreciation on Futures Contracts Pacific Asset Enhanced Floating Unrealized Depreciation on Rate ETF . . . . . . . . . . . . . . . . Swaps Contracts Commodity Risk — Gartman Gold/Euro ETF . . . . . . . Unrealized Appreciation on Futures Contracts Sage Core Reserves ETF . . . . . . . Unrealized Appreciation on Futures Contracts Foreign Exchange Risk Equity Risk (2,712) — — — (67,239) $ — — — (255,134) — (340,936) — — — — — — (2,426) (6,926) — — (6,523) $(22,749) $(67,239) $(596,070) $(8,949)
180) ADVISORSHARES TRUST Notes to Financial Statements (Continued) June 30, 2015 7. Valuation of Derivative Instruments − (continued) Transactions in derivative instruments during the year ended June 30, 2015, were as follows: Statements of Operations: Fund: Accuvest Global Long Short ETF Gartman Gold/Euro ETF . . . . . Gartman Gold/Yen ETF . . . . . . Pacific Asset Enhanced Floating Rate ETF . . . . . . . . . . . . . QAM Equity Hedge ETF . . . . . QAM Equity Hedge ETF . . . . . Sage Core Reserves ETF . . . . . STAR Global Buy-Write ETF . . . STAR Global Buy-Write ETF . . . Sunrise Global Multi Strategy . . YieldPro ETF . . . . . . . . . . . . Foreign Equity Exchange Commodity Interest Risk Risk Risk Rate Risk $ 703,697 $ — $ — $ — — 378,635 (813,482) — — 940,073 (601,078) — Realized Gain (Loss): . . . Swaps . . . Futures . . . Futures . . . . . . . . . . . . . . . . . . . . . . . . Swaps Investments − Options Purchased Options Written Futures Investments − Options Purchased Options Written Futures Investments − Options Purchased Change in Fund: Unrealized Gain (Loss): Accuvest Global Long Short ETF . . . Swaps Gartman Gold/Euro ETF . . . . . . . . Futures Gartman Gold/Yen ETF . . . . . . . . . Futures Pacific Asset Enhanced Floating Rate ETF . . . . . . . . . . . . . . . . Swaps Sage Core Reserves ETF . . . . . . . . Futures STAR Global Buy-Write ETF . . . . . . Investments − Options Purchased STAR Global Buy-Write ETF . . . . . . Options Written YieldPro ETF . . . . . . . . . . . . . . . Investments − Options Purchased (10,073) — — — (10,391) — — — 358 — — — — — — (50,432) 1,127 — — — 21,458 — — — (3,109) (105,470) (337) 8,757 (2,416,236) — — (953,770) $(1,713,169) $1,213,238 $(1,414,897) $(995,445) Foreign Exchange Commodity Interest Risk Risk Rate Risk $ — $ — $ — 271,615 (317,224) — (21,807) (527,206) — Equity Risk $103,629 — — (2,712) — — 51,302 186,125 — — — — — $338,344 — — — — — $249,808 $(844,430) — (429) 1,338 (5,079) 132,059 $127,889 For the year ended June 30, 2015, the volume of the derivatives opened by the Funds were as follows: Accuvest Gartman Gartman Global Long Global/Euro Global/Yen Short ETF ETF ETF Long Swaps Contracts . . . . Short Swaps Contracts . . . . Purchased Options Contracts . . . . Written Options Contracts . . . . Short Futures Contracts . . . . Long Futures Contracts . . . . . Pacific Asset Enhanced Floating Rate ETF QAM Equity Hedge ETF Sage Core Reserves ETF STAR Global Buy-Write ETF Sunrise Global MultiStrategy YieldPro ETF — — — 3,500,000 — — — — — . 5,623,633 — — — — — — — — . — — — — 160 — 49 — 115,970 . — — — — 60 — 9,050 — — . — 315 474 — — 45 — 197 — . — 404 419 — — — — 540 — 176
181) ADVISORSHARES TRUST Notes to Financial Statements (Continued) June 30, 2015 8. Federal Income Tax The Funds intend to qualify as a ‘‘regulated investment company’’ under Sub-chapter M of the Internal Revenue Code of 1986, as amended. If so qualified, the Funds will not be subject to Federal income tax to the extent it distributes substantially all of its net investment income and net capital gains to its shareholders. Accounting for Uncertainty in Income Taxes provides guidance for how uncertain tax positions should be recognized, measured, presented and disclosed in the financial statements, and requires the evaluation of tax positions taken or expected to be taken in the course of preparing a Fund’s tax returns to determine whether the tax positions are ‘‘more-likely-than-not’’ of being sustained by the applicable tax authority. Tax positions not deemed to meet the more-than-likely-than-not threshold would be recorded as a tax benefit or expense in the current year. Interest and penalty related to income taxes would be recorded as income tax expense. Management of the Funds is required to analyze all open tax years (2013 − 2015), as defined by IRS statute of limitations, for all major jurisdictions, including federal tax authorities and certain state tax authorities. As of June 30, 2015, the Funds did not have a liability for any unrecognized tax benefits. The Funds have no examination in progress and is not aware of any tax positions for which it is reasonably possible that the amounts of unrecognized tax benefits will significantly change in the next twelve months. At June 30, 2015, the approximate cost of investments, including short positions, and net unrealized appreciation (depreciation) for federal income tax purposes was as follows: Fund Accuvest Global Long Short ETF . . . . . Athena High Dividend ETF . . . . . . . . . EquityPro ETF . . . . . . . . . . . . . . . . . Gartman Gold/Euro ETF . . . . . . . . . . Gartman Gold/Yen ETF . . . . . . . . . . . Global Echo ETF . . . . . . . . . . . . . . . Madrona Domestic ETF . . . . . . . . . . . Madrona Global Bond ETF . . . . . . . . . Madrona International ETF . . . . . . . . . Meidell Tactical Advantage ETF . . . . . . Morgan Creek Global Tactical ETF . . . . Newfleet Multi-Sector Income ETF . . . . Pacific Asset Enhanced Floating Rate ETF. Peritus High Yield ETF . . . . . . . . . . . . Pring Turner Business Cycle ETF . . . . . QAM Equity Hedge ETF . . . . . . . . . . . Ranger Equity Bear ETF . . . . . . . . . . . Sage Core Reserves ETF . . . . . . . . . . . STAR Global Buy-Write ETF . . . . . . . . . Sunrise Global Multi-Strategy ETF . . . . TrimTabs Float Shrink ETF . . . . . . . . . WCM/BNY Mellon Focused Growth ADR ETF . . . . . . . . . . . . . . . . . . YieldPro ETF . . . . . . . . . . . . . . . . . . * Cost* . $ 13,861,988 . 19,135,951 . 22,157,719 . 11,026,789 . 15,460,955 . 7,569,676 . 29,239,494 . 36,778,939 . 22,148,190 . 20,797,012 . 14,192,305 . 218,628,294 . 28,829,414 . 449,634,724 . 4,694,468 . 6,920,397 . 42,571,222 . 35,367,934 . 24,883,597 . 1,479,358 . 244,739,467 . . 16,025,589 34,853,709 Gross Gross Unrealized Unrealized Appreciation Depreciation $ 103,015 $ (521,180) 417,260 (2,318,148) 12,827 (633,382) — — — — 677,422 (211,767) 4,191,287 (1,055,990) 471,747 (783,460) 1,064,704 (1,441,528) 419,573 (125,487) 596,318 (617,892) 846,468 (2,663,380) 39,506 (216,671) 3,113,965 (28,323,019) 249,102 (174,634) 333,187 (73,060) 6,726,609 (4,788,772) 12,713 (105,441) 1,855,530 (321,534) 65,484 (6,053) 6,089,353 (7,583,230) 2,466,540 1,802 (535,782) (196,774) Net Unrealized Appreciation (Depreciation) $ (418,165) (1,900,888) (620,555) — — 465,655 3,135,297 (311,713) (376,824) 294,086 (21,574) (1,816,912) (177,165) (25,209,054) 74,468 229,692 (186,150) (92,728) 1,533,996 59,431 (1,493,877) 1,930,758 (194,972) Other Derivatives Net Unrealized Appreciation/ (Depreciation) $ 134,658 — — — — — — — — — — — (2,712) — — 30,435 2,123,987 — 55,982 — — — — Cost of investments on a tax basis, includes the adjustments for financial reporting purposes, as of the most recently completed Federal income tax reporting period end. 177
182) ADVISORSHARES TRUST Notes to Financial Statements (Continued) June 30, 2015 8. Federal Income Tax − (continued) At June 30, 2015, the components of distributable earnings/loss on a tax basis were as follows: Accumulated Undistributed Capital Gains/ Income (Losses) Fund Accuvest Global Long Short ETF . . . . . Athena High Dividend ETF . . . . . . . . EquityPro ETF . . . . . . . . . . . . . . . . Gartman Gold/Euro ETF . . . . . . . . . . Gartman Gold/Yen ETF . . . . . . . . . . Global Echo ETF . . . . . . . . . . . . . . . Madrona Domestic ETF . . . . . . . . . . Madrona Global Bond ETF . . . . . . . . Madrona International ETF . . . . . . . . Meidell Tactical Advantage ETF . . . . . Morgan Creek Global Tactical ETF . . . . Newfleet Multi-Sector Income ETF . . . Pacific Asset Enhanced Floating Rate ETF Peritus High Yield ETF . . . . . . . . . . . Pring Turner Business Cycle ETF . . . . . QAM Equity Hedge ETF . . . . . . . . . . Ranger Equity Bear ETF . . . . . . . . . . Sage Core Reserves ETF . . . . . . . . . . STAR Global Buy-Write ETF . . . . . . . . Sunrise Global Multi-Strategy ETF . . . . TrimTabs Float Shrink ETF . . . . . . . . . WCM/BNY Mellon Focused Growth ADR ETF . . . . . . . . . . . . . . . . . . YieldPro ETF . . . . . . . . . . . . . . . . . . . . . . . . . . . . . . . . . . . . . . . $ — . 394 . 1,352,991 . 469,946 . 170,869 . 57,227 . 25,582 . 44 . 173,789 . 64,848 . 132,899 . 46,112 . 18,971 . 1,073,647 . 22,133 . 51,095 . — . 3,072 . — . — . 887,332 . . . . 36,011 3,170 Timing Differences Net Unrealized Appreciation (Depreciation) Total Earnings (Losses) $ (12,583,302) $ (994,173) $ (283,507) $ (13,860,982) (299,791) (1,025,539) (1,900,888) (3,225,824) 121,361 — (620,555) 853,797 — (255,134) — 214,812 341,367 (340,936) — 171,300 — — 465,655 522,882 (990,628) (689,925) 3,135,297 1,480,326 (359,644) (141,828) (311,713) (813,141) (2,120,908) (1,071,957) (376,824) (3,395,900) (658,804) — 294,086 (299,870) (19,011,958) (233,289) (21,574) (19,133,922) (546,261) (801,367) (1,816,912) (3,118,428) — (15,830) (179,877) (176,736) (23,048,636) (97,890,947) (25,209,054) (145,074,990) (110,781) (323,092) 74,468 (337,272) 14,623 (29,206) 260,127 296,639 (156,506,507) (14,428,482) 1,937,837 (168,997,152) (25,960) (113,688) (92,728) (229,304) (173,044) (85,370) 1,589,978 1,331,564 (98,290) (97,178) 59,431 (136,037) (7,755,380) (3,925,462) (1,493,877) (12,287,387) (391,805) (1,767,067) — (2,599,879) 1,930,758 (194,972) 1,574,964 (4,558,748) The differences between book and tax basis components of net assets are primarily attributable to wash sale loss deferrals and other book and tax differences. 178
183) ADVISORSHARES TRUST Notes to Financial Statements (Continued) June 30, 2015 8. Federal Income Tax − (continued) At June 30, 2015, the effect of permanent book/tax reclassifications resulted in increases/(decreases) to the components of net assets as follows: Undistributed Net Investment Income Fund Accuvest Global Long Short ETF . . . . . . . . . . Athena High Dividend ETF . . . . . . . . . . . . . . EquityPro ETF . . . . . . . . . . . . . . . . . . . . . . . Gartman Gold/Euro ETF . . . . . . . . . . . . . . . Gartman Gold/Yen ETF . . . . . . . . . . . . . . . . Global Echo ETF . . . . . . . . . . . . . . . . . . . . . Madrona Domestic ETF . . . . . . . . . . . . . . . . Madrona Global Bond ETF . . . . . . . . . . . . . . Madrona International ETF . . . . . . . . . . . . . Meidell Tactical Advantage ETF . . . . . . . . . . Morgan Creek Global Tactical ETF . . . . . . . . Newfleet Multi-Sector Income ETF . . . . . . . . Pacific Asset Enhanced Floating Rate ETF . . . Peritus High Yield ETF . . . . . . . . . . . . . . . . . Pring Turner Business Cycle ETF . . . . . . . . . . QAM Equity Hedge ETF . . . . . . . . . . . . . . . . Ranger Equity Bear ETF . . . . . . . . . . . . . . . . Sage Core Reserves ETF . . . . . . . . . . . . . . . . STAR Global Buy-Write ETF . . . . . . . . . . . . . Sunrise Global Multi-Strategy ETF . . . . . . . . TrimTabs Float Shrink ETF . . . . . . . . . . . . . . WCM/BNY Mellon Focused Growth ADR ETF YieldPro ETF . . . . . . . . . . . . . . . . . . . . . . . . . . . . . . . . . . . . . . . . . . . . . . . . . . . . . . . . . . . . . . . . . . . . . . . . . . . . . . . . . . . . . . . . . . . . . . . . . . . . . . . . . . . . . . . . . . . . . . . . . . . . . . . . . . . . . . . . . . . . . . . . . . . . . . . . . . . . . . . . . . . . . . . . . . . . . . . . . . . . . . . . . . . . . . . . . . . . . . . . . . . . . . . . . . . . . . . . . . . . . . . . . . . . . . . Accumulated Net Realized Gains/(Losses) Paid-in Capital $ 15,622 $ (156,029) $ 140,407 21,683 (15,795) (5,888) (64,028) (160,628) 224,656 78,774 765,406 (844,180) 88,619 544,352 (632,971) 21,767 (440,682) 418,915 — (4,608,427) 4,608,427 28,917 (28,917) — 697 (1,918,468) 1,917,771 (1,193) (440,631) 441,824 41,886 (1,333,530) 1,291,644 348,719 (348,719) — 5,757 (5,757) — 1,953,259 (3,495,231) 1,541,972 6,501 (39,111) 32,610 5,364 (195,588) 190,224 4,544,062 (173,304) (4,370,758) 98,713 (98,713) — 48,343 (690,474) 642,131 363 (53,295) 52,932 (46) (30,484,934) 30,484,980 (207) (314,359) 314,566 183,469 (85,998) (97,471) For Financial reporting purposes, capital accounts are adjusted to reflect the tax character of permanent book/tax differences. Reclassifications are primarily due to the tax treatment of net operating losses and distribution reclassifications. 179
184) ADVISORSHARES TRUST Notes to Financial Statements (Continued) June 30, 2015 8. Federal Income Tax − (continued) The tax character of distributions paid during the years ended June 30, 2015 and 2014 were: 2015 Ordinary Income Fund Athena High Dividend ETF . . . . . . . . . . . . . . EquityPro ETF . . . . . . . . . . . . . . . . . . . . . . . Gartman Gold/Euro ETF . . . . . . . . . . . . . . . . Gartman Gold/Yen ETF . . . . . . . . . . . . . . . . Global Echo ETF . . . . . . . . . . . . . . . . . . . . . Madrona Domestic ETF . . . . . . . . . . . . . . . . Madrona Global Bond ETF . . . . . . . . . . . . . . Madrona International ETF . . . . . . . . . . . . . . Meidell Tactical Advantage ETF . . . . . . . . . . Morgan Creek Global Tactical ETF . . . . . . . . Newfleet Multi-Sector Income ETF . . . . . . . . Pacific Asset Enhanced Floating Rate ETF . . . . Peritus High Yield ETF . . . . . . . . . . . . . . . . . Pring Turner Business Cycle ETF . . . . . . . . . . QAM Equity Hedge ETF . . . . . . . . . . . . . . . . Sage Core Reserves ETF . . . . . . . . . . . . . . . . Sunrise Global Multi-Strategy ETF . . . . . . . . TrimTabs Float Shrink ETF . . . . . . . . . . . . . . WCM/BNY Mellon Focused Growth ADR ETF . YieldPro ETF . . . . . . . . . . . . . . . . . . . . . . . . 2015 Long Term Capital Gains . $ 529,121 . 528,866 . 78,602 . 143,054 . 43,499 . 96,271 . 823,886 . 304,843 . 93,938 . 354,156 . 5,247,098 . 316,679 . 48,496,620 . 53,639 . 28,704 . 147,384 . 45,346 . 1,045,971 . 94,665 . 2,337,383 2014 Ordinary Income $ — 204,411 76,110 178,043 2,578 — — — — — — — — — 36,225 — — — — — 2014 Long Term Capital Gains $ — 154,669 — — 2,380 59,938 761,153 318,396 — — 2,905,125 — 45,680,132 59,326 92,485 119,991 — 300,553 54,540 532,662 $ — — — — — — — — — — — — — — 26,668 — — — — — Under current tax regulations, capital losses on securities transactions realized after October 31 (‘‘Post-October Losses’’) may be deferred and treated as occurring on the first business day of the following fiscal Under the recently enacted Regulated Investment Company Modernization Act of 2010, the Funds will be permitted to defer taxable ordinary income losses incurred after December 31 and treat as occurring on the first business day of the following fiscal year. Post-October losses and ordinary income losses deferred to July 1, 2015 are as follows: Late Year Ordinary Deferral Fund Accuvest Global Long Short ETF . . . . . . Athena High Dividend ETF . . . . . . . . . . Madrona Domestic ETF . . . . . . . . . . . . Madrona Global Bond ETF . . . . . . . . . . Madrona International ETF . . . . . . . . . . Morgan Creek Global Tactical ETF . . . . . Newfleet Multi-Sector Income ETF . . . . Pacific Asset Enhanced Floating Rate ETF Peritus High Yield ETF . . . . . . . . . . . . . . Pring Turner Business Cycle ETF . . . . . . QAM Equity Hedge ETF . . . . . . . . . . . . Ranger Equity Bear ETF . . . . . . . . . . . . . . . . . . . . . . . . . . . . . . . . . . . . . . . . . . . . . . . . . . . . . . . . . . . . . . . . . . . . . . . . . . . . . . . . . . . . . . . . . . . . . . . . . . . . . . . . . . . . . . . . . . . . . . . . . 180 . . . . . . . . . . . . . . . . . . . . . . . . $ — — — — — 49,931 — — — — 29,206 1,549,999 Short-Term Post-October Loss $ 994,172 1,025,539 507,970 — 947,362 183,358 579,219 15,830 62,885,772 219,147 — 12,878,483 Long-Term Post-October Loss $ 1 — 181,955 141,828 124,595 — 222,148 — 35,005,175 103,945 — —
185) ADVISORSHARES TRUST Notes to Financial Statements (Continued) June 30, 2015 8. Federal Income Tax − (continued) Late Year Ordinary Deferral $ Fund Sage Core Reserves ETF . . . . . . . STAR Global Buy-Write ETF . . . . . Sunrise Global Multi-Strategy ETF TrimTabs Float Shrink ETF . . . . . . YieldPro ETF . . . . . . . . . . . . . . . . . . . . . . . . . . . . . . . . . . . . . . . . . . . . . . . . . . . . . . . . . . . . . . . . . . . . . . . . . . . . . . . . . . . . . . . . . . . . . . . . Short-Term Post-October Loss $ — 3,196 45,447 — — Long-Term Post-October Loss 50,439 — — 3,925,462 2,566,012 $63,249 — 51,731 — 33,867 The following Funds have capital loss carryforwards available to offset future realized gains of: Short-Term Post-Effective No Expiration Fund Accuvest Global Long Short ETF . . . . . . . . . Athena High Dividend ETF . . . . . . . . . . . . . Madrona Domestic ETF . . . . . . . . . . . . . . . Madrona Global Bond ETF . . . . . . . . . . . . . Madrona International ETF . . . . . . . . . . . . . Meidell Tactical Advantage ETF . . . . . . . . . . Morgan Creek Global Tactical ETF . . . . . . . . Newfleet Multi-Sector Income ETF . . . . . . . Peritus High Yield ETF . . . . . . . . . . . . . . . . . Pring Turner Business Cycle ETF . . . . . . . . . Ranger Equity Bear ETF . . . . . . . . . . . . . . . . Sage Core Reserves ETF . . . . . . . . . . . . . . . STAR Global Buy-Write ETF . . . . . . . . . . . . . Sunrise Global Multi-Strategy ETF . . . . . . . . TrimTabs Float Shrink ETF . . . . . . . . . . . . . . WCM/BNY Mellon Focused Growth ADR ETF YieldPro ETF . . . . . . . . . . . . . . . . . . . . . . . . . . . . . . . . . . . . . . . . . . . . . . . . . . . . . . . . . . . . . . . . . . . . . . . . . . . . . . . . . . . . . . . . . . . . . . . . . . . . . . . . . . . . . . . . . . . . . . . . . . . . . . . . . . . . . . . . . . . . . . . Long-Term Post-Effective No Expiration Total $ 421,058 — 193,546 152,523 — — — 88,927 5,033,549 — — — 173,044 — — 298,855 — . $ 12,162,244 . 299,791 . 797,082 . 207,121 . 2,120,908 . 658,804 . 19,011,958 . 457,334 . 18,015,087 . 110,781 . 156,506,507 . 25,960 . — . 98,290 . 7,755,380 . 92,950 . 1,767,067 $ 12,583,302 299,791 990,628 359,644 2,120,908 658,804 19,011,958 546,261 23,048,636 110,781 156,506,507 25,960 173,044 98,290 7,755,380 391,805 1,767,067 The following Funds utilized capital loss carryforwards to offset taxable capital gains realized during the year ended June 30, 2015: Fund Global Echo ETF . . . . . . . . . . . . . . . . . . . . . Madrona Domestic ETF . . . . . . . . . . . . . . . Morgan Creek Global Tactical ETF . . . . . . . . STAR Global Buy-Write ETF . . . . . . . . . . . . . WCM/BNY Mellon Focused Growth ADR ETF Amount . . . . . . . . . . . . . . . . . . . . . . . . . . . . . . . . . . . . . . . . . . . . . . . . . . . . . . . . . . . . . . . . . . . . . . . . . . . . . . . . . . . . . . . . . . . . . . . . . . . . . . . . . . . . . . . . . . . . . . . . . . . . . . . . . . . . . . . . . . . . . . . . . . . . . . . . . . . . . . . . $ 13,478 486 260,244 1,340 58,175 On December 22, 2010, the Regulated Investment Company (‘‘RIC’’) Modernization Act of 2010 (the ‘‘Act’’), The Act permits to carry forward capital losses incurred in taxable years beginning after December 22, 2010 for an unlimited period. However, any losses incurred during those future taxable years will be required to be utilized prior to the losses incurred in pre-enactment taxable years. As a result of this ordering rule, pre-enactment capital loss carry forwards may have an increased 181
186) ADVISORSHARES TRUST Notes to Financial Statements (Continued) June 30, 2015 8. Federal Income Tax − (continued) likelihood to expire unused. Additionally, post-enactment capital losses that are carried forward will retain their character as either short-term or long-term capital losses rather than being considered all short-term as under previous law. The carry forward capital losses noted above are all post-enactment capital loss carry forwards. 9. Other Affiliated Parties and Transactions Affiliated holdings are funds which are managed by the Trust or an affiliate of the Trust. Transactions with affiliated companies during the year ended June 30, 2015 are as follows: Value at 06/30/2014 Affiliated Fund Name Global Echo ETF Ranger Equity Bear ETF . . . . . . . Sage Core Reserves ETF . . . . . . . Madrona Global Bond ETF Peritus High Yield ETF . . . . . . . . Meidell Tactical Advantage ETF Sage Core Reserves ETF . . . . . . . Pring Turner Business Cycle ETF Peritus High Yield ETF . . . . . . . . QAM Equity Hedge ETF Sage Core Reserves ETF . . . . . . . Ranger Equity Bear ETF Sage Core Reserves ETF . . . . . . . STAR Global Buy-Write ETF Sage Core Reserves ETF . . . . . . . YieldPro ETF Peritus High Yield ETF . . . . . . . . . . $ 11,780 . . 1,098,409 Purchases/ Additions $ 1,361 49,940 Sales/ Reductions $ Value at 6/30/2015 (13,669) $ (1,147,794) — — Dividend Income $ Realized Gain (Loss) — $ — (461) (2,261) . . 3,112,080 405,318 (3,191,587) — 57,711 (163,677) . . — 740,093 (739,157) — 94 (936) . . 234,467 32,691 (222,722) — 7,858 (36,870) . . 419,202 69,615 (139,283) 347,795 1,556 (333) . . 29,943,000 — 29,811,000 118,989 . . 262,001 12,425 (24,889) 248,425 1,003 (111) . . 10,049,182 — (9,444,655) — 174,117 (490,110) 182 — —
187) ADVISORSHARES TRUST Notes to Financial Statements (Continued) June 30, 2015 10. Investment Transactions Purchases and sales of investments for the year ended June 30, 2015 are as follows: Purchases Fund Accuvest Global Long Short ETF . . . . . . . . . Athena High Dividend ETF . EquityPro ETF . . . . . . . . Global Echo ETF . . . . . . Madrona Domestic ETF . . Madrona Global Bond ETF . Madrona International ETF. Meidell Tactical Advantage ETF . . . . . . . . . . . . . Morgan Creek Global Tactical ETF . . . . . . . . Newfleet Multi-Sector Income ETF . . . . . . . . Pacific Asset Enhanced Floating Rate ETF . . . . . Peritus High Yield ETF . . . Pring Turner Business Cycle ETF . . . . . . . . . . . . . QAM Equity Hedge ETF . . Ranger Equity Bear ETF . . Sage Core Reserves ETF . . STAR Global Buy-Write ETF. Sunrise Global Multi Strategy ETF . . . . . . . TrimTabs Float Shrink ETF . WCM/BNY Mellon Focused Growth ADR ETF . . . . . YieldPro ETF . . . . . . . . . Long Term . $ 61,959,309 . 22,657,615 . 85,111,513 . 4,515,365 . 21,194,485 . 9,142,245 . 27,287,484 Sales U.S. Government $ — — — — — — — In-Kind Long Term $ 10,927,144 $ 64,148,819 18,311,868 22,425,724 11,129,191 85,287,428 934,701 5,255,968 5,165,187 4,391,580 5,140,741 9,092,103 1,374,040 15,393,417 U.S. Government $ In-Kind — — — — — — — 20,849,062 — 11,422,839 1,811,051 16,674,191 — 12,246,366 . 61,159,561 — 12,123,292 61,126,969 — 11,534,828 . 38,433,968 — — 43,005,946 — 21,223,718 . 125,718,786 18,982,150 — 67,702,191 21,273,353 — . . 54,400,253 524,418,498 — — — 9,778,318 26,765,281 753,025,960 — — — 278,139,770 . . . . . 3,362,037 10,011,421 770,767,975 12,594,708 14,889,119 — — — — — 622,074 1,233,709 — — 1,173,914 3,211,088 9,874,405 729,575,510 15,385,463 10,468,525 — — — — — 504,728 2,615,349 — — 2,203,312 . . 3,467,999 94,570,185 — — 3,004,527 704,482,402 3,615,520 331,842,168 — — 1,495,978 376,977,599 . . 3,873,731 66,469,065 — — 3,605,547 5,044,252 4,232,128 74,249,615 — — 939,935 31,821,881 Options Written transactions, during the year ended June 30, 2015, were as follows: QAM Equity Hedge ETF Contracts Options outstanding at June 30, 2014 . . . . . . . . . . Options written . . . . . . . . . . . . . . . . . . . . . . . . . . Options terminated in closing purchase transactions Options expired . . . . . . . . . . . . . . . . . . . . . . . . . . Options exercised . . . . . . . . . . . . . . . . . . . . . . . . . Options outstanding at June 30, 2015 . . . . . . . . . . . . . . . . . . . . . . . . . . . . . . . . . . . . . . . . . . . . . . . . . . . . . . . . . . . . . . . . . . . . . . . . . . . . . . . . . . . . . . . . . . . . . . . . . . . . — 60 — (60) — — Premiums Paid/Received $ — 358 — (358) — — Contracts STAR Global Buy-Write ETF Options outstanding at June 30, 2014 . . . . . . . . . . Options written . . . . . . . . . . . . . . . . . . . . . . . . . . Options terminated in closing purchase transactions Options expired . . . . . . . . . . . . . . . . . . . . . . . . . . Options exercised . . . . . . . . . . . . . . . . . . . . . . . . . Options outstanding at June 30, 2015 . . . . . . . . . . . . . . . . 183 . . . . . . . . . . . . . . . . . . . . . . . . . . . . . . . . . . . . . . . . . . . . . . . . . . . . . . . . . . . . . . . . . . . . . . . . . . . . . . . . . . . . Premiums Paid/Received 1,030 9,050 (5,841) (2,535) (1,112) 592 $ 57,243 726,138 (484,805) (155,115) (74,030) 69,431
188) ADVISORSHARES TRUST Notes to Financial Statements (Continued) June 30, 2015 11. Risks Involved with Investing in the Funds The Funds are subject to the principal risks described below, some or all of these risks may adversely affect the Funds’ NAV, trading price, yield, total return and ability to meet its investment objective. As with any investment, an investment in each Fund could result in a loss or the performance of each Fund could be inferior to that of other investments. Fund of Funds Risk Some of the Funds’ investment performance, because they are fund of funds, depends on the investment performance of the Underlying ETFs in which they invest. An investment in these Funds is subject to the risk associated with the Underlying ETFs that comprise their Underlying Index. The Funds will indirectly pay a proportional share of the asset-based fees, if any, of the Underlying ETFs in which they invest. Liquidity Risk In certain circumstances, it may be difficult for the Fund to purchase and sell particular investments within a reasonable time at a fair price. To the extent that there is not an established retail market for instruments in which the Fund may invest, trading in such instruments may be relatively inactive. Trading in shares may be halted because of market conditions or for reasons that, in the view of the Exchange, make trading in shares inadvisable. In addition, trading in shares is subject to trading halts caused by extraordinary market volatility pursuant to ‘‘circuit breaker’’ rules. There can be no assurance that the requirements necessary to maintain the listing of the shares of the Fund will continue to be met or will remain unchanged. Market Risk Investments in securities, in general, are subject to market risks that may cause their prices to fluctuate over time. The Fund’s investments may decline in value due to factors affecting securities markets generally, or particular countries, segments, economic sectors, industries or companies within those markets. The value of a security held in a short position may increase due to general economic and market conditions which are not specifically related to a particular issuer, such as real or perceived positive economic conditions or changes in interest or currency rates. Because the market value of ETF shares may differ from their net asset value, the shares may trade at a premium or discount. An investment in the Fund may lose money. New Fund Risk Some of the Funds are new funds. As new funds, there can be no assurance that the Funds will grow to or maintain an economically viable size, in which case the Funds may experience greater tracking error to their Underlying Index than it otherwise would be at higher asset levels or it could ultimately liquidate. 12. Subsequent Events The Funds have adopted authoritative standards of accounting for disclosure of events that occur after the Statements of Assets and Liabilities date but before financial statements are issued or are available to be issued. These standards require the Fund to recognize in the financial statements the effects of all recognized subsequent events that provide additional evidence about conditions that existed at the date of Statement. 184
189) ADVISORSHARES TRUST Notes to Financial Statements (Continued) June 30, 2015 12. Subsequent Events − (continued) Since June 30, 2015, the following events occurred: On July 28, 2015, the Advisor announced it will liquidate Accuvest Global Long Short ETF. The Trust’s Board of Trustees approved the liquidation of the Fund. Accordingly, the Fund is expected to cease operations, liquidate its assets, and distribute the liquidation proceeds to shareholders of record on August 14, 2015. The following Funds paid dividends after June 30, 2015: Ticker Ordinary Income Per Share Distributed Payable Date HYLD FWDB MINC HOLD YPRO FLRT DIVI $0.29998 $0.06215 $0.09423 $0.03877 $0.01773 $0.14686 $0.02010 07/30/2015 07/30/2015 07/30/2015 07/30/2015 07/30/2015 07/30/2015 07/30/2015 Fund Peritus High Yield ETF . . . . . . . . . . . Madrona Global Bond ETF . . . . . . . Newfleet Multi-Sector Income ETF . Sage Core Reserves ETF . . . . . . . . . YieldPro ETF . . . . . . . . . . . . . . . . . . Pacific Asset Enhanced Floating Rate Athena High Dividend ETF . . . . . . . . . . . . . . . . . . . . . . . . . . . . . . . . . . . . . . . . . . . . . . . . . . . . . . . . . . . . . . . . . . . . . . . . . . . . . . . . . . . . . . . . . . . . . . . . . . . . . . . . . 13. Unaudited Tax Information Qualified Dividend Income — Certain dividends paid by the Funds may be subject to a minimum tax rate of 15%, as provided by the Jobs and Growth Tax Relief Reconciliation Act of 2003. The percentage of ordinary income distributions for the period ended June 30, 2015, taxed at a maximum rate of 15% were: Fund Athena High Dividend ETF . . . . . . . . . . . . . EquityPro ETF . . . . . . . . . . . . . . . . . . . . . . Gartman Gold/Euro ETF . . . . . . . . . . . . . . . Gartman Gold/Yen ETF . . . . . . . . . . . . . . . . Global Echo ETF . . . . . . . . . . . . . . . . . . . . . Madrona Domestic ETF . . . . . . . . . . . . . . . Madrona Global Bond ETF . . . . . . . . . . . . . Madrona International ETF . . . . . . . . . . . . . Meidell Tactical Advantage ETF . . . . . . . . . . Morgan Creek Global Tactical ETF . . . . . . . . Peritus High Yield ETF . . . . . . . . . . . . . . . . . Pring Turner Business Cycle ETF . . . . . . . . . QAM Equity Hedge ETF . . . . . . . . . . . . . . . Sunrise Global Multi-Strategy ETF . . . . . . . . TrimTabs Float Shrink ETF . . . . . . . . . . . . . . WCM/BNY Mellon Focused Growth ADR ETF YieldPro ETF . . . . . . . . . . . . . . . . . . . . . . . . Percentage . . . . . . . . . . . . . . . . . . . . . . . . . . . . . . . . . . . . . . . . . . . . . . . . . . . . . . . . . . . . . . . . . . . . . . . . . . . . . . . . . . . . . . . . . . . . . . . . . . . . . . 185 . . . . . . . . . . . . . . . . . . . . . . . . . . . . . . . . . . . . . . . . . . . . . . . . . . . . . . . . . . . . . . . . . . . . . . . . . . . . . . . . . . . . . . . . . . . . . . . . . . . . . . . . . . . . . . . . . . . . . . . . . . . . . . . . . . . . . . . . . . . . . . . . . . . . . . . . . . . . . . . . . . . . . . . . . . . . . . . . . . . . . . . . . . . . . . . . . . . . . . . . . . . . . . . . . . . . . . . . . . . . . . . . . . . . . . . . . . . . . . . . . . . . . . . . . . . . . . . . . . . . . . . . . . . . . . . . . . . . . . . . . . . . . . . . . . . . . . . . . . . . . . . . . . . . . . . . . . . . . . . . . . . . . . . . . . . . . . . . . . . . . . . . . . . . . . . . . . . . . . . . . . . . . . . . . . . . . . . . . . . . . . . . . . . . . . . . . . . . . . . . . . . . . . . . . . . . . . . . . . . . . . . . . . . . . . . . . . . . . . . . . . 94.21% 56.06% 12.31% 9.14% 29.18% 100.00% 17.46% 93.26% 28.48% 100.00% 4.76% 100.00% 35.23% 69.28% 100.00% 100.00% 61.46%
190) ADVISORSHARES TRUST Notes to Financial Statements (Continued) June 30, 2015 13. Unaudited Tax Information − (continued) Dividends Received Deduction — For corporate shareholders, the percentage of ordinary income distributions for the period ended June 30, 2015 that qualifies for the dividends received deduction were: Fund Athena High Dividend ETF . . . . . EquityPro ETF . . . . . . . . . . . . . . Global Echo ETF . . . . . . . . . . . . . Madrona Domestic ETF . . . . . . . Madrona Global Bond ETF . . . . . Meidell Tactical Advantage ETF . . Morgan Creek Global Tactical ETF Pring Turner Business Cycle ETF . QAM Equity Hedge ETF . . . . . . . Sunrise Global Multi-Strategy ETF TrimTabs Float Shrink ETF . . . . . . YieldPro ETF . . . . . . . . . . . . . . . . Percentage . . . . . . . . . . . . . . . . . . . . . . . . . . . . . . . . . . . . . . . . . . . . . . . . . . . . . . . . . . . . . . . . . . . . . . . . . . . . . . . . . . . . . . . . . . . . . . . . . . . . . . . . . . . . . . . . . . . . . . . . . . . . . . . . . . . . . . . . . . . . . . . . . . . . . . . . . . . . . . . . . . . . . . . . . . . . . . . . . . . . . . . . . . . . . . . . . . . . . . . . . . . . . . . . . . . . . . . . . . . . . . . . . . . . . . . . . . . . . . . . . . . . . . . . . . . . . . . . . . . . . . . . . . . . . . . . . . . . . . . . . . . . . . . . . . . . . . . . . . . . . . . . . . . . . . . . . . . . . . . . . . . . . . . . . . . . . . . . . . . . . . . . . . . . . . . . . . . . . . . . . . . . . . . . . . . . . . . . . . . . . . . . . . . . . . . . . . . . . . . . . . . . . . . . . . . . . . . . . . . . . . . . . . . . . . . . . . . . . . . . . . . . . . . . . . . . . . . . . . . . . . . . . . . . . . . . . . . . . . . . 78.62% 56.06% 29.18% 100.00% 9.34% 28.48% 53.99% 93.99% 22.36% 76.54% 100.00% 59.80% Qualified Interest Income — For nonresident alien shareholders, the percentage of ordinary income distributions for the period ended June 30, 2015 that qualifies as qualified interest income were: Fund Percentage Madrona Global Bond ETF . . . . . . . . . . Newfleet Multi-Sector Income ETF . . . . Pacific Asset Enhanced Floating Rate ETF Peritus High Yield ETF . . . . . . . . . . . . . . Sage Core Reserves ETF . . . . . . . . . . . . YieldPro ETF . . . . . . . . . . . . . . . . . . . . . . . . . . . . . . . . . . . . . . . . . . . . . . . . . . . . . . . . . . . . . . . . . . . . . . . . . . . . . . . . . . . . . . . . . . . . . . . . . . . . . . . . . . . . . . . . . . . . . . . . . . . . . . . . . . . . . . . . . . . . . . . . . . . . . . . . . . . . . . . . . . . . . . . . . . . . . . . . . . . . . . . . . . . . . . . . . . . . . . . . . . . . . . . . . . . . . . . . . . . . . . . . . . . . . . . 43.90% 100.00% 100.00% 83.36% 100.00% 45.00% The following Funds intend to elect to pass through to shareholders the credit for taxes paid to foreign countries. The gross foreign source income and foreign taxes paid are as follows: Taxes Paid Fund EquityPro ETF . . . . . . . . . . . . . . Madrona International ETF . . . . . Meidell Tactical Advantage ETF . . Morgan Creek Global Tactical ETF . . . . . . . . . . . . . . . . . . . . . . . . . . . . . . . . . . . . . . . . . . . . . . . . . . . . . . . . 186 . . . . . . . . . . . . . . . . . . . . . . . . . . . . . . . . . . . . . . . . . . . . . . . . . . . . . . . . . . . . . . . . Foreign Source Income $11,059 47,368 4,909 20,345 $180,999 429,241 67,684 200,997
191) REPORT OF INDEPENDENT REGISTERED PUBLIC ACCOUNTING FIRM To the Board of Trustees and Shareholders AdvisorShares Trust We have audited the accompanying statements of assets and liabilities of Accuvest Global Long Short ETF, Athena High Dividend ETF, EquityPro ETF, Global Echo ETF, Madrona Domestic ETF, Madrona Global Bond ETF, Madrona International ETF, Meidell Tactical Advantage ETF, Morgan Creek Global Tactical ETF (formerly known as Cambria Global Tactical ETF), Newfleet Multi-Sector Income ETF, Pacific Asset Enhanced Floating Rate ETF, Peritus High Yield ETF, Pring Turner Business Cycle ETF, QAM Equity Hedge ETF, Ranger Equity Bear ETF, Sage Core Reserves ETF, STAR Global Buy-Write ETF, Sunrise Global Multi-Strategy ETF, TrimTabs Float Shrink ETF, WCM/BNY Mellon Focused Growth ADR ETF, and YieldPro ETF, each a series of AdvisorShares Trust (the ‘‘Trust’’), including the schedules of investments as of June 30, 2015, and the related statements of operations, the statements of changes in net assets and the financial highlights for the periods indicated thereon, and with respect to Accuvest Global Long Short ETF, QAM Equity Hedge ETF, and Ranger Equity Bear ETF, the statements of cash flows for the year ended June 30, 2015. We have audited the accompanying consolidated statements of assets and liabilities of Gartman Gold/Euro ETF and Gartman Gold/Yen ETF, each a series of AdvisorShares Trust (the ‘‘Trust’’), including the consolidated schedules of investments as of June 30, 2015, and the related consolidated statements of operations, the consolidated statements of changes in net assets and the consolidated financial highlights for the periods indicated thereon These financial statements and financial highlights are the responsibility of the Trust’s management. Our responsibility is to express an opinion on these financial statements and financial highlights based on our audits. We conducted our audits in accordance with the standards of the Public Company Accounting Oversight Board (United States). Those standards require that we plan and perform the audit to obtain reasonable assurance about whether the financial statements and financial highlights are free of material misstatement. The Trust is not required to have, nor were we engaged to perform, an audit of the Trust’s internal controls over financial reporting. Our audits included consideration of internal control over financial reporting as a basis for designing audit procedures that are appropriate in the circumstances, but not for the purpose of expressing an opinion on the effectiveness of the Trust’s internal control over financial reporting. Accordingly, we express no such opinion. An audit includes examining, on a test basis, evidence supporting the amounts and disclosures in the financial statements. Our procedures included confirmation of securities owned as of June 30, 2015, by correspondence with the custodian and brokers or by other appropriate auditing procedures where replies from brokers were not received. An audit also includes assessing the accounting principles used and significant estimates made by management, as well as evaluating the overall financial statement presentation. We believe that our audits provide a reasonable basis for our opinion. In our opinion, the financial statements and financial highlights referred to above present fairly, in all material respects, the financial position of Accuvest Global Long Short ETF, Athena High Dividend ETF, EquityPro ETF, Global Echo ETF, Madrona Domestic ETF, Madrona Global Bond ETF, Madrona International ETF, Meidell Tactical Advantage ETF, Morgan Creek Global Tactical ETF, Newfleet MultiSector Income ETF, Pacific Asset Enhanced Floating Rate ETF, Peritus High Yield ETF, Pring Turner Business Cycle ETF, QAM Equity Hedge ETF, Ranger Equity Bear ETF, Sage Core Reserves ETF, STAR Global Buy-Write ETF, Sunrise Global Multi-Strategy ETF, TrimTabs Float Shrink ETF, WCM/BNY Mellon Focused Growth ADR ETF, and YieldPro ETF, as of June 30, 2015, and the results of their operations, their cash flows (for Accuvest Global Long Short ETF, QAM Equity Hedge ETF, and Ranger Equity Bear ETF), the changes in their net assets and their financial highlights for the periods indicated thereon, in conformity with accounting principles generally accepted in the United States of America. In our opinion, the consolidated financial statements and consolidated financial highlights referred to above present fairly, in all material respects, the consolidated financial position of Gartman Gold/Euro ETF and Gartman Gold/Yen ETF as of June 30, 2015, and the results of their consolidated operations, the consolidated changes in their net assets and their consolidated financial highlights for the periods indicated thereon, in conformity with accounting principles generally accepted in the United States of America. TAIT, WELLER & BAKER LLP Philadelphia, Pennsylvania August 28, 2015 187
192) ADVISORSHARES TRUST Board of Trustees and Officers (Unaudited) The business of the Trust is managed under the direction of the Trust’s Board of Trustees. The Board elects the officers of the Trust who are responsible for administering the Trust’s day-to-day operations. Each Trustee serves until his or her successor is duly elected or appointed and qualified. The name, age, address, and principal occupations during the past five years for each Trustee and officer of the Trust is set forth below, along with the other public directorships held by the Trustees. More information about the Trustees is in the Trust’s Statement of Additional Information, which is available without charge by calling 1-877-843-3831. Position(s) Held with the Trust, Term of Office and Length of Time Served Name, Address, and Year of Birth Principal Occupation(s) During Past 5 Years Number of Portfolios in Fund Complex Overseen by Trustee Other Directorships Held by Trustee During Past 5 Years 23 None Interested Trustee Noah Hamman* 4800 Montgomery Lane, Suite 150 Bethesda, MD 20814 (1968) Trustee President of AdvisorShares Trust (no set term); (2009 − present); Chief Executive served since 2009 Officer, President, and Founder of AdvisorShares Investments, LLC (2006 − present). Independent Trustees Elizabeth (‘‘Betsy’’) Piper/Bach 4800 Montgomery Lane, Suite 150 Bethesda, MD 20814 (1952) Trustee Vice President/Chief Operating Officer of (no set term); NADA Retirement Administrators, served since 2009 Inc. (2009 − present). 23 None William G. McVay 4800 Montgomery Lane, Suite 150 Bethesda, MD 20814 (1954) Trustee Founder of RDK Strategies, LLC (no set term); (2007 − present). served since 2011 23 None President President of AdvisorShares Trust (no set term); (2009 − present); Chief Executive served since 2009 Officer, President, and Founder of AdvisorShares Investments, LLC (2006 − present). N/A N/A Officers Noah Hamman 4800 Montgomery Lane, Suite 150 Bethesda, MD 20814 (1968) 188
193) ADVISORSHARES TRUST Board of Trustees and Officers (Unaudited) (Continued) Name, Address, and Year of Birth Position(s) Held with the Trust, Term of Office and Length of Time Served Principal Occupation(s) During Past 5 Years Number of Portfolios in Fund Complex Overseen by Trustee Other Directorships Held by Trustee During Past 5 Years Secretary & Treasurer (no set terms); served since 2009 Managing Director of AdvisorShares Investments, LLC (2013 − present); Chief Compliance Officer of the Trust (2009 − 2013); Executive Vice President of AdvisorShares Investments, LLC (2008 − 2013). N/A N/A Chief Compliance Stefanie Little Officer 11 Gina Marie Lane (no set term); Elkton, MD served since 2013 21921 (1967) Chief Compliance Officer of AdvisorShares Investments, LLC and the Trust (2013 − present); Managing Member of SEC Compliance Alliance, LLC (2012 − present), President of Little Consulting Group, Inc. (2011 − present); Director of Cipperman Compliance Services (2008 − 2011). N/A N/A Dan Ahrens 4144 N. Central Expressway, Suite 600 Dallas, TX 75204 (1966) * Mr. Hamman is an ‘‘interested’’ person of the Trust, as that term is defined in the 1940 Act, by virtue of his ownership and controlling interest in the Advisor. 189
194) Board Review of Investment Advisory and Sub-Advisory Agreements Renewal of the Advisory Agreement for Each Fund and the Sub-Advisory Agreement for the AdvisorShares Peritus High Yield ETF, AdvisorShares Meidell Tactical Advantage ETF, AdvisorShares TrimTabs Float Shrink ETF, AdvisorShares Pring Turner Business Cycle ETF, AdvisorShares Newfleet Multi-Sector Income ETF, AdvisorShares Accuvest Global Long Short ETF, and AdvisorShares Sage Core Reserves ETF At meetings of the Board of Trustees (the ‘‘Board’’) of AdvisorShares Trust (the ‘‘Trust’’) held on February 23, 2015 and May 13, 2015, the Board, including those trustees who are not ‘‘interested persons’’ of the Trust, as that term is defined in the Investment Company Act of 1940 (the ‘‘1940 Act’’) (the ‘‘Independent Trustees’’), unanimously approved the renewal of (a) separate sub-advisory agreements (collectively, the ‘‘Sub-Advisory Agreements’’) between AdvisorShares Investments, LLC (the ‘‘Advisor’’) and (1) Peritus I Asset Management, LLC, on behalf of the AdvisorShares Peritus High Yield ETF, (2) American Wealth Management, on behalf of the AdvisorShares Meidell Tactical Advantage ETF, (3) TrimTabs Asset Management, LLC, on behalf of the AdvisorShares TrimTabs Float Shrink ETF, (4) Pring Turner Capital Group, on behalf of the AdvisorShares Pring Turner Business Cycle ETF, (5) Newfleet Asset Management, on behalf of the AdvisorShares Newfleet Multi-Sector Income ETF, (6) Accuvest Global Advisors, on behalf of the AdvisorShares Accuvest Global Long Short ETF, and (7) Sage Advisory Services Ltd. Co., on behalf of the AdvisorShares Sage Core Reserves ETF (collectively, the ‘‘Sub-Advisors’’), pursuant to which the Sub-Advisors perform portfolio management and related services for the Funds, and (b) the investment advisory agreement (together with the Sub-Advisory Agreements, the ‘‘Advisory Agreements’’) between the Advisor and the Trust, on behalf of each series of the Trust (each a ‘‘Fund’’ and collectively, the ‘‘Funds’’). Pursuant to Section 15 of the 1940 Act, to continue after their initial two-year term, the Advisory Agreements must be approved annually: (i) by the vote of the Board or by a vote of the shareholders of the Funds and (ii) by the vote of a majority of the Independent Trustees, cast in person at a meeting called for the purpose of voting on such approval. Each year, the Board calls and holds meetings to decide whether to renew the Advisory Agreements for an additional one-year term. In preparation for the meetings, the Board requests and reviews a wide variety of information from the Advisor and Sub-Advisors. The Board uses this information, as well as other information that the Advisor, Sub-Advisors and other service providers may submit to the Board, to help decide whether to renew the Advisory Agreements for an additional year. Prior to the meetings, the Board, including the Independent Trustees, reviewed written materials from the Advisor and each Sub-Advisor regarding, among other things: (i) the nature, extent and quality of the services provided by the Advisor and each Sub-Advisor; (ii) the investment performance of each Fund; (iii) the costs of the services provided and profits and other benefits realized by the Advisor, each Sub-Advisor, and their affiliates from the relationship with each Fund; (iv) the personnel and operations of each Sub-Advisor; (v) the extent to which economies of scale would be realized as each Fund grows; and (vi) whether fee levels reflect the sharing of these economies of scale for the benefit of each Fund’s shareholders, as discussed in further detail below. At the meetings, the Board was presented with additional information to help it evaluate the Advisor’s and each Sub-Advisor’s fee and other aspects of the Advisory Agreements. The Board received an overview of the Advisor’s and Sub-Advisor’s operations and management of the Funds, including comparative fee data and profitability analysis for each Fund, and was also provided with information with respect to compliance oversight. The Board reviewed the management of each Fund, including the Fund’s strategy, the focus in the markets, the Fund’s positioning in the market, and its attractive and unique offering. The Board reviewed the Advisor’s and each Sub-Advisor’s overall business generally, including any noteworthy personnel changes. The Board deliberated on the renewal of the Advisory Agreements in light of the written materials that it received before the meetings, information it received at the meetings, and information it had received at prior board meetings. In its 190
195) Board Review of Investment Advisory and Sub-Advisory Agreements (Continued) deliberations, the Board considered the factors and reached the conclusions described below relating to the selection of the Advisor and each Sub-Advisor and the renewal of each Advisory Agreement. The Board did not identify any single piece of information discussed below that was all-important, controlling or determinative of its decision. Nature, Extent and Quality of Services In considering the nature, extent and quality of the services provided by the Advisor and each Sub-Advisor, the Board reviewed the portfolio management services provided to the Funds. The Board also noted the extensive responsibilities that the Advisor has as investment adviser to the Funds, including the selection of the Funds’ sub-advisers and oversight of the sub-advisers’ compliance with Fund policies and objectives, oversight of general Fund compliance with federal laws, and the implementation of Board directives as they relate to the Funds. The most recent Form ADV for the Advisor and each Sub-Advisor also was provided to the Board, as were the responses of the Advisor and each Sub-Advisor to a detailed series of questions that requested, among other things, information about the background and experience of the portfolio managers primarily responsible for the day-to-day management of the Funds. The Board also considered the Advisor’s and each Sub-Advisor’s overall quality of personnel, operations, and financial condition, its investment advisory capabilities, and information concerning the Advisor’s and each Sub-Advisor’s compliance function, operational capabilities, and portfolio management team. Based on the factors above, as well as those discussed below, the Board concluded that it was satisfied with the nature, extent and quality of the services provided to the Funds by the Advisor and each Sub-Advisor. Performance of the Funds The Board was provided with information regarding each Fund’s performance for various periods, as well as comparative performance information. The Advisor and each Sub-Advisor provided information regarding factors impacting the performance of the Funds, outlining current market conditions, and explaining its expectations and strategies for the future. In particular, a representative from Accuvest Global Advisors addressed the performance of the AdvisorShares Accuvest Global Long Short ETF and discussed strategies to improve its performance. Based on the information provided by the Advisor and each Sub-Advisor, the Board concluded that generally it was satisfied with the investment results that the Advisor and each Sub-Advisor had been able to achieve for its respective Fund. Cost of Advisory Services, Profitability, and Economies of Scale In concluding that the advisory and sub-advisory fees payable with respect to each Fund were reasonable, the Board reviewed the advisory fees paid by each Fund to the Advisor, the sub-advisory fees paid by the Advisor to each Sub-Advisor, the fees waived and/or expenses reimbursed by the Advisor and each Sub-Advisor over the period, the costs and other expenses incurred by the Advisor and each Sub-Advisor in providing advisory services, and the profitability analysis with respect to each Fund. The Board also reviewed information comparing the advisory fees paid by each Fund to those paid by comparable funds. The Board concluded for each Fund that the advisory fees appeared reasonable in light of the services rendered. In addition, the Board considered for each Fund whether economies of scale were realized during the current contract period and concluded that no significant economies of scale had yet been achieved. 191
196) Board Review of Investment Advisory and Sub-Advisory Agreements (Continued) Conclusion Based on the Board’s deliberations and its evaluation of the information described above, the Board, including all of the Independent Trustees, unanimously: (i) concluded that the terms of each Advisory Agreement are fair and reasonable; (ii) concluded that the Advisor’s fees are reasonable in light of the services that it provides to the Funds; (iii) concluded that each Sub-Advisor’s fees are reasonable in light of the services that it provides to its respective Fund; and (iv) agreed to renew each Advisory Agreement for another year. Approval of New and Interim Sub-Advisory Agreements for AdvisorShares TrimTabs Float Shrink ETF On May 31, 2015, TrimTabs Asset Management, LLC (‘‘TrimTabs’’) concluded a transaction with Silk Partners, L.P., an affiliate of Siget NY Partners, LP, a Family Office of Simon Glick and Seymour Pluchenik, pursuant to which a wholly-owned subsidiary of Silk Partners, L.P. acquired a controlling interest in TrimTabs (the ‘‘Transaction’’). The Transaction caused a change of control of TrimTabs under the 1940 Act, resulting in the assignment and automatic termination of the investment sub-advisory agreement dated May 9, 2011 between the Advisor and TrimTabs with respect to the AdvisorShares TrimTabs Float Shrink ETF (the ‘‘Fund’’) (the ‘‘Prior Sub-Advisory Agreement’’). In anticipation of the Transaction, at a meeting of the Board held on May 27, 2015, the Board, including the Independent Trustees, considered the approval of a new sub-advisory agreement between the Advisor and TrimTabs (the ‘‘New Sub-Advisory Agreement’’), on behalf of the Fund, noting that it had considered and approved the annual renewal of the Prior Sub-Advisory Agreement at its February 23, 2015 meeting. The Board also considered and approved an interim sub-advisory agreement that became effective at the termination of the Prior Sub-Advisory Agreement and is intended to continue in effect until the New Sub-Advisory Agreement is approved by shareholders of the Fund. With respect to the Board’s consideration and approval, references below to the New Sub-Advisory Agreement also refer to the interim sub-advisory agreement. At the meetings, the Board reviewed and discussed information and analysis provided by TrimTabs and the Advisor. At the May meeting, the Board also reviewed and discussed information provided by Silk Partners, L.P. regarding the Transaction. All of this information formed the primary, but not exclusive, basis for the Board’s determination. Below is a summary of the factors considered by the Board and the conclusions that formed the basis for the Board’s approval. The Board did not identify any single piece of information discussed below that was all-important, controlling or determinative of its decision. Nature, Extent and Quality of the Services to be Provided In considering the nature, extent and quality of the services provided by TrimTabs, the Board reviewed the portfolio management services provided to the Fund. The most recent Form ADV for TrimTabs also was provided to the Board, as were the TrimTabs’ responses to a detailed series of questions that requested, among other things, information about the background and experience of the portfolio managers primarily responsible for the day-to-day management of the Fund. The Board also considered TrimTabs’ overall quality of personnel, operations, and financial condition, its investment advisory capabilities, and information concerning its compliance function, operational capabilities, and portfolio management team. The Board noted that TrimTabs generally does not expect any change in its resources or capabilities as a result of the Transaction except that it expects to have additional financial resources available to it in the future. Based on the factors above, as well as those discussed below, the Board concluded that it was satisfied with the nature, extent and quality of the services provided to the Fund by TrimTabs. 192
197) Board Review of Investment Advisory and Sub-Advisory Agreements (Continued) Performance The Board was provided information regarding the Fund’s performance. Information also was provided regarding factors impacting the performance of the Fund, outlining current market conditions, and explaining its expectations and strategies for the future. Based on this information, the Board concluded that it was satisfied with the investment results that TrimTabs has been able to achieve for the Fund. Cost of Services, Profitability, and Economies of Scale In concluding that the sub-advisory fee payable with respect to the Fund was reasonable, the Board reviewed the sub-advisory fee paid by the Advisor to TrimTabs, the fees waived and/or expenses reimbursed by TrimTabs over the period, the costs and other expenses incurred by TrimTabs in providing advisory services, and the profitability analysis with respect to the Fund. The Board also reviewed information comparing the advisory fees paid by the Fund to those paid by comparable funds. The Board noted that the proposed fee under the New Sub-Advisory Agreement is the same as the fee under the Prior Sub-Advisory Agreement. The Board concluded that the fee appeared reasonable in light of the services rendered. In addition, the Board considered whether economies of scale were realized during the period of the Prior Sub-Advisory Agreement and concluded that no significant economies of scale had yet been achieved. Conclusion Based on its deliberations and evaluation of the information described above, the Board, including the Independent Trustees, concluded that the terms of the New Sub-Advisory Agreement, including the fee, are fair and reasonable in light of the services that TrimTabs provides to the Fund. For these reasons, the Board unanimously approved the New Sub-Advisory Agreement. 193
198) SUPPLEMENTAL INFORMATION Quarterly Portfolio Holdings Information The Funds are required to file their complete schedule of portfolio holdings with the SEC for their first and third quarters on Form N-Q. Copies of the filings are available without charge on the SEC’s website at www.sec.gov. You can also obtain copies of Form N-Q by visiting the SEC’s Public Reference Room in Washington, DC. Information on the operation of the Public Reference Room may be obtained by calling 1-800-SEC-0330. Proxy Voting Information A description of the Funds proxy voting policies and procedures, as well as a record of how the Funds voted proxies during the most recent 12-month period ended June 30, is available without charge upon request by calling 1-877-843-3831. This information is also available on the SEC’s website at www.sec.gov. Premium/Discount Information Information about the differences between the daily market price on the secondary market for the shares of a Fund and the Fund’s net asset value may be found on the Fund’s website at http://www.advisorshares.com. 194
199) ADVISORSHARES TRUST Investment Advisor AdvisorShares Investments, LLC 4800 Montgomery Lane, Suite 150 Bethesda, MD 20814 Sub-Advisors WCM Investment Management 281 Brooks Street Laguna Beach, CA 92651 Madrona Funds, LLC 2911 Bond Street, Suite 105 Everett, WA 98201 Accuvest Global Advisors 3100 Oak Road, Suite 380 Walnut Creek, CA 94597 Morgan Creek Capital Management, LLC 301 West Barbee Chapel Road, Suite 200 Chapel Hill, NC 27517 Ranger Alternative Management, L.P. 300 Crescent Court, Suite 1100 Dallas, TX 75201 Peritus I Asset Management, LLC 26 West Anapamu, 3rd Floor Santa Barbara, CA 93103 American Wealth Management 570 Hammill Lane Reno, NV 89511 TrimTabs Asset Management, LLC 2018 Stony Oak Court Santa Rosa, CA 95403 Community Capital Management, Inc. 2500 Weston Road, Suite 101 Weston, FL 33331 Partnervest Advisory Services, LLC 1216 State Street, 3rd Floor Santa Barbara, CA 93101 Pring Turner Capital Group 1600 South Main Street, Suite 375 Walnut Creek, CA 94596 Commerce Asset Management, LLC 6075 Poplar Avenue, Suite 700 Memphis, TN 38119 The Elements Financial Group, LLC 19200 Von Karman Avenue, Suite 800 Irvine, CA 92612 AthenaInvest, Inc. 5340 South Quebec Street, Suite 365-N Greenwood Village, CO 80111 Treesdale Partners, LLC 1325 Avenue of the Americas, Suite 2302 New York, NY 10019 Sage Advisory Services, Ltd. Co. 5900 Southwest Parkway, Building I Austin, TX 78735 Sunrise Capital Partners LLC 12544 High Bluff Drive, Suite 400 San Diego, CA 92130 Pacific Life Fund Advisors, LLC 700 Newport Center Drive Newport Beach, CA 92660 Distributor Foreside Fund Services, LLC Three Canal Plaza, Suite 100 Portland, ME 04101 Custodian/Fund Administrator/Transfer Agent Reynders, McVeigh Capital Management, LLC 121 High Street, 5th Floor Boston, MA 02110 The Bank of New York Mellon 101 Barclay Street New York, NY 10286 Baldwin Brothers, Inc. 204 Spring Street Marion, MA 02738 Legal Counsel Newfleet Asset Management, LLC 100 Pearl Street Hartford, CN 06103 Morgan, Lewis & Bockius LLP 2020 K Street, N.W. Washington, DC 20006 Independent Registered Public Accounting Firm Tait, Weller & Baker LLP 1818 Market Street, Suite 2400 Philadelphia, PA 19103
200) This report is submitted for the general information of the shareholders of the Fund. It is not authorized for distribution to prospective investors unless preceded or accompanied by an effective prospectus, which includes information regarding the Fund’s risks, objectives, fees and expenses, experience of management and other information.