1) QUARTERLY
Artisan High Income Fund
Fact Sheet
Investor Class: ARTFX
|
Advisor Class: APDFX
As of 31 December 2016
Portfolio Details
Investment Process Highlights
Net Asset Value (NAV)
The investment team seeks to invest in issuers with high-quality business models that have
compelling risk-adjusted return characteristics. The team will invest primarily in
non-investment grade corporate bonds and secured and unsecured loans of US and
non-US issuers.
Inception
30-Day SEC Yield
ARTFX
Expense Ratios
1.03%
1.09%
Annual Report 30 Sep 2016
Prospectus 30 Sep 2015
Business Quality
â– Qualitative industry analysis
â– Evaluate business model resiliency using Porter’s 5 Forces
â– Examine management decision-making history
APDFX
$9.86
$9.86
19 Mar 2014 19 Mar 2014
5.41%
5.62%
0.84%
0.93%
$1,878
Total AUM (Millions)1
AUM as of 31 Dec 2016.
1
Portfolio Statistics
Financial Strength & Flexibility
â– Free cash flow analysis
â– Corporate structure review
â– Capital structure review
Fund
Number of Securities
116
76
Number of Issuers
Source: Artisan Partners.
Top 10 Holdings (% of total portfolio)
6.0
5.4
Williams Cos Inc
4.0
Charter Communications Inc
3.6
Kronos Inc
3.3
Opal Acquisition Inc
3.2
HUB Holdings LLC
3.2
Endeavor Energy Resources LP
3.2
York Risk Services Holding Corp
3.1
Altice SA
3.1
TOTAL
38.1%
Source: Artisan Partners/Bloomberg. For the purpose of determining the Portfolio’s
holdings, securities of the same issuer are aggregated to determine the weight in the
Portfolio.
VEREIT Inc
Downside Analysis
â– Conservative financial projections
â– Competitive dynamics
â– Capital structure position
â– Enterprise value support
USI Inc
Value Identification
â– Credit improvement opportunities
â– Relative value within the capital structure
â– Credit cycle awareness
â– Catalysts with optionality
â– Dislocation exploitation
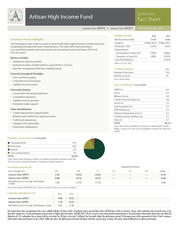
Portfolio Composition (% of total portfolio)
Corporate Bonds
74.9
Bank Loans
20.0
Equities
0.6
Cash and Equivalents
TOTAL
4.5
100.0%
Source: Artisan Partners/Bloomberg. Negative cash weightings and portfolio composition greater than
100% may be due to unsettled transactions or investment in derivative instruments.
Average Annual Total Returns
Investment Results (%)
As of 31 December 2016
QTD1
Investor Class: ARTFX
Advisor Class: APDFX
BofA Merrill Lynch US High Yield Master
II Index
YTD1
1 Yr
3 Yr
5 Yr
10 Yr
Inception
1.95
2.00
14.52
14.72
14.52
14.72
—
—
—
—
—
—
6.10
6.26
1.88
17.49
17.49
4.08
Source: Artisan Partners/BofA Merrill Lynch. 1Returns for periods less than one year are not annualized.
Calendar Year Returns (%)
Investor Class: ARTFX
Advisor Class: APDFX
BofA Merrill Lynch US High Yield Master II Index
2015
2016
0.99
1.18
-4.64
14.52
14.72
17.49
Past performance does not guarantee and is not a reliable indicator of future results. Investment returns and principal values will fluctuate so that an investor's shares, when redeemed, may be worth more or less
than their original cost. Current performance may be lower or higher than that shown. Call 800.344.1770 for current to most recent month-end performance. The performance information shown does not reflect the
deduction of a 2% redemption fee on shares held by an investor for 90 days or less and, if reflected, the fee would reduce the performance quoted. Performance may reflect agreements to limit a Fund’s expenses,
which would reduce performance if not in effect. Unlike the Index, the High Income Fund may hold loans and other security types. At times, this causes material differences in relative performance.
�
2) Artisan High Income Fund
Investor Class: ARTFX
Credit Quality
|
Advisor Class: APDFX
Team Leadership
BBB
12.8
BB
19.0
B
36.8
CCC
29.4
CC
0.6
Unrated
TOTAL
1.4
100.0%
Source: S&P/Moody's.
Portfolio Manager
Bryan C. Krug, CFA
Years of Investment Experience
16
Maturity Distribution
< 1 Year
0.5
1 - <3 years
5.0
3 - <5 years
24.7
5 - <7 years
32.7
7 - <10 years
36.1
10+ years
TOTAL
1.0
100.0%
Source: Artisan Partners/Bloomberg. Percentages shown are of total fixed income
securities in the portfolio.
Portfolio Construction
The team generally determines the amount of assets invested
in each issuer based on conviction, valuation and availability
of supply. Based on the team’s analysis it divides the portfolio
into three parts. Core investments are generally positions with
stable to improving credit profiles and lower loan to value
ratios. Spread investments are those where the team has an
out-of-consensus view about a company’s credit
improvement potential. Opportunistic investments are driven
by market dislocations that have created a unique investment
opportunity. Allocations to each group will vary over time
based on market conditions.
Carefully consider the Fund’s investment objective, risks and charges and expenses. This and other important information is
contained in the Fund's prospectus and summary prospectus, which can be obtained by calling 800.344.1770. Read carefully
before investing.
Fixed income securities carry interest rate risk and credit risk for both the issuer and counterparty and investors may lose principal value.
In general, when interest rates rise, fixed income values fall. High income securities (junk bonds) are speculative, experience greater price
volatility and have a higher degree of credit and liquidity risk than bonds with a higher credit rating. The portfolio typically invests a
significant portion of its assets in lower-rated high income securities (e.g., CCC). Loans carry risks including insolvency of the borrower,
lending bank or other intermediary. Loans may be secured, unsecured, or not fully collateralized, trade infrequently, experience delayed
settlement, and be subject to resale restrictions. Private placement and restricted securities may not be easily sold due to resale restrictions
and are more difficult to value. The use of derivatives in a portfolio may create investment leverage and increase the likelihood of
volatility and risk of loss in excess of the amount invested. International investments involve special risks, including currency fluctuation,
lower liquidity, different accounting methods and economic and political systems, and higher transaction costs. These risks typically are
greater in emerging markets.
BofA Merrill Lynch US High Yield Master II Index measures the performance of below investment grade $US-denominated corporate bonds publicly
issued in the US market. J.P. Morgan Leveraged Loan Index is designed to mirror the investable universe of the USD-denominated institutional
leveraged loan market. The index(es) are unmanaged; include net reinvested dividends; do not reflect fees or expenses; and are not available for
direct investment.
All information in this report includes all classes of shares, except performance and expense ratio information and as otherwise indicated, and is as
of the date shown in the upper right hand corner unless otherwise indicated. Artisan Partners may exclude outliers when calculating portfolio
statistics. If certain information is unavailable for a particular security Artisan Partners may use data from a related security to calculate portfolio
characteristics. Portfolio statistics include accrued interest unless otherwise stated and may vary from the official books and records of the Fund.
Totals may not sum due to rounding.
Source Merrill Lynch, Pierce, Fenner & Smith Incorporated (“BofAML”), used with permission. BofAML permits use of the BofAML indices and
related data on an "as is" basis, makes no warranties regarding same, does not guarantee the suitability, quality, accuracy, timeliness, and/or
completeness of the BofAML indices or any data included in, related to, or derived therefrom, assumes no liability in connection with the use of the
foregoing, and does not sponsor, endorse, or recommend Artisan Partners or any of its products or services.
30-Day SEC Yield is based on a formula specified by the SEC that calculates a fund's hypothetical annualized income, as a percentage of its assets.
This hypothetical yield will differ from the fund's actual experience and as a result, income distributions from the fund may be higher or lower.
Credit Quality ratings are from S&P and/or Moody's. Ratings typically range from AAA (highest) to D (lowest) and are subject to change. The
ratings apply to underlying holdings of the Portfolio and not the Portfolio itself. If securities are rated by both agencies, the higher rating was used.
Securities not rated by S&P or Moody's are categorized as Unrated/Not Rated. Maturity Distribution represents the weighted average of the
maturity dates of the securities held in the Portfolio. Free Cash Flow is a measure of financial performance calculated as operating cash flow minus
capital expenditures.
Porter’s 5 Forces: Adapted with the permission of The Free Press, a Division of Simon & Schuster Adult Publishing Group, from Competitive
Advantage: Creating and Sustaining Superior Performance by Michael E. Porter. ©1985,1998 by Michael E. Porter. All rights reserved.
Artisan Partners Funds offered through Artisan Partners Distributors LLC (APDLLC), member FINRA. APDLLC is a wholly owned broker/dealer
subsidiary of Artisan Partners Holdings LP. Artisan Partners Limited Partnership, an investment advisory firm and adviser to Artisan Partners Funds, is
wholly owned by Artisan Partners Holdings LP.
© 2017 Artisan Partners. All rights reserved.
1/12/2017 A16731L_vR
Not FDIC Insured | No Bank Guarantee | May Lose Value
ARTFX_FS_vR
�