Description
Preparing for liftoff
april 2015
Second, global central bank policy, disinflation pressures, and eco-
Bottom-line: The ability for the Fed to hike policy rates or for
(Chart 4). This weighs down U.S. Treasury yields by driving capi-
a focus on intermediate credit, in particular BBB rated bonds, re-
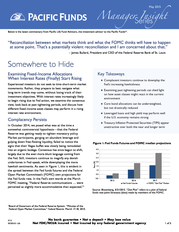
nomic risks abroad may constrain the Fed and Treasury yields.
With global central bankers engaging in aggressive QE, sovereign
yields have plunged to levels not seen in modern economic history
tal flows to more attractive sovereign securities. Further, the U.S.
economy is not an island, and low global growth rates may weigh
on U.S.
GDP. The world is pushing down the U.S. yield curve, pro- viding incentive to a slower pace of policy from Fed officials.
Given these factors, we may very well see a repeat of the last cycle, where intermediate and longer duration securities outperform. Chart 4: U.S. Treasury yields are among the highest in the developed world 8 10-Year Sovereign yield (%) 7 6 5 4 3 2 Italy 2012 are not advocating for an extension in duration. Instead, we believe mains our preferred investment grade area. There is a considerable amount of intellectual energy focused on U.S.
monetary policy and the actions of the Federal Reserve. However, this tightening cycle may have other influences and help determine things just as important as driving bond returns over the next few years. Can the U.S.
economy finally be able to stand on its own? Is our financial system stronger today than prior to the cri- sis? Are risk assets valued appropriately? As the current Chair of the Fed would say, these questions are “data dependent”. April 2015 France 2012 by growth, disinflation pressures, and global monetary policy. We Pacific Asset Management Spain U.S. Germany 1 0 2012 Treasury yields to move to previously seen levels will be limited 2013 2013 2013 2013 Japan 2014 2014 2014 2014 2015 Source: Barclays, as of April 31, 2015 ABOUT PACIFIC ASSET MANAGEMENT Founded in 2007, Pacific Asset Management specializes in credit oriented fixed income strategies. Pacific Asset Management is a division of Pacific Life Fund Advisors LLC, an SEC registered investment adviser and a wholly owned subsidiary of Pacific Life Insurance Company (Pacific Life).
As of March 31, 2015 Pacific Asset Management managed approximately $4.8bn. Assets managed by Pacific Asset Management includes assets managed at Pacific Life by the investment professionals of Pacific Asset Management. IMPORTANT NOTES AND DISCLOSURES Bank loan, corporate securities, and high yield bonds involve risk of default on interest and principal payments or price changes due to changes in credit quality of the borrower, among other risks. Pacific Asset Management is an investment advisor; it provides investment advisory services to institutional clients and does not sell securities.
Pacific Select Distributors, Inc. is the distributor for Pacific Life’s retail products. Pacific Asset Management and Pacific Select Distributors, Inc.
are each a wholly owned subsidiary of Pacific Life. This information is presented for informational purposes only. This is not to be construed as an offer to buy or sell any financial instruments and should not be relied upon as the sole investment making decision. All material is compiled from sources believed to be reliable, but accuracy cannot be guaranteed.
The opinions expressed herein are based on current market conditions, are subject to change without notice. Investors should consider the investment objectives, risks, charges and expenses carefully before investing. Please read the applicable prospectus or other offering documents carefully before investing.
For this and more complete information about the available investment vehicles, investors should contact their financial advisor, consultant or visit www.pacificlife.com or www.pam.pacificlife.com. FOR MORE INFORMATION Pacific Asset Management • 700 Newport Center Drive • Newport Beach, CA 92660 • www.pam.pacificlife.com 3 .