Artisan High Income Fund ARTFX - Monthly Commentary - As of 31 December 2016
Artisan Partners

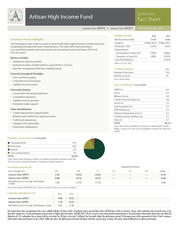
Description
Artisan High Income Fund
Investor Class: ARTFX
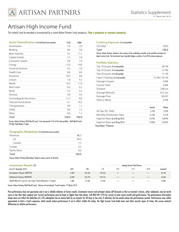
Credit Quality (%)
|
Advisor Class: APDFX
Team Leadership
BBB
12.8
BB
19.0
B
36.8
CCC
29.4
CC
0.6
Unrated
TOTAL
1.4
100.0%
Source: S&P/Moody's.
Portfolio Manager
Bryan C. Krug, CFA
Years of Investment Experience
16
Maturity Distribution (%)
< 1 Year
0.5
1 - <3 years
5.0
3 - <5 years
24.7
5 - <7 years
32.7
7 - <10 years
36.1
10+ years
TOTAL
1.0
100.0%
Source: Artisan Partners/Bloomberg. Percentages shown are of total fixed income
securities in the portfolio.
Portfolio Construction
The team generally determines the amount of assets invested
in each issuer based on conviction, valuation and availability
of supply. Based on the team’s analysis it divides the portfolio
into three parts.
Core investments are generally positions with stable to improving credit profiles and lower loan to value ratios. Spread investments are those where the team has an out-of-consensus view about a company’s credit improvement potential. Opportunistic investments are driven by market dislocations that have created a unique investment opportunity.
Allocations to each group will vary over time based on market conditions. Carefully consider the Fund’s investment objective, risks and charges and expenses. This and other important information is contained in the Fund's prospectus and summary prospectus, which can be obtained by calling 888.454.1770. Read carefully before investing. Fixed income securities carry interest rate risk and credit risk for both the issuer and counterparty and investors may lose principal value. In general, when interest rates rise, fixed income values fall.
High income securities (junk bonds) are speculative, experience greater price volatility and have a higher degree of credit and liquidity risk than bonds with a higher credit rating. The portfolio typically invests a significant portion of its assets in lower-rated high income securities (e.g., CCC). Loans carry risks including insolvency of the borrower, lending bank or other intermediary.
Loans may be secured, unsecured, or not fully collateralized, trade infrequently, experience delayed settlement, and be subject to resale restrictions. Private placement and restricted securities may not be easily sold due to resale restrictions and are more difficult to value. The use of derivatives in a portfolio may create investment leverage and increase the likelihood of volatility and risk of loss in excess of the amount invested.
International investments involve special risks, including currency fluctuation, lower liquidity, different accounting methods and economic and political systems, and higher transaction costs. These risks typically are greater in emerging markets. BofA Merrill Lynch US High Yield Master II Index measures the performance of below investment grade $US-denominated corporate bonds publicly issued in the US market. J.P.
Morgan Leveraged Loan Index is designed to mirror the investable universe of the USD-denominated institutional leveraged loan market. The index(es) are unmanaged; include net reinvested dividends; do not reflect fees or expenses; and are not available for direct investment. For the purpose of determining the Fund’s holdings, securities of the same issuer are aggregated to determine the weight in the Fund. The discussion of portfolio holdings does not constitute a recommendation of any individual security.
Securities named in the Commentary, but not listed as a Top Ten Holding or not listed here are not held in the Fund as of the date of this report. The portfolio managers’ views and portfolio holdings are subject to change and the Fund disclaims any obligation to advise investors of such changes. All information in this report includes all classes of shares, except performance and expense ratio information and as otherwise indicated, and is as of the date shown in the upper right hand corner unless otherwise indicated. Artisan Partners may exclude outliers when calculating portfolio statistics.
If certain information is unavailable for a particular security Artisan Partners may use data from a related security to calculate portfolio characteristics. Portfolio statistics include accrued interest unless otherwise stated and may vary from the official books and records of the Fund. Totals may not sum due to rounding. Source Merrill Lynch, Pierce, Fenner & Smith Incorporated (“BofAML”), used with permission. BofAML permits use of the BofAML indices and related data on an "as is" basis, makes no warranties regarding same, does not guarantee the suitability, quality, accuracy, timeliness, and/or completeness of the BofAML indices or any data included in, related to, or derived therefrom, assumes no liability in connection with the use of the foregoing, and does not sponsor, endorse, or recommend Artisan Partners or any of its products or services. 30-Day SEC Yield is based on a formula specified by the SEC that calculates a fund's hypothetical annualized income, as a percentage of its assets. This hypothetical yield will differ from the fund's actual experience and as a result, income distributions from the fund may be higher or lower. Credit Quality ratings are from S&P and/or Moody's.
Ratings typically range from AAA (highest) to D (lowest) and are subject to change. The ratings apply to underlying holdings of the Portfolio and not the Portfolio itself. If securities are rated by both agencies, the higher rating was used. Securities not rated by S&P or Moody's are categorized as Unrated/Not Rated.
Maturity Distribution represents the weighted average of the maturity dates of the securities held in the Portfolio. Artisan Partners Funds offered through Artisan Partners Distributors LLC (APDLLC), member FINRA. APDLLC is a wholly owned broker/dealer subsidiary of Artisan Partners Holdings LP. Artisan Partners Limited Partnership, an investment advisory firm and adviser to Artisan Partners Funds, is wholly owned by Artisan Partners Holdings LP. © 2017 Artisan Partners.
All rights reserved. Not FDIC Insured | No Bank Guarantee | May Lose Value 1/10/2017 A16730L_vIS For Financial Advisor Use Only. Not for Distribution to the Public. ARTFX_Mcomm_vIS .