
Description
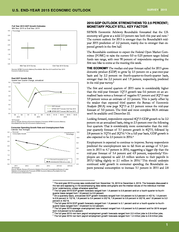
U.S. END-YEAR 2015 ECONOMIC OUTLOOK
SURVEY | 2015
ECONOMIC ADVISORY ROUNDTABLE
Ethan Harris (Chair)
Bank of America Merrill Lynch
Michael Gapen
Barclays Capital Inc.
James Sweeney
Credit Suisse AG
Michael Moran
Daiwa Capital Markets America, Inc.
Joseph LaVorgna
Deutsche Bank Securities Inc.
Christopher Low
FTN Financial
Jan Hatzius
Goldman, Sachs & Co.
Ward McCarthy
Jefferies & Co., Inc.
Michael Feroli
J.P. Morgan Chase & Co.
Diane Swonk
Mesirow Financial, Inc.
John Lonski
Moody’s Analytics, Inc.
Ellen Zentner
Morgan Stanley & Co. Inc.
Alexander Lewis
Nomura Securities International, Inc.
Stuart Hoffman
PNC Financial Services Group
Scott J.
Brown Raymond James & Associates, Inc. Aneta Markowska Société Générale Corporate and Investment Banking Beth Ann Bovino Standard & Poor's Rating Services Maury Harris UBS Securities, LLC John Silvia Wells Fargo Securities, LLC SIFMA Staff Advisors Kyle Brandon Managing Director, Director of Research Sharon Sung Assistant Vice President, Research Justyna Podziemska Senior Associate, Research The report is subject to the Terms of Use applicable to SIFMA's website, available here: http://www.sifma.org/legal/ SIFMA is the voice of the U.S. securities industry, representing the broker-dealers, banks and asset managers whose 889,000 employees provide access to the capital markets, raising over $2.4 trillion for businesses and municipalities in the U.S., serving clients with over $16 trillion in assets and managing more than $62 trillion in assets for individual and institutional clients including mutual funds and retirement plans. SIFMA, with offices in New York and Washington, D.C., is the U.S.
regional member of the Global Financial Markets Association (GFMA). For more information, visit http://www.sifma.org. 6 .


Economic Conditions Sub Categories
SIFMA


