First Trust/Confluence Small Cap Value Fund – as of December 31, 2015
First Trust Portfolios

Description
FIRST TRUST/CONFLUENCE SMALL CAP VALUE FUND
AS OF 12/31/15
PORTFOLIO INFORMATION
INVESTMENT ADVISOR
INVESTMENT MANAGER
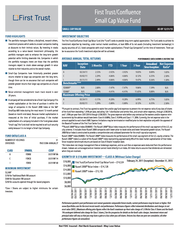
INDUSTRY BREAKDOWN
First Trust Advisors L.P. is the Investment Advisor to the Fund and
has been serving broker/dealers, individuals, and institutional
investors from its Chicago-area headquarters since 1991.
• Experienced asset manager/supervisor
• Provider of innovative financial solutions
• Long-term strategic investor nationally recognized for its
fundamental and
quantitative strategies
Confluence Investment Management LLC, founded in 2007, is an
independent
registered
investment
advisor
located in St. Louis, Missouri.
The firm specializes in equity portfolio management, asset
allocation portfolio management and alternative investment
management. The investment professionals have more than 300
years of combined financial experience and 100 years of
portfolio management experience.
INDUSTRY TYPE
n Machinery
n Health Care Equipment & Supplies
n Insurance
n Health Care Providers & Services
n Real Estate Investment Trusts (REITs)
n Electrical Equipment
n Textiles, Apparel & Luxury Goods
n Diversiï¬ed Financial Services
n Food Products
n Real Estate Management & Development
n Banks
n Electronic Equip., Instruments & Components
n Hotels, Restaurants & Leisure
n Road & Rail
n Life Sciences Tools & Services
n Air Freight & Logistics
n Professional Services
n Capital Markets
n Industrial Conglomerates
n Commercial Services & Supplies
TOP TEN HOLDINGS AS OF 10/30/15
John Bean Technologies Corp.
VCA, Inc.
Morningstar, Inc.
Snyder’s-Lance, Inc.
RE/MAX Holdings, Inc., Class A
Bank of Marin Bancorp.
Patterson Cos., Inc.
Landstar System, Inc.
Graco, Inc.
Brown & Brown, Inc.
PERCENT
10.32%
10.17%
10.09%
7.96%
6.40%
5.71%
5.70%
4.26%
4.04%
4.01%
3.85%
3.58%
3.45%
3.36%
3.27%
3.16%
3.11%
2.96%
2.90%
1.70%
PERCENT
4.61%
4.53%
4.45%
4.28%
4.14%
3.92%
3.77%
3.70%
3.69%
3.63%
Industry allocation and holdings are subject to change and companies referenced in this fact sheet may not be currently held.
Information is current as of the creation of this sheet. Portfolio holdings are subject to risks. Market value information used in calculating the percentages is based upon trade date plus one recording of transactions, which can differ from regulatory financial reports (Forms N-CSR and N-Q) that are based on trade date recording of security transactions. FUND CHARACTERISTICS Median Market Cap.* Maximum Market Cap.* Minimum Market Cap.* Price/Earnings Ratio Price/Book Ratio Price/Cash Flow Ratio Price/Sales Ratio *Market capitalization numbers are in USD$ Millions. $1,452 $4,525 $315 25.08 2.43 17.04 1.63 You should consider the Fund’s investment objectives, risks, and charges and expenses carefully before investing. Contact First Trust Portfolios L.P. at 1-800-621-1675 or visit www.ftportfolios.com to obtain a prospectus or summary prospectus which contains this and other information about the Fund.
The prospectus or summary prospectus should be read carefully before investing. WHAT ARE THE RISKS? You could lose money by investing in the Fund. A mutual fund’s share price and investment return will vary with market conditions, and the principal value of an investment when you sell your shares may be more or less than the original cost. BDC RISK. The Fund may invest in Business Development Companies (BDCs) which may carry risks similar to those of a private equity or venture capital fund.
BDCs are not redeemable at the option of the shareholder and they may trade in the market at a discount to their net asset value. The BDCs held by the Fund may employ the use of leverage their portfolios through borrowings or the issuance of preferred stock. While leverage often serves to increase the yield of a BDC, this leverage also subjects a BDC to increased risks, including the likelihood of increased volatility and the possibility that a BDC’s common share income will fall if the dividend rate of the preferred shares or the interest rate on any borrowings rises. CONCENTRATION RISK.
A fund concentrated in a single industry or sector is likely to present more risks than a fund that is broadly diversified over several industries or sectors. Compared to the broad market, an individual industry or sector may be more strongly affected by changes in the economic climate, broad market shifts, moves in a particular dominant stock, or regulatory changes. EQUITY SECURITIES RISK. Because the Fund invests in equity securities, the value of Fund shares will fluctuate with changes in the value of these equity securities. Equity securities prices fluctuate for several reasons, including changes in investors’ perceptions of the financial condition of an issuer or the general condition of the relevant stock market, such as the current market volatility, or when political or economic events affecting the issuers occur.
In addition, common stock prices may be particularly sensitive to rising interest rates, as the cost of capital rises and borrowing costs increase. FINANCIAL COMPANIES RISK. Financial companies are especially subject to the adverse effects of economic recession, currency exchange rates, government regulation, decreases in the availability of capital, volatile interest rates, portfolio concentrations in geographic markets and in commercial and residential real estate loans, and competition from new entrants in their fields of business. INDUSTRIALS AND PRODUCER DURABLES COMPANIES RISK. The Fund invests in the securities of industrials and producer durables companies, which convert unfinished goods into finished durables used to manufacture other goods or provide services. These companies produce electrical equipment and components, industrial products, manufactured housing and telecommunications equipment.
General risks of these companies include the general state of the economy, intense competition, consolidation, domestic and international politics, excess capacity and consumer demand and spending trends. In addition, they may also be significantly affected by overall capital spending levels, economic cycles, technical obsolescence, delays in modernization, labor relations, government regulations and e-commerce initiatives. INVESTMENT COMPANIES RISK. If the Fund invests in investment companies, Fund shareholders bear both their proportionate share of Fund expenses and, indirectly, the expenses of the investment companies.
Also, the investment companies are subject to the risks of the underlying securities that they hold. In addition, the Fund will incur brokerage costs when purchasing and selling shares of exchange-traded funds (“ETFs”) and closed-end investment companies. Closed-end investment companies may be leveraged, in which case the value and/or yield of their shares will tend to be more volatile than shares of unleveraged funds.
In addition, for index-based ETFs, the performance of an ETF may diverge from the performance of such index (commonly known as tracking error). Moreover, shares of closed-end investment companies and ETFs may be sold at a discount from their net asset value. MARKET CAPITALIZATION RISK. The Fund normally invests at least 80% of its assets in Small-Cap Companies.
Because the market capitalization is measured at the time of its initial purchase, the Fund will not be forced to sell a stock because the stock has exceeded or fallen below the market capitalization range. Because of market movement, there can be no assurance that the securities held by the Fund will stay within the given market capitalization range. As a result, the Fund may be exposed to additional risk or investors may not be given the opportunity to invest fully in a certain market capitalization range. First Trust Portfolios L.P.
• 120 E. Liberty Drive • Wheaton, IL 60187 • 800-621-1675 • www.ftportfolios.com • MEMBER: SIPC & FINRA MARKET RISK. Market risk is the risk that a particular security owned by the Fund or shares of the Fund in general may fall in value. Securities are subject to market fluctuations caused by such factors as economic, political, regulatory or market developments, changes in interest rates and perceived trends in securities prices.
Shares of the Fund could decline in value or underperform other investments. REAL ESTATE INVESTMENT RISK. The Fund invests in companies in the real estate industry, including REITs. Therefore, the Fund is subject to the risks associated with investing in real estate, which may include, but are not limited to, fluctuations in the value of underlying properties; defaults by borrowers or tenants; market saturation; changes in general and local economic conditions; decreases in market rates for rents; increases in competition, property taxes, capital expenditures or operating expenses; and other economic, political or regulatory occurrences affecting companies in the real estate industry. REIT INVESTMENT RISK.
Because the Fund invests in REITs, the Fund is subject to the risks associated with investing in real estate, which may include, but are not limited to, fluctuations in the value of underlying properties; defaults by borrowers or tenants; market saturation; changes in general and local operating expenses; and other economic, political or regulatory occurrences affecting companies in the real estate industry. In addition to risks related to investments in real estate generally, investing in REITs involves certain other risks related to their structure and focus, which include, but are not limited to, dependency upon management skills, limited diversification, the risks of locating and managing financing for projects, heavy cash flow dependency, possible default by borrowers, the costs and potential losses of self-liquidation of one or more holdings, the risk of a possible lack of mortgage funds and associated interest rate risks, overbuilding, property vacancies, increases in property taxes and operating expenses, changes in zoning laws, losses due to environmental damages, changes in neighborhood values and appeal to purchasers, the possibility of failing to maintain exemptions from registration under the 1940 Act and, in many cases, relatively small market capitalization, which may result in less market liquidity and greater price volatility. REITs are also subject to the risk that the real estate market may experience an economic downturn generally, which may have a material effect on the real estate in which the REITs invest and their underlying portfolio securities. SMALL CAP RISK.
The Fund invests in Small-Cap Companies. Such companies may be more vulnerable to adverse general market or economic developments, and their securities may be less liquid and may experience greater price volatility than larger, more established companies as a result of several factors, including limited trading volumes, products or financial resources, management inexperience and dependence on a few key people, and less publicly available information. Accordingly, such companies are generally subject to greater market risk than larger, more established companies.
The market movements of equity securities issued by issuers with smaller capitalizations may be more abrupt or erratic than the market movements of equity securities of larger, more established companies or the stock market in general. Historically, smaller capitalization companies have sometimes gone through extended periods when they did not perform as well as larger companies. In addition, equity securities of Small-Cap Companies may be less liquid than those of larger companies. SMALL FUND RISK.
The Fund currently has fewer assets than larger funds, and like other relatively smaller funds, large inflows and outflows may impact the Fund’s market exposure for limited periods of time. This impact may be positive or negative, depending on the direction of market movement during the period affected. VALUE INVESTING RISK. The Fund focuses its investments on securities that the portfolio managers believe are undervalued or inexpensive relative to other investments.
These types of securities may present risks in addition to the general risks associated with investing in them. These securities generally are selected on the basis of an issuer’s business and economic fundamentals or the securities’ current and projected credit profiles, relative to current market price. Such securities are subject to the risk of misestimating certain fundamental factors. Disciplined adherence to a “value” investment mandate during periods in which that style is “out of favor” can result in significant underperformance relative to overall market indices and other managed investment vehicles that pursue growth style investments and/or flexible style mandates. MUTUALSC0116 .