Description
BARROW
VALUE OPPORTUNITY FUND
FUNDS
Value Principles
l
December 31, 2016
Private Equity Perspective
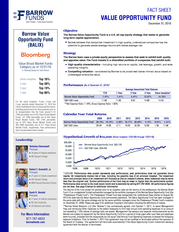
Volatility Summary
(From 12/31/08 - 12/31/16)
Downside Deviation
Sortino Ratio
Standard Deviation
Sharpe Ratio
Barrow Value Opportunity Fund
8.15%
1.82
14.21%
1.05
S&P 500 Index
8.32
1.75
14.12
1.03
Note: The Portfolio Managers believe that Downside Deviation (“DD”) and Sortino Ratio (Return/DD) are more relevant
measures of volatility than Standard Deviation “SD” and Sharpe Ratio (Return/SD). While Standard Deviation measures
all volatility, including upside or “good” volatility, Downside Deviation only measures downside or “bad” volatility.
See the Important Information section below for further information.
Capture Ratio
(From 12/31/08 - 12/31/16)
Value Opportunity Fund vs. S&P 500 Index
Upside Capture
Downside Capture
Capture Ratio
99.3
96.5
103.0
Important Information
Mutual fund investing involves risk. Principal loss is possible.
The Fund’s investment objectives, risks, charges and expenses must be considered carefully before investing. The prospectus contains this and other important information about the Fund and may be obtained by calling 1-877-767-6633. Read it carefully before investing.
Distributed by Ultimus Fund Distributors LLC. This fact sheet is for educational purposes only and should not constitute investment advice. The Value Opportunity Fund’s investment goals, policies, guidelines and restrictions are, in all material respects, equivalent to the Predecessor Private Fund’s investment goals, policies, guidelines and restrictions. The information shows the Predecessor Private Fund’s annual returns and long-term performance reflecting the actual fees and expenses that were charged when the Value Opportunity Fund was a limited partnership.
The prior performance is net of management fees and other expenses but does not include the effect of the performance fee which was in place until October 7 2012. From its inception on December 31 2008 through the date of this prospectus the Predecessor Private Fund was not subject to certain investment restrictions, diversification requirements and other restrictions of the Investment Company Act of 1940 as amended (the “1940 Act”) or Subchapter M of the Internal Revenue Code of 1986 as amended, which, if they had been applicable, might have adversely affected the Value Opportunity Fund’s performance. The information below provides some indications of the risks of investing in the Value Opportunity Fund. The investment return and principal value will fluctuate so that an investor’s shares, when redeemed, may be worth more or less than their original cost.
Current performance of the Fund may be lower or higher than the performance quoted. Performance data current to the most recent month-end is available by calling 1-877-767-6633. The Fund invests in small and mid cap companies, which involves additional risks such as limited liquidity and greater volatility. Market indices are included only to provide an overview of wider financial markets and should not be viewed as benchmarks or direct comparable of the Fund. The S&P 500 Index is an unmanaged index of equity prices and is representative of a broader market and range of securities than is found in the Fund’s portfolio.
The S&P 400 Index, is a stock market index from S&P Dow Jones Indices. The index serves as a barometer for the U.S. mid-cap equities sector and is the most widely followed mid-cap index.
The Russell 2000 Index is a small-cap stock market index of the bottom 2,000 stocks in the Russell 3000 Index. Investors cannot invest directly in an index. Return on Equity is the amount of net income returned as a percentage of shareholders equity.
Return on equity measures a corporation’s profitability by revealing how much profit a company generates with the money shareholders have invested. Return on Assets is an indicator of how profitable a company is relative to its total assets. Calculated by dividing a company’s annual earnings by its total assets.
Leverage Ratio is used to calculate the financial leverage of a company to get an idea of the company’s methods of financing or to measure its ability to meet financial obligations. Operating Margin is a measurement of what proportion of a company’s revenue is left over after paying for variable costs of production such as wages, raw materials, etc. Y/Y Sales Growth is a method of evaluating sales growth from the most recent 12 month period over the prior 12 month period.
EBITDA Multiple is a valuation measure that divides a company’s current enterprise value by its trailing 12 month EBITDA. PE Ratio (price earnings ratio) is a valuation ratio of a company’s current share price compared to its per-share earnings. Barrow Funds reports a “trailing PE Ratio” by taking the current share price and dividing by the total EPS over the past 12 months and caps the ratio limit at 100x.
12M Dividend Yield is a financial ratio that shows how much a company has paid out in dividends over the prior year relative to its share price. 30-Day SEC Yield is the fund’s income, for the purposes of this calculation, based on the current market yield to maturity of the Fund’s holdings over a trailing 30-day period. This hypothetical income will differ (at times, significantly) from the Fund’s actual experience; as a result, income distributions from the fund may be higher or lower than implied by the SEC yield. Downside Deviation is a measure of downside risk that focuses on returns that fall below a minimum threshold or minimum acceptable return. Sortino Ratio differentiates harmful volatility from volatility in general by using a value for downside deviation. The Sortino Ratio is the excess return over the risk-free rate divided by the downside semivariance and so it measures the return to “bad” volatility.
Standard Deviation shows the degree of variation in the Fund’s returns and can serve as a useful measure of the Fund’s volatility. It is measured using monthly observations but expresses the result on an annualized basis. Sharpe Ratio is a statistical measure that uses standard deviation and excess return to determine reward per unit of volatility.
A higher Sharpe Ratio implies a better historical volatility performance. Upside and Downside Capture Ratios show you whether a given fund has outperformed—gained more or lost less than a broad market benchmark during periods of market strength and weakness and if so, by how much. Upside capture ratios for funds are calculated by taking the fund’s monthly return during months when the benchmark had a positive return and dividing it by the benchmark return during that same month. Downside capture ratios are calculated by taking the fund’s monthly return during the periods of negative benchmark performance and dividing it by the benchmark return.
Capture Ratio is the upside capture divided by the downside capture. .