Stocks Swoon, Interest Rates Rise, Energy Prices Fall, and Ag Struggles – January 21, 2016
CliftonLarsenAllen


Description
Market and Economic
Outlook
January 2016
Tax Information
Find these topics of interest at
CLAconnect.com/tax:
• Key Individual and Business Tax Rates
for the 2016 Tax Year
• New Congressional Spending Bill
Affects Individuals and Businesses
• Like-Kind Exchange Tax Incentive
Requires Attention to Detail
Stocks Swoon, Interest Rates Rise, Energy Prices Fall, and Ag Struggles
The first week of January saw the worst start ever for the Dow Jones Industrial Average. The S&P 500 and world stock
markets have not fared much better; the S&P 500 is down about 8 percent year-to-date through mid-January. However,
long-term stock investors should expect these occasional declines even though they are painful as they occur.
Looking back, we can see that the last few years in the U.S. stock market have been remarkably calm, with most volatility
to the upside.
But last fall, we had the first 10 percent decline in more than three years. History tells us that 10 percent corrections tend to occur about every 12 months, so we were long overdue. The question is, why is the market falling? We believe that several factors are at work here: • Decreased expectations for Chinese economic growth (the second largest economy in the world) • Federal Reserve is now on a path to higher interest rates • A strong U.S.
dollar impacting exports • The continuing decline in oil prices and commodities overall • High stock valuations relative to history • Credit markets tightening, especially in the energy space • Corporate earnings expectations being lowered CLAconnect.com/privateclient ©2016 CliftonLarsonAllen Wealth Advisors, LLC . Stocks Swoon, Interest Rates Rise, Energy Prices Fall, and Ag Struggles, January 2016 Market and Economic Outlook Energy price collapse affects stock and bond markets A contentious presidential election may also be weighing in. We will probably need to see some stabilization in oil prices and the U.S. dollar to help boost the flat corporate earnings growth we saw in 2015. Corporate earnings are the life blood for stocks and traction in earnings should help relieve the current swoon. Oil and energy-related investments have experienced severe downturns as oil prices fell on world markets, impacting both the stock and bond markets.
U.S. large-company investors are roughly even for the year (2015), while international, U.S. small company, and ‘value’ investors are sitting on 5 to 15 percent losses (2015). If this correction turns into a bear market (a decline lasting at least four months), what can we expect? Again, history tells us that bear markets typically last about one year with a total drawdown of 25 percent. Generally, corrections do not turn into bear markets unless accompanied by an economic recession, which does not appear likely at this time.
The good news in this is that future return expectations will be higher when the swoon ends. Furthermore, our portfolios are diversified with global stocks, bonds, and in some cases, private placement real estate. By utilizing several asset classes, we may get an opportunity to rebalance portfolios back to their original allocation levels (sell high, buy low). The impact of oil’s steep price decline on energy sector stocks has been widely reported.
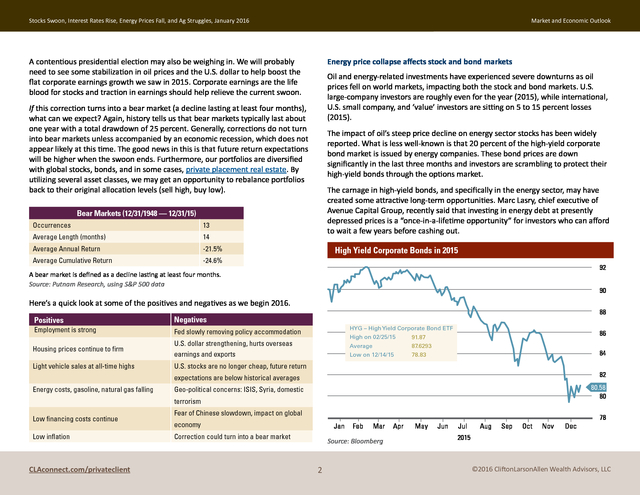
What is less well-known is that 20 percent of the high-yield corporate bond market is issued by energy companies. These bond prices are down significantly in the last three months and investors are scrambling to protect their high-yield bonds through the options market. The carnage in high-yield bonds, and specifically in the energy sector, may have created some attractive long-term opportunities. Marc Lasry, chief executive of Avenue Capital Group, recently said that investing in energy debt at presently depressed prices is a “once-in-a-lifetime opportunity” for investors who can afford to wait a few years before cashing out. Bear Markets (12/31/1948 — 12/31/15) Occurrences 13 Average Length (months) 14 Average Annual Return -21.5% Average Cumulative Return -24.6% High Yield Corporate Bonds in 2015 92 A bear market is defined as a decline lasting at least four months. Source: Putnam Research, using S&P 500 data 90 Here’s a quick look at some of the positives and negatives as we begin 2016. Positives 88 Negatives Employment is strong Housing prices continue to firm U.S.
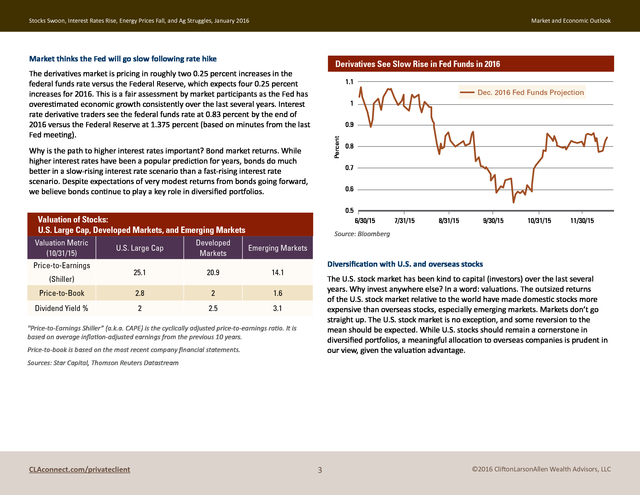
dollar strengthening, hurts overseas earnings and exports Light vehicle sales at all-time highs HYG – High Yield Corporate Bond ETF Fed slowly removing policy accommodation U.S. stocks are no longer cheap, future return High on 02/25/15 Average 87.6293 Low on 12/14/15 86 91.87 78.83 84 82 expectations are below historical averages Energy costs, gasoline, natural gas falling 80.58 80 Geo-political concerns: ISIS, Syria, domestic terrorism Low financing costs continue Low inflation CLAconnect.com/privateclient Fear of Chinese slowdown, impact on global economy Jan Correction could turn into a bear market Feb Mar Source: Bloomberg 2 Apr May Jun Jul Aug Sep Oct Nov Dec 78 2015 ©2016 CliftonLarsonAllen Wealth Advisors, LLC . Stocks Swoon, Interest Rates Rise, Energy Prices Fall, and Ag Struggles, January 2016 Market and Economic Outlook Market thinks the Fed will go slow following rate hike Derivatives See Slow Rise in Fed Funds in 2016 The derivatives market is pricing in roughly two 0.25 percent increases in the federal funds rate versus the Federal Reserve, which expects four 0.25 percent increases for 2016. This is a fair assessment by market participants as the Fed has overestimated economic growth consistently over the last several years. Interest rate derivative traders see the federal funds rate at 0.83 percent by the end of 2016 versus the Federal Reserve at 1.375 percent (based on minutes from the last Fed meeting). 1.1 Dec. 2016 Fed Funds Projection 1 Percent 0.9 Why is the path to higher interest rates important? Bond market returns.
While higher interest rates have been a popular prediction for years, bonds do much better in a slow-rising interest rate scenario than a fast-rising interest rate scenario. Despite expectations of very modest returns from bonds going forward, we believe bonds continue to play a key role in diversified portfolios. 0.7 0.6 0.5 Valuation of Stocks: U.S. Large Cap, Developed Markets, and Emerging Markets Valuation Metric (10/31/15) 0.8 6/30/15 7/31/15 8/31/15 9/30/15 10/31/15 11/30/15 Source: Bloomberg U.S.
Large Cap Developed Markets Emerging Markets 25.1 20.9 14.1 Price-to-Book 2.8 2 1.6 Dividend Yield % 2 2.5 3.1 Price-to-Earnings (Shiller) Diversification with U.S. and overseas stocks The U.S. stock market has been kind to capital (investors) over the last several years.
Why invest anywhere else? In a word: valuations. The outsized returns of the U.S. stock market relative to the world have made domestic stocks more expensive than overseas stocks, especially emerging markets.
Markets don’t go straight up. The U.S. stock market is no exception, and some reversion to the mean should be expected.
While U.S. stocks should remain a cornerstone in diversified portfolios, a meaningful allocation to overseas companies is prudent in our view, given the valuation advantage. “Price-to-Earnings Shiller” (a.k.a. CAPE) is the cyclically adjusted price-to-earnings ratio.
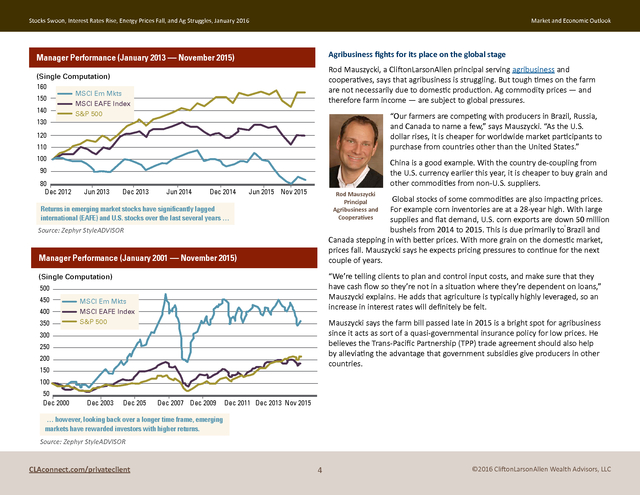
It is based on average inflation-adjusted earnings from the previous 10 years. Price-to-book is based on the most recent company financial statements. Sources: Star Capital, Thomson Reuters Datastream CLAconnect.com/privateclient 3 ©2016 CliftonLarsonAllen Wealth Advisors, LLC . Stocks Swoon, Interest Rates Rise, Energy Prices Fall, and Ag Struggles, January 2016 Market and Economic Outlook Manager Performance (January 2013 — November 2015) Agribusiness fights for its place on the global stage (Single Computation) 160 Rod Mauszycki, a CliftonLarsonAllen principal serving agribusiness and cooperatives, says that agribusiness is struggling. But tough times on the farm are not necessarily due to domestic production. Ag commodity prices — and therefore farm income — are subject to global pressures. 150 140 130 MSCI Em Mkts MSCI EAFE Index S&P 500 “Our farmers are competing with producers in Brazil, Russia, and Canada to name a few,” says Mauszycki. “As the U.S. dollar rises, it is cheaper for worldwide market participants to purchase from countries other than the United States.” 120 110 100 China is a good example.
With the country de-coupling from the U.S. currency earlier this year, it is cheaper to buy grain and other commodities from non-U.S. suppliers. 90 80 Dec 2012 Jun 2013 Dec 2013 Jun 2014 Dec 2014 Jun 2015 Nov 2015 Rod Mauszycki Principal Agribusiness and Cooperatives Global stocks of some commodities are also impacting prices. For example corn inventories are at a 28-year high.
With large supplies and flat demand, U.S. corn exports are down 50 million bushels from 2014 to 2015. This is due primarily to Brazil and Canada stepping in with better prices.
With more grain on the domestic market, prices fall. Mauszycki says he expects pricing pressures to continue for the next couple of years. Returns in emerging market stocks have significantly lagged international (EAFE) and U.S. stocks over the last several years … Source: Zephyr StyleADVISOR Manager Performance (January 2001 — November 2015) “We’re telling clients to plan and control input costs, and make sure that they have cash flow so they’re not in a situation where they’re dependent on loans,” Mauszycki explains.
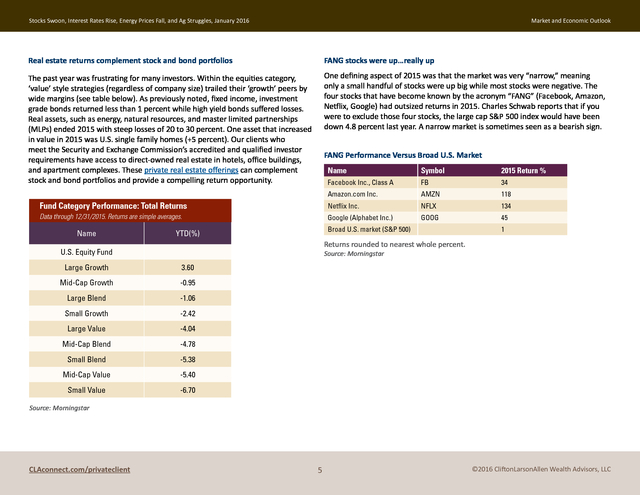
He adds that agriculture is typically highly leveraged, so an increase in interest rates will definitely be felt. (Single Computation) 500 450 MSCI Em Mkts 400 MSCI EAFE Index 350 S&P 500 Mauszycki says the farm bill passed late in 2015 is a bright spot for agribusiness since it acts as sort of a quasi-governmental insurance policy for low prices. He believes the Trans-Pacific Partnership (TPP) trade agreement should also help by alleviating the advantage that government subsidies give producers in other countries. 300 250 200 150 100 50 Dec 2000 Dec 2003 Dec 205 Dec 2007 Dec 2009 Dec 2011 Dec 2013 Nov 2015 … however, looking back over a longer time frame, emerging markets have rewarded investors with higher returns. Source: Zephyr StyleADVISOR CLAconnect.com/privateclient 4 ©2016 CliftonLarsonAllen Wealth Advisors, LLC . Stocks Swoon, Interest Rates Rise, Energy Prices Fall, and Ag Struggles, January 2016 Market and Economic Outlook Real estate returns complement stock and bond portfolios FANG stocks were up…really up The past year was frustrating for many investors. Within the equities category, ‘value’ style strategies (regardless of company size) trailed their ‘growth’ peers by wide margins (see table below). As previously noted, fixed income, investment grade bonds returned less than 1 percent while high yield bonds suffered losses. Real assets, such as energy, natural resources, and master limited partnerships (MLPs) ended 2015 with steep losses of 20 to 30 percent. One asset that increased in value in 2015 was U.S.
single family homes (+5 percent). Our clients who meet the Security and Exchange Commission’s accredited and qualified investor requirements have access to direct-owned real estate in hotels, office buildings, and apartment complexes. These private real estate offerings can complement stock and bond portfolios and provide a compelling return opportunity. One defining aspect of 2015 was that the market was very “narrow,” meaning only a small handful of stocks were up big while most stocks were negative.
The four stocks that have become known by the acronym “FANG” (Facebook, Amazon, Netflix, Google) had outsized returns in 2015. Charles Schwab reports that if you were to exclude those four stocks, the large cap S&P 500 index would have been down 4.8 percent last year. A narrow market is sometimes seen as a bearish sign. FANG Performance Versus Broad U.S.
Market Name Symbol 2015 Return % Facebook Inc., Class A FB 34 Amazon.com Inc. AMZN 118 Fund Category Performance: Total Returns Netflix Inc. NFLX 134 Data through 12/31/2015. Returns are simple averages. Google (Alphabet Inc.) GOOG 45 Name Broad U.S. market (S&P 500) YTD(%) 1 Returns rounded to nearest whole percent. U.S.
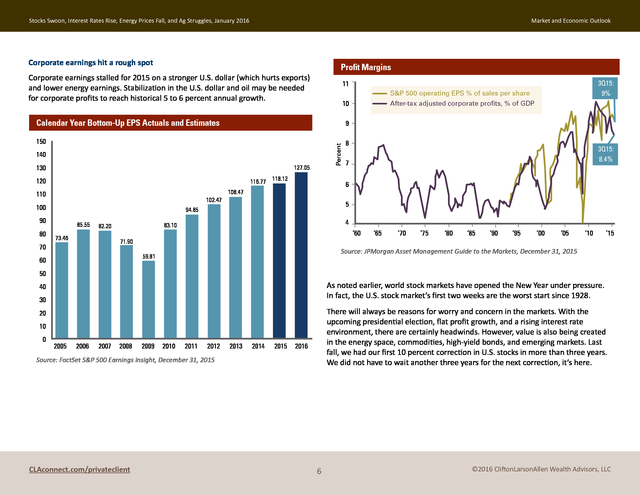
Equity Fund Source: Morningstar Large Growth 3.60 Mid-Cap Growth -0.95 Large Blend -1.06 Small Growth -2.42 Large Value -4.04 Mid-Cap Blend -4.78 Small Blend -5.38 Mid-Cap Value -5.40 Small Value -6.70 Source: Morningstar CLAconnect.com/privateclient 5 ©2016 CliftonLarsonAllen Wealth Advisors, LLC . Stocks Swoon, Interest Rates Rise, Energy Prices Fall, and Ag Struggles, January 2016 Market and Economic Outlook Corporate earnings hit a rough spot Profit Margins Corporate earnings stalled for 2015 on a stronger U.S. dollar (which hurts exports) and lower energy earnings. Stabilization in the U.S. dollar and oil may be needed for corporate profits to reach historical 5 to 6 percent annual growth. 3Q15: 9% 11 S&P 500 operating EPS % of sales per share 10 9 150 8 Percent Calendar Year Bottom-Up EPS Actuals and Estimates After-tax adjusted corporate profits, % of GDP 140 130 127.05 116.77 118.12 120 102.47 100 80 5 94.85 90 85.55 73.46 4 83.10 82.20 ‘60 71.90 70 ‘65 ‘70 ‘75 ‘80 ‘85 ‘90 ‘95 ‘00 ‘05 ‘10 ‘15 Source: JPMorgan Asset Management Guide to the Markets, December 31, 2015 59.81 60 7 6 108.47 110 3Q15: 8.4% 50 As noted earlier, world stock markets have opened the New Year under pressure. In fact, the U.S.
stock market’s first two weeks are the worst start since 1928. 40 30 There will always be reasons for worry and concern in the markets. With the upcoming presidential election, flat profit growth, and a rising interest rate environment, there are certainly headwinds. However, value is also being created in the energy space, commodities, high-yield bonds, and emerging markets.
Last fall, we had our first 10 percent correction in U.S. stocks in more than three years. We did not have to wait another three years for the next correction, it’s here. 20 10 0 2005 2006 2007 2008 2009 2010 2011 2012 2013 2014 2015 2016 Source: FactSet S&P 500 Earnings Insight, December 31, 2015 CLAconnect.com/privateclient 6 ©2016 CliftonLarsonAllen Wealth Advisors, LLC . Stocks Swoon, Interest Rates Rise, Energy Prices Fall, and Ag Struggles, January 2016 Market and Economic Outlook While the stock swoon could certainly get worse, this is difficult to see without the U.S. economy slipping into recession. Our banks and consumers are in much better shape than 2008 and while China and oil are concerning, it pales in comparison to the systemic risk the financial system faced in 2008. A diversified portfolio comprised of stocks, bonds, and real estate, and customized to meet your individual financial goals, is a well-known and accepted strategy for preserving and growing wealth over time. We wish you good health, wealth, and a prosperous New Year. CliftonLarsonAllen Wealth Advisors, LLC Investment Committee connect@CLAconnect.com CliftonLarsonAllen Wealth Advisors, LLC (“CLA Wealth Advisors”) The purpose of this publication is purely educational and informational.
It is not intended to promote any product or service and should not be relied on for accounting, legal, tax, or investment advice. The views expressed are those of CLA Wealth Advisors. They are subject to change at any time.
Past performance does not imply or guarantee future results. Investing entails risks, including possible loss of principal. Diversification cannot assure a profit or guarantee against a loss.
Investing involves other forms of risk that are not described here. For that reason, you should contact an investment professional before acting on any information in this publication. Financial information is from third party sources. Such information is believed to be reliable but is not verified or guaranteed.
Performances from any indices in this report are presented without factoring fees or charges, and are provided for reference and competitive purposes only. Any fees, charges, or holdings different than the indices will effect individual results. Indexes are unmanaged; one cannot invest directly into an index.
Investment advisory services are offered through CliftonLarsonAllen Wealth Advisors, LLC, an SEC-registered investment advisor. Prior approval is required for further distribution of this material. CLAconnect.com/privateclient 7 ©2016 CliftonLarsonAllen Wealth Advisors, LLC .
But last fall, we had the first 10 percent decline in more than three years. History tells us that 10 percent corrections tend to occur about every 12 months, so we were long overdue. The question is, why is the market falling? We believe that several factors are at work here: • Decreased expectations for Chinese economic growth (the second largest economy in the world) • Federal Reserve is now on a path to higher interest rates • A strong U.S.
dollar impacting exports • The continuing decline in oil prices and commodities overall • High stock valuations relative to history • Credit markets tightening, especially in the energy space • Corporate earnings expectations being lowered CLAconnect.com/privateclient ©2016 CliftonLarsonAllen Wealth Advisors, LLC . Stocks Swoon, Interest Rates Rise, Energy Prices Fall, and Ag Struggles, January 2016 Market and Economic Outlook Energy price collapse affects stock and bond markets A contentious presidential election may also be weighing in. We will probably need to see some stabilization in oil prices and the U.S. dollar to help boost the flat corporate earnings growth we saw in 2015. Corporate earnings are the life blood for stocks and traction in earnings should help relieve the current swoon. Oil and energy-related investments have experienced severe downturns as oil prices fell on world markets, impacting both the stock and bond markets.
U.S. large-company investors are roughly even for the year (2015), while international, U.S. small company, and ‘value’ investors are sitting on 5 to 15 percent losses (2015). If this correction turns into a bear market (a decline lasting at least four months), what can we expect? Again, history tells us that bear markets typically last about one year with a total drawdown of 25 percent. Generally, corrections do not turn into bear markets unless accompanied by an economic recession, which does not appear likely at this time.
The good news in this is that future return expectations will be higher when the swoon ends. Furthermore, our portfolios are diversified with global stocks, bonds, and in some cases, private placement real estate. By utilizing several asset classes, we may get an opportunity to rebalance portfolios back to their original allocation levels (sell high, buy low). The impact of oil’s steep price decline on energy sector stocks has been widely reported.
What is less well-known is that 20 percent of the high-yield corporate bond market is issued by energy companies. These bond prices are down significantly in the last three months and investors are scrambling to protect their high-yield bonds through the options market. The carnage in high-yield bonds, and specifically in the energy sector, may have created some attractive long-term opportunities. Marc Lasry, chief executive of Avenue Capital Group, recently said that investing in energy debt at presently depressed prices is a “once-in-a-lifetime opportunity” for investors who can afford to wait a few years before cashing out. Bear Markets (12/31/1948 — 12/31/15) Occurrences 13 Average Length (months) 14 Average Annual Return -21.5% Average Cumulative Return -24.6% High Yield Corporate Bonds in 2015 92 A bear market is defined as a decline lasting at least four months. Source: Putnam Research, using S&P 500 data 90 Here’s a quick look at some of the positives and negatives as we begin 2016. Positives 88 Negatives Employment is strong Housing prices continue to firm U.S.
dollar strengthening, hurts overseas earnings and exports Light vehicle sales at all-time highs HYG – High Yield Corporate Bond ETF Fed slowly removing policy accommodation U.S. stocks are no longer cheap, future return High on 02/25/15 Average 87.6293 Low on 12/14/15 86 91.87 78.83 84 82 expectations are below historical averages Energy costs, gasoline, natural gas falling 80.58 80 Geo-political concerns: ISIS, Syria, domestic terrorism Low financing costs continue Low inflation CLAconnect.com/privateclient Fear of Chinese slowdown, impact on global economy Jan Correction could turn into a bear market Feb Mar Source: Bloomberg 2 Apr May Jun Jul Aug Sep Oct Nov Dec 78 2015 ©2016 CliftonLarsonAllen Wealth Advisors, LLC . Stocks Swoon, Interest Rates Rise, Energy Prices Fall, and Ag Struggles, January 2016 Market and Economic Outlook Market thinks the Fed will go slow following rate hike Derivatives See Slow Rise in Fed Funds in 2016 The derivatives market is pricing in roughly two 0.25 percent increases in the federal funds rate versus the Federal Reserve, which expects four 0.25 percent increases for 2016. This is a fair assessment by market participants as the Fed has overestimated economic growth consistently over the last several years. Interest rate derivative traders see the federal funds rate at 0.83 percent by the end of 2016 versus the Federal Reserve at 1.375 percent (based on minutes from the last Fed meeting). 1.1 Dec. 2016 Fed Funds Projection 1 Percent 0.9 Why is the path to higher interest rates important? Bond market returns.
While higher interest rates have been a popular prediction for years, bonds do much better in a slow-rising interest rate scenario than a fast-rising interest rate scenario. Despite expectations of very modest returns from bonds going forward, we believe bonds continue to play a key role in diversified portfolios. 0.7 0.6 0.5 Valuation of Stocks: U.S. Large Cap, Developed Markets, and Emerging Markets Valuation Metric (10/31/15) 0.8 6/30/15 7/31/15 8/31/15 9/30/15 10/31/15 11/30/15 Source: Bloomberg U.S.
Large Cap Developed Markets Emerging Markets 25.1 20.9 14.1 Price-to-Book 2.8 2 1.6 Dividend Yield % 2 2.5 3.1 Price-to-Earnings (Shiller) Diversification with U.S. and overseas stocks The U.S. stock market has been kind to capital (investors) over the last several years.
Why invest anywhere else? In a word: valuations. The outsized returns of the U.S. stock market relative to the world have made domestic stocks more expensive than overseas stocks, especially emerging markets.
Markets don’t go straight up. The U.S. stock market is no exception, and some reversion to the mean should be expected.
While U.S. stocks should remain a cornerstone in diversified portfolios, a meaningful allocation to overseas companies is prudent in our view, given the valuation advantage. “Price-to-Earnings Shiller” (a.k.a. CAPE) is the cyclically adjusted price-to-earnings ratio.
It is based on average inflation-adjusted earnings from the previous 10 years. Price-to-book is based on the most recent company financial statements. Sources: Star Capital, Thomson Reuters Datastream CLAconnect.com/privateclient 3 ©2016 CliftonLarsonAllen Wealth Advisors, LLC . Stocks Swoon, Interest Rates Rise, Energy Prices Fall, and Ag Struggles, January 2016 Market and Economic Outlook Manager Performance (January 2013 — November 2015) Agribusiness fights for its place on the global stage (Single Computation) 160 Rod Mauszycki, a CliftonLarsonAllen principal serving agribusiness and cooperatives, says that agribusiness is struggling. But tough times on the farm are not necessarily due to domestic production. Ag commodity prices — and therefore farm income — are subject to global pressures. 150 140 130 MSCI Em Mkts MSCI EAFE Index S&P 500 “Our farmers are competing with producers in Brazil, Russia, and Canada to name a few,” says Mauszycki. “As the U.S. dollar rises, it is cheaper for worldwide market participants to purchase from countries other than the United States.” 120 110 100 China is a good example.
With the country de-coupling from the U.S. currency earlier this year, it is cheaper to buy grain and other commodities from non-U.S. suppliers. 90 80 Dec 2012 Jun 2013 Dec 2013 Jun 2014 Dec 2014 Jun 2015 Nov 2015 Rod Mauszycki Principal Agribusiness and Cooperatives Global stocks of some commodities are also impacting prices. For example corn inventories are at a 28-year high.
With large supplies and flat demand, U.S. corn exports are down 50 million bushels from 2014 to 2015. This is due primarily to Brazil and Canada stepping in with better prices.
With more grain on the domestic market, prices fall. Mauszycki says he expects pricing pressures to continue for the next couple of years. Returns in emerging market stocks have significantly lagged international (EAFE) and U.S. stocks over the last several years … Source: Zephyr StyleADVISOR Manager Performance (January 2001 — November 2015) “We’re telling clients to plan and control input costs, and make sure that they have cash flow so they’re not in a situation where they’re dependent on loans,” Mauszycki explains.
He adds that agriculture is typically highly leveraged, so an increase in interest rates will definitely be felt. (Single Computation) 500 450 MSCI Em Mkts 400 MSCI EAFE Index 350 S&P 500 Mauszycki says the farm bill passed late in 2015 is a bright spot for agribusiness since it acts as sort of a quasi-governmental insurance policy for low prices. He believes the Trans-Pacific Partnership (TPP) trade agreement should also help by alleviating the advantage that government subsidies give producers in other countries. 300 250 200 150 100 50 Dec 2000 Dec 2003 Dec 205 Dec 2007 Dec 2009 Dec 2011 Dec 2013 Nov 2015 … however, looking back over a longer time frame, emerging markets have rewarded investors with higher returns. Source: Zephyr StyleADVISOR CLAconnect.com/privateclient 4 ©2016 CliftonLarsonAllen Wealth Advisors, LLC . Stocks Swoon, Interest Rates Rise, Energy Prices Fall, and Ag Struggles, January 2016 Market and Economic Outlook Real estate returns complement stock and bond portfolios FANG stocks were up…really up The past year was frustrating for many investors. Within the equities category, ‘value’ style strategies (regardless of company size) trailed their ‘growth’ peers by wide margins (see table below). As previously noted, fixed income, investment grade bonds returned less than 1 percent while high yield bonds suffered losses. Real assets, such as energy, natural resources, and master limited partnerships (MLPs) ended 2015 with steep losses of 20 to 30 percent. One asset that increased in value in 2015 was U.S.
single family homes (+5 percent). Our clients who meet the Security and Exchange Commission’s accredited and qualified investor requirements have access to direct-owned real estate in hotels, office buildings, and apartment complexes. These private real estate offerings can complement stock and bond portfolios and provide a compelling return opportunity. One defining aspect of 2015 was that the market was very “narrow,” meaning only a small handful of stocks were up big while most stocks were negative.
The four stocks that have become known by the acronym “FANG” (Facebook, Amazon, Netflix, Google) had outsized returns in 2015. Charles Schwab reports that if you were to exclude those four stocks, the large cap S&P 500 index would have been down 4.8 percent last year. A narrow market is sometimes seen as a bearish sign. FANG Performance Versus Broad U.S.
Market Name Symbol 2015 Return % Facebook Inc., Class A FB 34 Amazon.com Inc. AMZN 118 Fund Category Performance: Total Returns Netflix Inc. NFLX 134 Data through 12/31/2015. Returns are simple averages. Google (Alphabet Inc.) GOOG 45 Name Broad U.S. market (S&P 500) YTD(%) 1 Returns rounded to nearest whole percent. U.S.
Equity Fund Source: Morningstar Large Growth 3.60 Mid-Cap Growth -0.95 Large Blend -1.06 Small Growth -2.42 Large Value -4.04 Mid-Cap Blend -4.78 Small Blend -5.38 Mid-Cap Value -5.40 Small Value -6.70 Source: Morningstar CLAconnect.com/privateclient 5 ©2016 CliftonLarsonAllen Wealth Advisors, LLC . Stocks Swoon, Interest Rates Rise, Energy Prices Fall, and Ag Struggles, January 2016 Market and Economic Outlook Corporate earnings hit a rough spot Profit Margins Corporate earnings stalled for 2015 on a stronger U.S. dollar (which hurts exports) and lower energy earnings. Stabilization in the U.S. dollar and oil may be needed for corporate profits to reach historical 5 to 6 percent annual growth. 3Q15: 9% 11 S&P 500 operating EPS % of sales per share 10 9 150 8 Percent Calendar Year Bottom-Up EPS Actuals and Estimates After-tax adjusted corporate profits, % of GDP 140 130 127.05 116.77 118.12 120 102.47 100 80 5 94.85 90 85.55 73.46 4 83.10 82.20 ‘60 71.90 70 ‘65 ‘70 ‘75 ‘80 ‘85 ‘90 ‘95 ‘00 ‘05 ‘10 ‘15 Source: JPMorgan Asset Management Guide to the Markets, December 31, 2015 59.81 60 7 6 108.47 110 3Q15: 8.4% 50 As noted earlier, world stock markets have opened the New Year under pressure. In fact, the U.S.
stock market’s first two weeks are the worst start since 1928. 40 30 There will always be reasons for worry and concern in the markets. With the upcoming presidential election, flat profit growth, and a rising interest rate environment, there are certainly headwinds. However, value is also being created in the energy space, commodities, high-yield bonds, and emerging markets.
Last fall, we had our first 10 percent correction in U.S. stocks in more than three years. We did not have to wait another three years for the next correction, it’s here. 20 10 0 2005 2006 2007 2008 2009 2010 2011 2012 2013 2014 2015 2016 Source: FactSet S&P 500 Earnings Insight, December 31, 2015 CLAconnect.com/privateclient 6 ©2016 CliftonLarsonAllen Wealth Advisors, LLC . Stocks Swoon, Interest Rates Rise, Energy Prices Fall, and Ag Struggles, January 2016 Market and Economic Outlook While the stock swoon could certainly get worse, this is difficult to see without the U.S. economy slipping into recession. Our banks and consumers are in much better shape than 2008 and while China and oil are concerning, it pales in comparison to the systemic risk the financial system faced in 2008. A diversified portfolio comprised of stocks, bonds, and real estate, and customized to meet your individual financial goals, is a well-known and accepted strategy for preserving and growing wealth over time. We wish you good health, wealth, and a prosperous New Year. CliftonLarsonAllen Wealth Advisors, LLC Investment Committee connect@CLAconnect.com CliftonLarsonAllen Wealth Advisors, LLC (“CLA Wealth Advisors”) The purpose of this publication is purely educational and informational.
It is not intended to promote any product or service and should not be relied on for accounting, legal, tax, or investment advice. The views expressed are those of CLA Wealth Advisors. They are subject to change at any time.
Past performance does not imply or guarantee future results. Investing entails risks, including possible loss of principal. Diversification cannot assure a profit or guarantee against a loss.
Investing involves other forms of risk that are not described here. For that reason, you should contact an investment professional before acting on any information in this publication. Financial information is from third party sources. Such information is believed to be reliable but is not verified or guaranteed.
Performances from any indices in this report are presented without factoring fees or charges, and are provided for reference and competitive purposes only. Any fees, charges, or holdings different than the indices will effect individual results. Indexes are unmanaged; one cannot invest directly into an index.
Investment advisory services are offered through CliftonLarsonAllen Wealth Advisors, LLC, an SEC-registered investment advisor. Prior approval is required for further distribution of this material. CLAconnect.com/privateclient 7 ©2016 CliftonLarsonAllen Wealth Advisors, LLC .


