


Description
December 2015
EXECUTIVE SUMMARY
•
•
®
®
CPA, CFP , CIMA
Partner,
Chief Investment Officer
Volatility returned to the equity markets in November, but most domestic
indices managed fractional gains by month end. Small caps led the pack,
though they still trail large caps year to date.
•
JIM BAIRD
U.S. economic indicators were generally positive in November as Q3 GDP
estimates were revised upward to 2.1% (from the earlier 1.5%) and
employment continued to strengthen.
International equities declined in November, although EAFE local-market
returns were positive. The strengthening dollar weighed on both developed and
emerging-market returns for U.S.-based investors.
•
With the exception of the Barclays 1-10 Year Muni Blend Index, most bond
indices were slightly negative for the month.
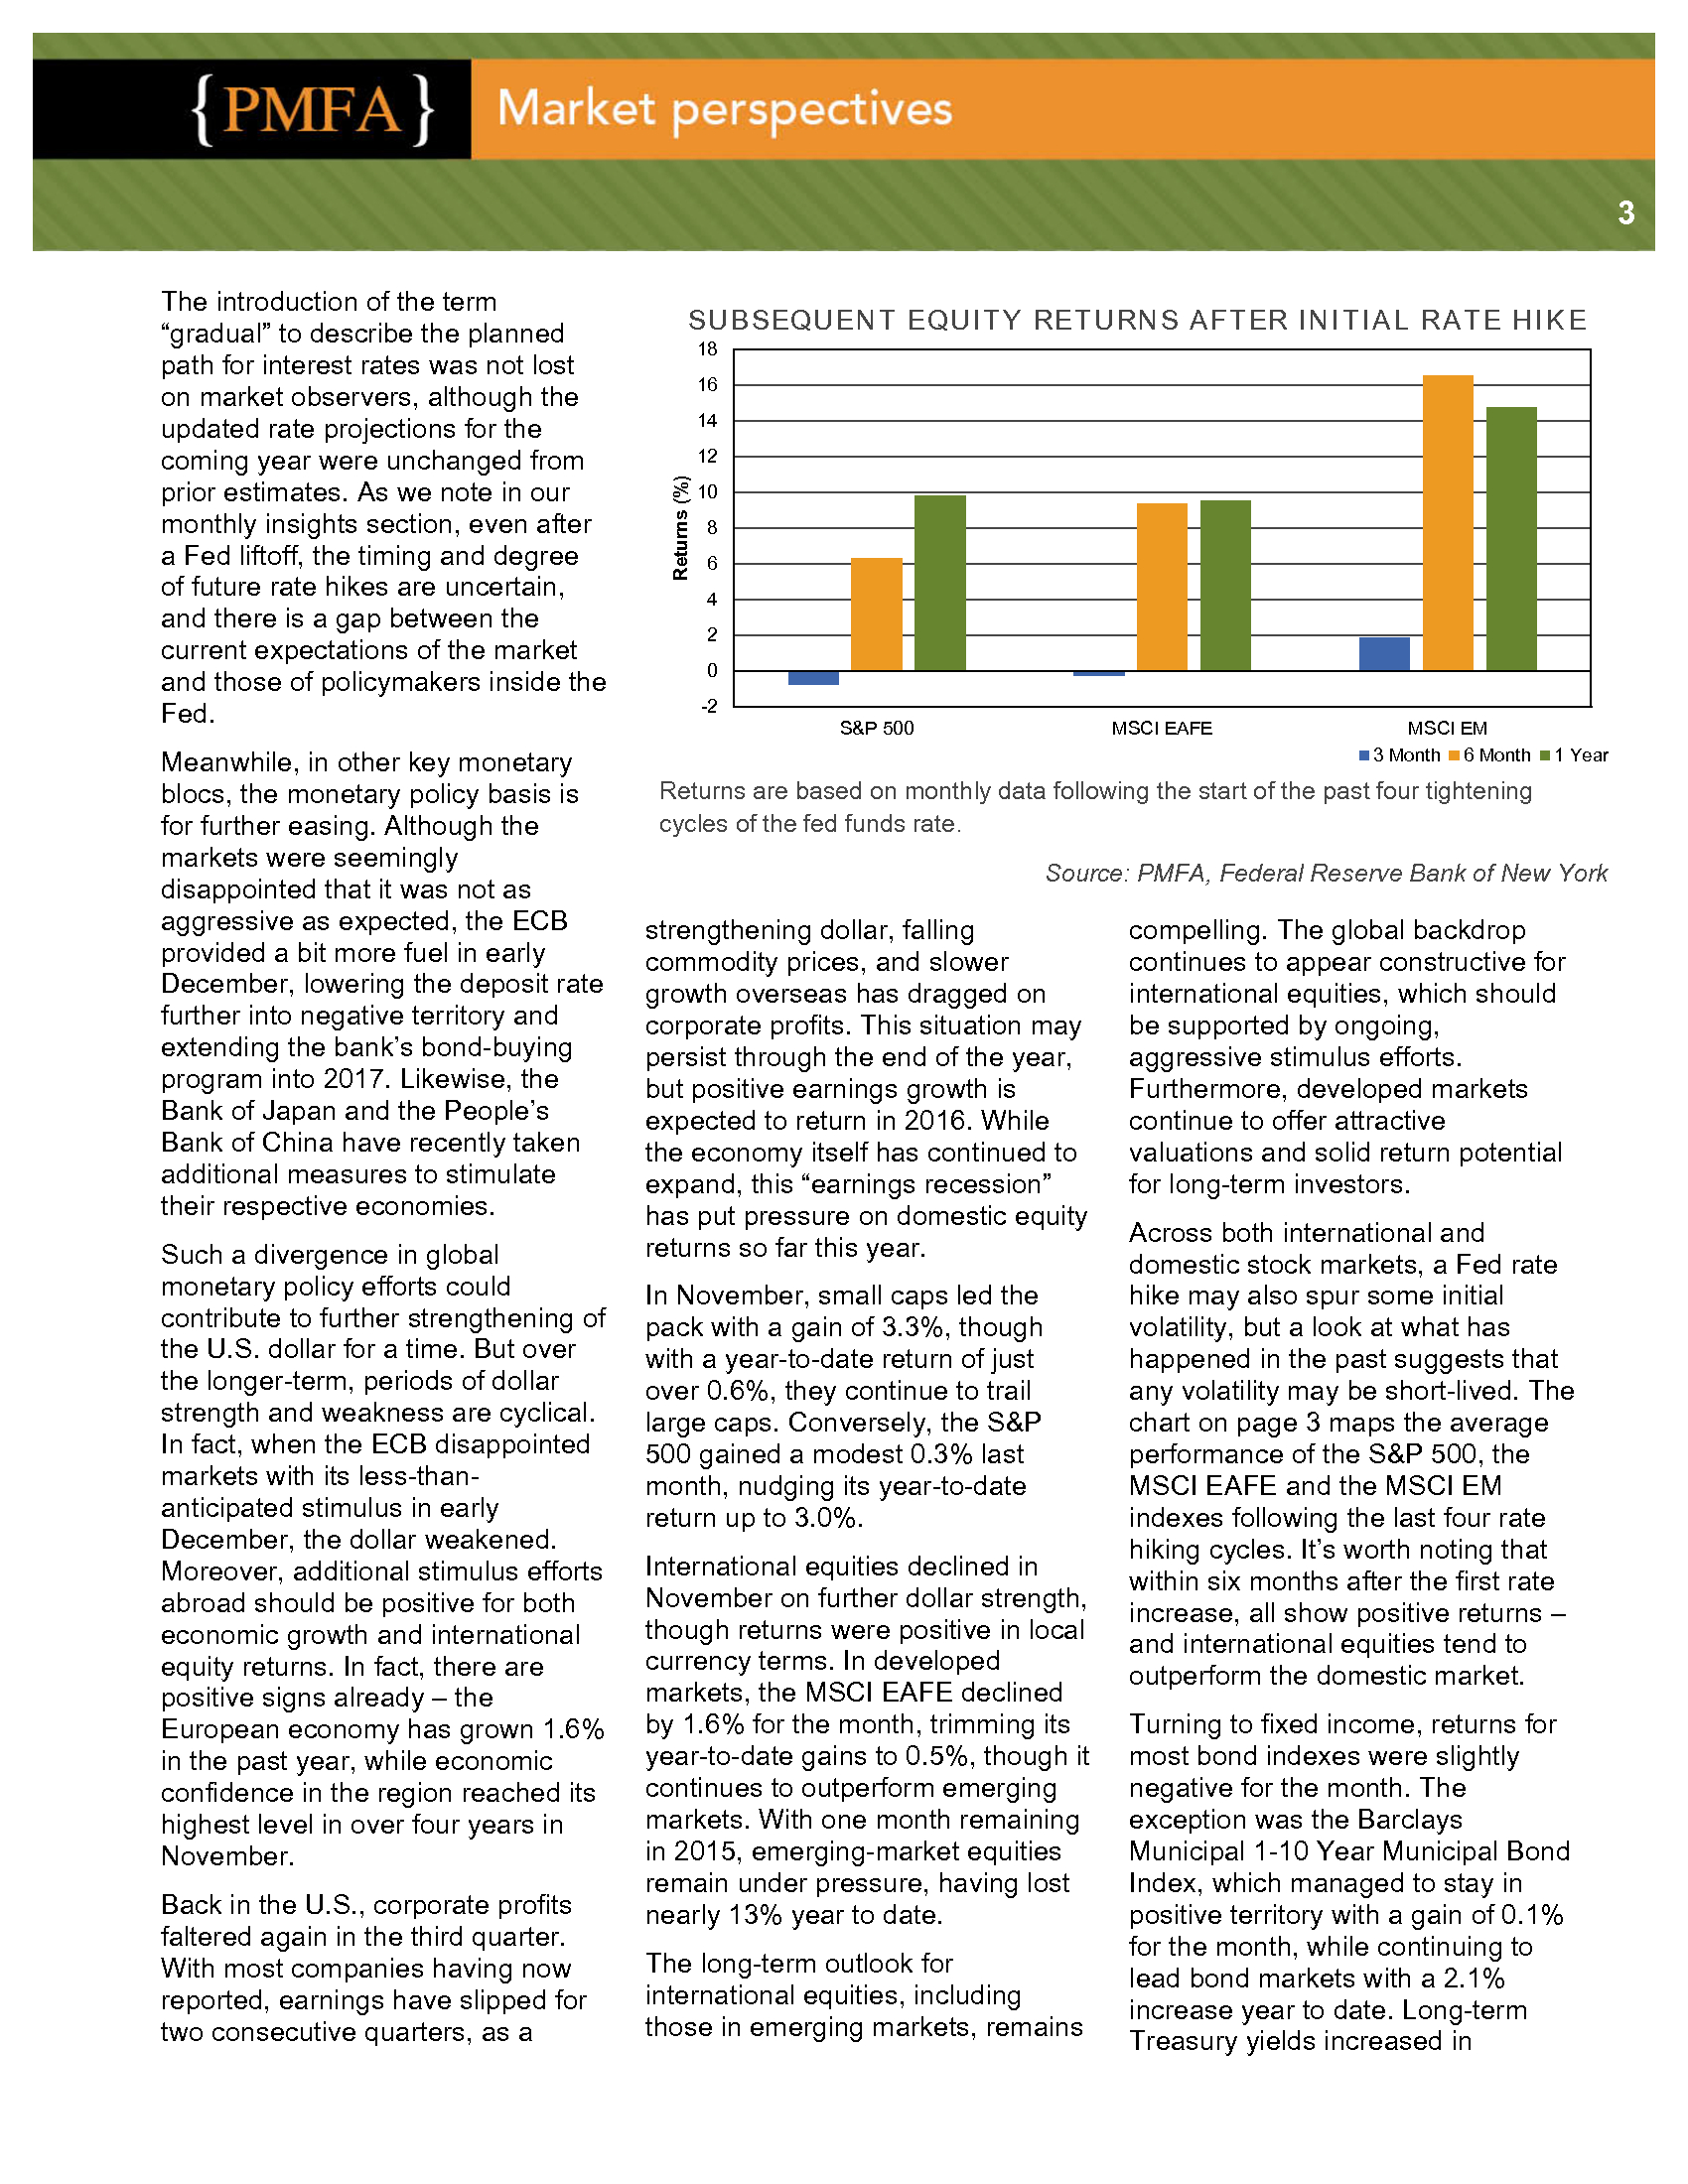
Treasury yields increased in expectation of a December Fed rate hike, and credit spreads – particularly in high yield – widened further. Change in Fed Funds Rate (Basis Points) MONTHLY INSIGHTS FED EX PECT ED T O L I FT OFF A T A GRA DU A L PA CE 450 400 350 300 250 200 150 100 50 0 t+3 1994 t+6 2004 t+9 t+12 t+15 t+18 Number of Months After First Rate Hike FOMC "median dot" Projections t+21 t+24 Current Market Expectations Source: PMFA, Federal Reserve Bank This month, with the first Fed rate hike in over a decade widely expected before yearend, we examine prior paths of the federal funds rate relative to current expectations and the last two tightening cycles. Along with the actual rate paths in 1994 and 2004, we’ve plotted current market expectations (blue line) and average expectation of individual FOMC members (black line). A clear divergence exists, with the market expecting a much lower, slower pace to higher rates. However, both policymakers and markets today project that the path of rate hikes will be less aggressive than was the case in either 1994 or 2004.
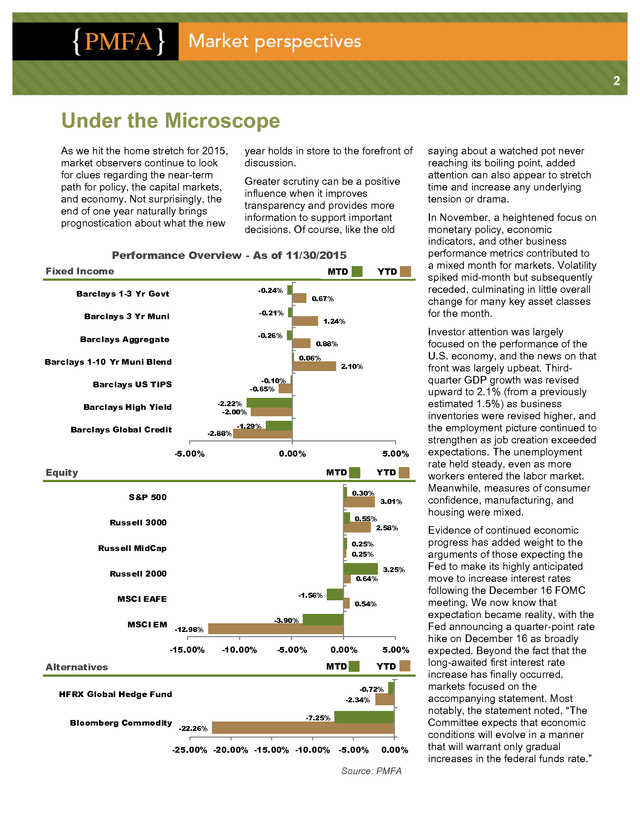
A gradual pace should be favorable for equities, should that be the path the Fed ultimately takes. . 2 Under the Microscope As we hit the home stretch for 2015, market observers continue to look for clues regarding the near-term path for policy, the capital markets, and economy. Not surprisingly, the end of one year naturally brings prognostication about what the new year holds in store to the forefront of discussion. Greater scrutiny can be a positive influence when it improves transparency and provides more information to support important decisions. Of course, like the old Performance Overview - As of 11/30/2015 Fixed Income MTD Barclays 1-3 Yr Govt -0.24% Barclays 3 Yr Muni -0.21% Barclays Aggregate -0.26% YTD 0.67% 1.24% 0.88% 0.06% Barclays 1-10 Yr Muni Blend 2.10% -0.10% -0.65% Barclays US TIPS -2.22% -2.00% Barclays High Yield Barclays Global Credit -2.88% -1.29% -5.00% 0.00% Equity 5.00% MTD 0.30% S&P 500 3.01% 0.55% 2.58% Russell 3000 0.25% 0.25% Russell MidCap Russell 2000 0.64% -1.56% MSCI EAFE MSCI EM Alternatives YTD 0.54% -3.90% -12.98% -15.00% -10.00% -5.00% 0.00% YTD -0.72% HFRX Global Hedge Fund Bloomberg Commodity 5.00% MTD Alternatives 3.25% -2.34% -7.25% -22.26% -25.00% -20.00% -15.00% -10.00% -5.00% 0.00% Source: PMFA saying about a watched pot never reaching its boiling point, added attention can also appear to stretch time and increase any underlying tension or drama. In November, a heightened focus on monetary policy, economic indicators, and other business performance metrics contributed to a mixed month for markets. Volatility spiked mid-month but subsequently receded, culminating in little overall change for many key asset classes for the month. Investor attention was largely focused on the performance of the U.S.
economy, and the news on that front was largely upbeat. Thirdquarter GDP growth was revised upward to 2.1% (from a previously estimated 1.5%) as business inventories were revised higher, and the employment picture continued to strengthen as job creation exceeded expectations. The unemployment rate held steady, even as more workers entered the labor market. Meanwhile, measures of consumer confidence, manufacturing, and housing were mixed. Evidence of continued economic progress has added weight to the arguments of those expecting the Fed to make its highly anticipated move to increase interest rates following the December 16 FOMC meeting.
We now know that expectation became reality, with the Fed announcing a quarter-point rate hike on December 16 as broadly expected. Beyond the fact that the long-awaited first interest rate increase has finally occurred, markets focused on the accompanying statement. Most notably, the statement noted, “The Committee expects that economic conditions will evolve in a manner that will warrant only gradual increases in the federal funds rate.” .
3 Meanwhile, in other key monetary blocs, the monetary policy basis is for further easing. Although the markets were seemingly disappointed that it was not as aggressive as expected, the ECB provided a bit more fuel in early December, lowering the deposit rate further into negative territory and extending the bank’s bond-buying program into 2017. Likewise, the Bank of Japan and the People’s Bank of China have recently taken additional measures to stimulate their respective economies. Such a divergence in global monetary policy efforts could contribute to further strengthening of the U.S. dollar for a time.
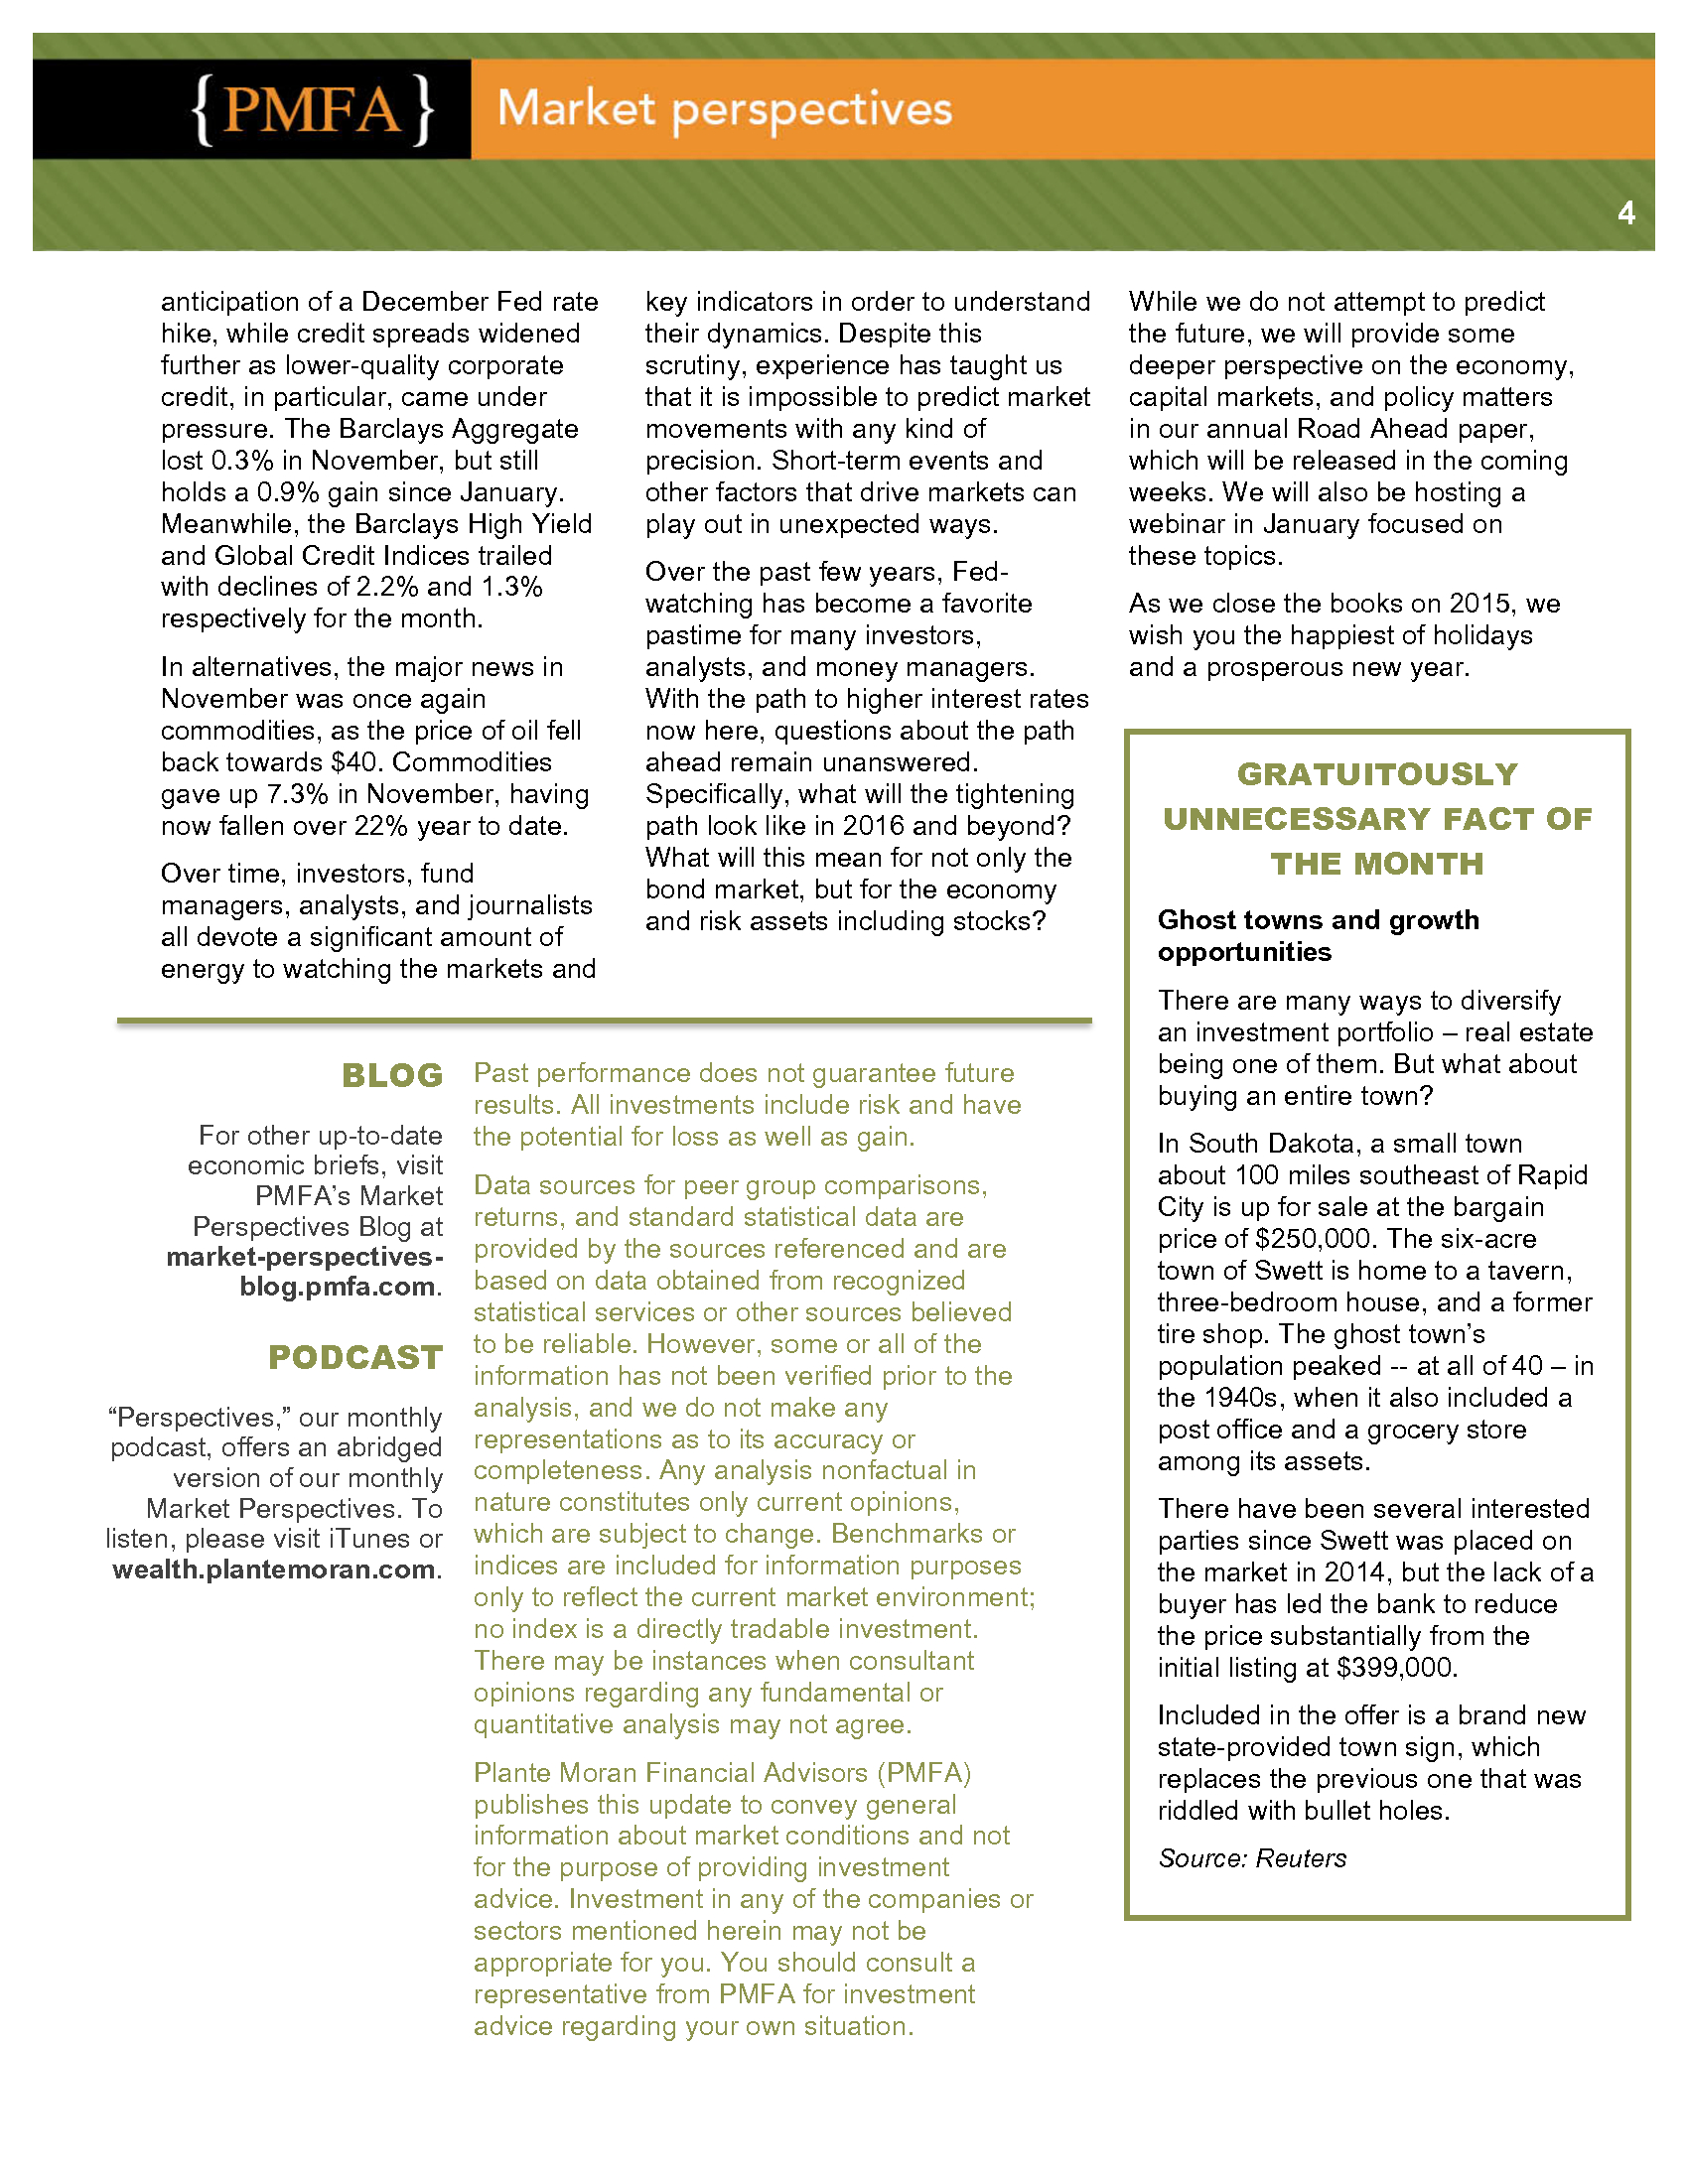
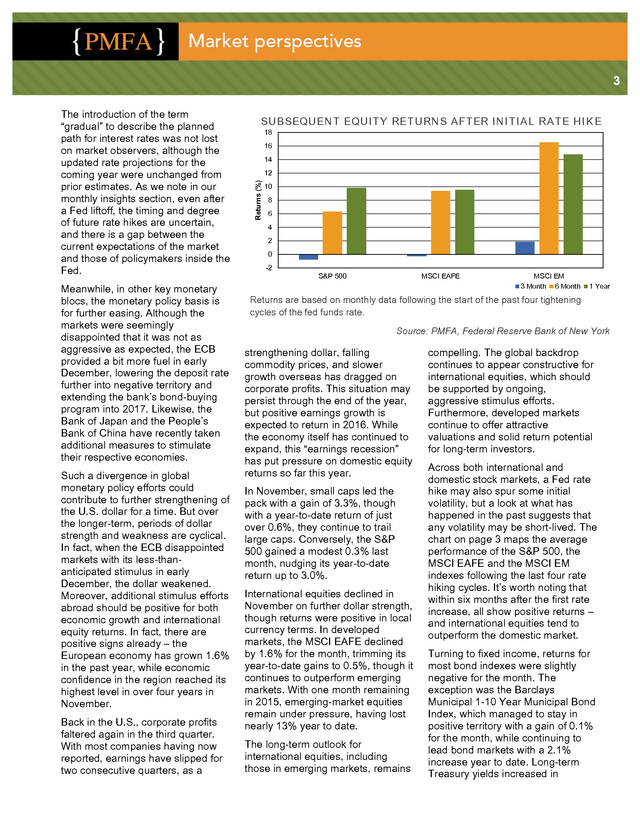
But over the longer-term, periods of dollar strength and weakness are cyclical. In fact, when the ECB disappointed markets with its less-thananticipated stimulus in early December, the dollar weakened. Moreover, additional stimulus efforts abroad should be positive for both economic growth and international equity returns. In fact, there are positive signs already – the European economy has grown 1.6% in the past year, while economic confidence in the region reached its highest level in over four years in November. Back in the U.S., corporate profits faltered again in the third quarter. With most companies having now reported, earnings have slipped for two consecutive quarters, as a SU B SEQU EN T EQU I T Y RET U RN S A FT ER I N I T I A L RA T E H I K E 18 16 14 12 Returns (%) The introduction of the term “gradual” to describe the planned path for interest rates was not lost on market observers, although the updated rate projections for the coming year were unchanged from prior estimates. As we note in our monthly insights section, even after a Fed liftoff, the timing and degree of future rate hikes are uncertain, and there is a gap between the current expectations of the market and those of policymakers inside the Fed. 10 8 6 4 2 0 -2 S&P 500 MSCI EAFE MSCI EM 3 Month 6 Month 1 Year Returns are based on monthly data following the start of the past four tightening cycles of the fed funds rate. Source: PMFA, Federal Reserve Bank of New York strengthening dollar, falling commodity prices, and slower growth overseas has dragged on corporate profits.
This situation may persist through the end of the year, but positive earnings growth is expected to return in 2016. While the economy itself has continued to expand, this “earnings recession” has put pressure on domestic equity returns so far this year. In November, small caps led the pack with a gain of 3.3%, though with a year-to-date return of just over 0.6%, they continue to trail large caps. Conversely, the S&P 500 gained a modest 0.3% last month, nudging its year-to-date return up to 3.0%. International equities declined in November on further dollar strength, though returns were positive in local currency terms.
In developed markets, the MSCI EAFE declined by 1.6% for the month, trimming its year-to-date gains to 0.5%, though it continues to outperform emerging markets. With one month remaining in 2015, emerging-market equities remain under pressure, having lost nearly 13% year to date. The long-term outlook for international equities, including those in emerging markets, remains compelling. The global backdrop continues to appear constructive for international equities, which should be supported by ongoing, aggressive stimulus efforts. Furthermore, developed markets continue to offer attractive valuations and solid return potential for long-term investors. Across both international and domestic stock markets, a Fed rate hike may also spur some initial volatility, but a look at what has happened in the past suggests that any volatility may be short-lived.
The chart on page 3 maps the average performance of the S&P 500, the MSCI EAFE and the MSCI EM indexes following the last four rate hiking cycles. It’s worth noting that within six months after the first rate increase, all show positive returns – and international equities tend to outperform the domestic market. Turning to fixed income, returns for most bond indexes were slightly negative for the month. The exception was the Barclays Municipal 1-10 Year Municipal Bond Index, which managed to stay in positive territory with a gain of 0.1% for the month, while continuing to lead bond markets with a 2.1% increase year to date.
Long-term Treasury yields increased in . 4 anticipation of a December Fed rate hike, while credit spreads widened further as lower-quality corporate credit, in particular, came under pressure. The Barclays Aggregate lost 0.3% in November, but still holds a 0.9% gain since January. Meanwhile, the Barclays High Yield and Global Credit Indices trailed with declines of 2.2% and 1.3% respectively for the month. In alternatives, the major news in November was once again commodities, as the price of oil fell back towards $40. Commodities gave up 7.3% in November, having now fallen over 22% year to date. Over time, investors, fund managers, analysts, and journalists all devote a significant amount of energy to watching the markets and key indicators in order to understand their dynamics. Despite this scrutiny, experience has taught us that it is impossible to predict market movements with any kind of precision.
Short-term events and other factors that drive markets can play out in unexpected ways. Over the past few years, Fedwatching has become a favorite pastime for many investors, analysts, and money managers. With the path to higher interest rates now here, questions about the path ahead remain unanswered. Specifically, what will the tightening path look like in 2016 and beyond? What will this mean for not only the bond market, but for the economy and risk assets including stocks? BLOG Past performance does not guarantee future For other up-to-date economic briefs, visit PMFA’s Market Perspectives Blog at market-perspectivesblog.pmfa.com. PODCAST “Perspectives,” our monthly podcast, offers an abridged version of our monthly Market Perspectives. To listen, please visit iTunes or wealth.plantemoran.com. results. All investments include risk and have the potential for loss as well as gain. Data sources for peer group comparisons, returns, and standard statistical data are provided by the sources referenced and are based on data obtained from recognized statistical services or other sources believed to be reliable.
However, some or all of the information has not been verified prior to the analysis, and we do not make any representations as to its accuracy or completeness. Any analysis nonfactual in nature constitutes only current opinions, which are subject to change. Benchmarks or indices are included for information purposes only to reflect the current market environment; no index is a directly tradable investment. There may be instances when consultant opinions regarding any fundamental or quantitative analysis may not agree. Plante Moran Financial Advisors (PMFA) publishes this update to convey general information about market conditions and not for the purpose of providing investment advice.
Investment in any of the companies or sectors mentioned herein may not be appropriate for you. You should consult a representative from PMFA for investment advice regarding your own situation. While we do not attempt to predict the future, we will provide some deeper perspective on the economy, capital markets, and policy matters in our annual Road Ahead paper, which will be released in the coming weeks. We will also be hosting a webinar in January focused on these topics. As we close the books on 2015, we wish you the happiest of holidays and a prosperous new year. GRATUITOUSLY UNNECESSARY FACT OF THE MONTH Ghost towns and growth opportunities There are many ways to diversify an investment portfolio – real estate being one of them.
But what about buying an entire town? In South Dakota, a small town about 100 miles southeast of Rapid City is up for sale at the bargain price of $250,000. The six-acre town of Swett is home to a tavern, three-bedroom house, and a former tire shop. The ghost town’s population peaked -- at all of 40 – in the 1940s, when it also included a post office and a grocery store among its assets. There have been several interested parties since Swett was placed on the market in 2014, but the lack of a buyer has led the bank to reduce the price substantially from the initial listing at $399,000. Included in the offer is a brand new state-provided town sign, which replaces the previous one that was riddled with bullet holes. Source: Reuters .
Treasury yields increased in expectation of a December Fed rate hike, and credit spreads – particularly in high yield – widened further. Change in Fed Funds Rate (Basis Points) MONTHLY INSIGHTS FED EX PECT ED T O L I FT OFF A T A GRA DU A L PA CE 450 400 350 300 250 200 150 100 50 0 t+3 1994 t+6 2004 t+9 t+12 t+15 t+18 Number of Months After First Rate Hike FOMC "median dot" Projections t+21 t+24 Current Market Expectations Source: PMFA, Federal Reserve Bank This month, with the first Fed rate hike in over a decade widely expected before yearend, we examine prior paths of the federal funds rate relative to current expectations and the last two tightening cycles. Along with the actual rate paths in 1994 and 2004, we’ve plotted current market expectations (blue line) and average expectation of individual FOMC members (black line). A clear divergence exists, with the market expecting a much lower, slower pace to higher rates. However, both policymakers and markets today project that the path of rate hikes will be less aggressive than was the case in either 1994 or 2004.
A gradual pace should be favorable for equities, should that be the path the Fed ultimately takes. . 2 Under the Microscope As we hit the home stretch for 2015, market observers continue to look for clues regarding the near-term path for policy, the capital markets, and economy. Not surprisingly, the end of one year naturally brings prognostication about what the new year holds in store to the forefront of discussion. Greater scrutiny can be a positive influence when it improves transparency and provides more information to support important decisions. Of course, like the old Performance Overview - As of 11/30/2015 Fixed Income MTD Barclays 1-3 Yr Govt -0.24% Barclays 3 Yr Muni -0.21% Barclays Aggregate -0.26% YTD 0.67% 1.24% 0.88% 0.06% Barclays 1-10 Yr Muni Blend 2.10% -0.10% -0.65% Barclays US TIPS -2.22% -2.00% Barclays High Yield Barclays Global Credit -2.88% -1.29% -5.00% 0.00% Equity 5.00% MTD 0.30% S&P 500 3.01% 0.55% 2.58% Russell 3000 0.25% 0.25% Russell MidCap Russell 2000 0.64% -1.56% MSCI EAFE MSCI EM Alternatives YTD 0.54% -3.90% -12.98% -15.00% -10.00% -5.00% 0.00% YTD -0.72% HFRX Global Hedge Fund Bloomberg Commodity 5.00% MTD Alternatives 3.25% -2.34% -7.25% -22.26% -25.00% -20.00% -15.00% -10.00% -5.00% 0.00% Source: PMFA saying about a watched pot never reaching its boiling point, added attention can also appear to stretch time and increase any underlying tension or drama. In November, a heightened focus on monetary policy, economic indicators, and other business performance metrics contributed to a mixed month for markets. Volatility spiked mid-month but subsequently receded, culminating in little overall change for many key asset classes for the month. Investor attention was largely focused on the performance of the U.S.
economy, and the news on that front was largely upbeat. Thirdquarter GDP growth was revised upward to 2.1% (from a previously estimated 1.5%) as business inventories were revised higher, and the employment picture continued to strengthen as job creation exceeded expectations. The unemployment rate held steady, even as more workers entered the labor market. Meanwhile, measures of consumer confidence, manufacturing, and housing were mixed. Evidence of continued economic progress has added weight to the arguments of those expecting the Fed to make its highly anticipated move to increase interest rates following the December 16 FOMC meeting.
We now know that expectation became reality, with the Fed announcing a quarter-point rate hike on December 16 as broadly expected. Beyond the fact that the long-awaited first interest rate increase has finally occurred, markets focused on the accompanying statement. Most notably, the statement noted, “The Committee expects that economic conditions will evolve in a manner that will warrant only gradual increases in the federal funds rate.” .
3 Meanwhile, in other key monetary blocs, the monetary policy basis is for further easing. Although the markets were seemingly disappointed that it was not as aggressive as expected, the ECB provided a bit more fuel in early December, lowering the deposit rate further into negative territory and extending the bank’s bond-buying program into 2017. Likewise, the Bank of Japan and the People’s Bank of China have recently taken additional measures to stimulate their respective economies. Such a divergence in global monetary policy efforts could contribute to further strengthening of the U.S. dollar for a time.
But over the longer-term, periods of dollar strength and weakness are cyclical. In fact, when the ECB disappointed markets with its less-thananticipated stimulus in early December, the dollar weakened. Moreover, additional stimulus efforts abroad should be positive for both economic growth and international equity returns. In fact, there are positive signs already – the European economy has grown 1.6% in the past year, while economic confidence in the region reached its highest level in over four years in November. Back in the U.S., corporate profits faltered again in the third quarter. With most companies having now reported, earnings have slipped for two consecutive quarters, as a SU B SEQU EN T EQU I T Y RET U RN S A FT ER I N I T I A L RA T E H I K E 18 16 14 12 Returns (%) The introduction of the term “gradual” to describe the planned path for interest rates was not lost on market observers, although the updated rate projections for the coming year were unchanged from prior estimates. As we note in our monthly insights section, even after a Fed liftoff, the timing and degree of future rate hikes are uncertain, and there is a gap between the current expectations of the market and those of policymakers inside the Fed. 10 8 6 4 2 0 -2 S&P 500 MSCI EAFE MSCI EM 3 Month 6 Month 1 Year Returns are based on monthly data following the start of the past four tightening cycles of the fed funds rate. Source: PMFA, Federal Reserve Bank of New York strengthening dollar, falling commodity prices, and slower growth overseas has dragged on corporate profits.
This situation may persist through the end of the year, but positive earnings growth is expected to return in 2016. While the economy itself has continued to expand, this “earnings recession” has put pressure on domestic equity returns so far this year. In November, small caps led the pack with a gain of 3.3%, though with a year-to-date return of just over 0.6%, they continue to trail large caps. Conversely, the S&P 500 gained a modest 0.3% last month, nudging its year-to-date return up to 3.0%. International equities declined in November on further dollar strength, though returns were positive in local currency terms.
In developed markets, the MSCI EAFE declined by 1.6% for the month, trimming its year-to-date gains to 0.5%, though it continues to outperform emerging markets. With one month remaining in 2015, emerging-market equities remain under pressure, having lost nearly 13% year to date. The long-term outlook for international equities, including those in emerging markets, remains compelling. The global backdrop continues to appear constructive for international equities, which should be supported by ongoing, aggressive stimulus efforts. Furthermore, developed markets continue to offer attractive valuations and solid return potential for long-term investors. Across both international and domestic stock markets, a Fed rate hike may also spur some initial volatility, but a look at what has happened in the past suggests that any volatility may be short-lived.
The chart on page 3 maps the average performance of the S&P 500, the MSCI EAFE and the MSCI EM indexes following the last four rate hiking cycles. It’s worth noting that within six months after the first rate increase, all show positive returns – and international equities tend to outperform the domestic market. Turning to fixed income, returns for most bond indexes were slightly negative for the month. The exception was the Barclays Municipal 1-10 Year Municipal Bond Index, which managed to stay in positive territory with a gain of 0.1% for the month, while continuing to lead bond markets with a 2.1% increase year to date.
Long-term Treasury yields increased in . 4 anticipation of a December Fed rate hike, while credit spreads widened further as lower-quality corporate credit, in particular, came under pressure. The Barclays Aggregate lost 0.3% in November, but still holds a 0.9% gain since January. Meanwhile, the Barclays High Yield and Global Credit Indices trailed with declines of 2.2% and 1.3% respectively for the month. In alternatives, the major news in November was once again commodities, as the price of oil fell back towards $40. Commodities gave up 7.3% in November, having now fallen over 22% year to date. Over time, investors, fund managers, analysts, and journalists all devote a significant amount of energy to watching the markets and key indicators in order to understand their dynamics. Despite this scrutiny, experience has taught us that it is impossible to predict market movements with any kind of precision.
Short-term events and other factors that drive markets can play out in unexpected ways. Over the past few years, Fedwatching has become a favorite pastime for many investors, analysts, and money managers. With the path to higher interest rates now here, questions about the path ahead remain unanswered. Specifically, what will the tightening path look like in 2016 and beyond? What will this mean for not only the bond market, but for the economy and risk assets including stocks? BLOG Past performance does not guarantee future For other up-to-date economic briefs, visit PMFA’s Market Perspectives Blog at market-perspectivesblog.pmfa.com. PODCAST “Perspectives,” our monthly podcast, offers an abridged version of our monthly Market Perspectives. To listen, please visit iTunes or wealth.plantemoran.com. results. All investments include risk and have the potential for loss as well as gain. Data sources for peer group comparisons, returns, and standard statistical data are provided by the sources referenced and are based on data obtained from recognized statistical services or other sources believed to be reliable.
However, some or all of the information has not been verified prior to the analysis, and we do not make any representations as to its accuracy or completeness. Any analysis nonfactual in nature constitutes only current opinions, which are subject to change. Benchmarks or indices are included for information purposes only to reflect the current market environment; no index is a directly tradable investment. There may be instances when consultant opinions regarding any fundamental or quantitative analysis may not agree. Plante Moran Financial Advisors (PMFA) publishes this update to convey general information about market conditions and not for the purpose of providing investment advice.
Investment in any of the companies or sectors mentioned herein may not be appropriate for you. You should consult a representative from PMFA for investment advice regarding your own situation. While we do not attempt to predict the future, we will provide some deeper perspective on the economy, capital markets, and policy matters in our annual Road Ahead paper, which will be released in the coming weeks. We will also be hosting a webinar in January focused on these topics. As we close the books on 2015, we wish you the happiest of holidays and a prosperous new year. GRATUITOUSLY UNNECESSARY FACT OF THE MONTH Ghost towns and growth opportunities There are many ways to diversify an investment portfolio – real estate being one of them.
But what about buying an entire town? In South Dakota, a small town about 100 miles southeast of Rapid City is up for sale at the bargain price of $250,000. The six-acre town of Swett is home to a tavern, three-bedroom house, and a former tire shop. The ghost town’s population peaked -- at all of 40 – in the 1940s, when it also included a post office and a grocery store among its assets. There have been several interested parties since Swett was placed on the market in 2014, but the lack of a buyer has led the bank to reduce the price substantially from the initial listing at $399,000. Included in the offer is a brand new state-provided town sign, which replaces the previous one that was riddled with bullet holes. Source: Reuters .
Plante Moran Financial Advisors