


Description
March 2016
EXECUTIVE SUMMARY
•
•
CPA, CFP®, CIMA®
Partner,
Chief Investment Officer
U.S. stocks ended the month with mixed performance, with mid caps gaining
1.1% while large caps and small caps were essentially flat.
•
Bonds rallied in February, as the flight to quality suppressed long-term rates;
the yield on the benchmark 10-year Treasury ended the month at 1.74%, down
from 2.2% at the start of the year.
•
Contrary to expectations, estimated 4th quarter GDP growth was revised
upward, from 0.7% to 1.0%, mostly on higher inventory accumulation and a
slightly narrower trade deficit.
•
JIM BAIRD
The recent surge in market volatility that began mid-December persisted into
February, as did market anxiety about the slowing global economy. Those
concerns subsided in the latter half of the month, relieving some of the
downward pressure on risk assets.
The divergence between the expectations of FOMC members and the markets
regarding the pace of future rate hikes came back into focus, creating a
potential source of future volatility as the actual policy path becomes clear.
MARKET VS. FED EXPECTATIONS FOR THE FED FUNDS RATE
4.0
Fed Funds Rate (%)
3.5
3.0
2.5
2.0
1.5
1.0
0.5
0.0
Fed Range
Fed Funds Effective Rate (%)
Fed Median Expectations (December 2015 Meeting)
Market Expectations (Feb.
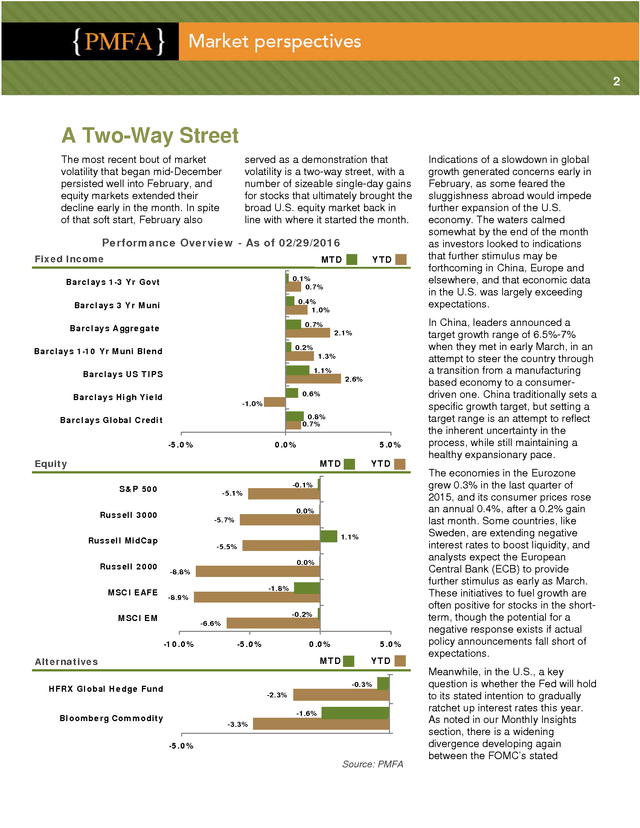
29, 2016) Source: PMFA, Federal Reserve MONTHLY INSIGHTS Since the the Fed Funds target rate was raised in December, volatility in stock prices and concerns about the pace of U.S. economic growth have widened the gap in expectations between the markets and the FOMC itself. Today, the futures market is pricing in only limited interest rate increases this year, while the official Fed stance is for four rate hikes in 2016 as part of their “gradual” transition away from the historically low rate environment. The chart on the left highlights this divergence in expectations as of the end of February. That gap is likely to be a source of uncertainty for investors until it becomes clearer whether the Fed will moderate its views or forge ahead. .
2 A Two-Way Street The most recent bout of market volatility that began mid-December persisted well into February, and equity markets extended their decline early in the month. In spite of that soft start, February also served as a demonstration that volatility is a two-way street, with a number of sizeable single-day gains for stocks that ultimately brought the broad U.S. equity market back in line with where it started the month. Performance Overview - As of 02/29/2016 Fixed Income MTD YTD 0.1% 0.7% Barclays 1-3 Yr Govt 0.4% 1.0% Barclays 3 Yr Muni 0.7% Barclays Aggregate 0.2% Barclays 1-10 Yr Muni Blend 2.1% 1.3% 1.1% Barclays US TIPS 2.6% 0.6% Barclays High Yield -1.0% 0.8% 0.7% Barclays Global Credit -5.0% 0.0% 5.0% Equity MTD S&P 500 MSCI EAFE 1.1% -5.5% 0.0% -8.8% -1.8% -8.9% MSCI EM Alternatives 0.0% -5.7% Russell MidCap Russell 2000 -0.1% -5.1% Russell 3000 YTD -0.2% -6.6% -10.0% -5.0% 0.0% MTD Alternatives 5.0% YTD -0.3% HFRX Global Hedge Fund -2.3% -1.6% Bloomberg Commodity -3.3% -5.0% Source: PMFA Indications of a slowdown in global growth generated concerns early in February, as some feared the sluggishness abroad would impede further expansion of the U.S. economy. The waters calmed somewhat by the end of the month as investors looked to indications that further stimulus may be forthcoming in China, Europe and elsewhere, and that economic data in the U.S.
was largely exceeding expectations. In China, leaders announced a target growth range of 6.5%-7% when they met in early March, in an attempt to steer the country through a transition from a manufacturing based economy to a consumerdriven one. China traditionally sets a specific growth target, but setting a target range is an attempt to reflect the inherent uncertainty in the process, while still maintaining a healthy expansionary pace. The economies in the Eurozone grew 0.3% in the last quarter of 2015, and its consumer prices rose an annual 0.4%, after a 0.2% gain last month. Some countries, like Sweden, are extending negative interest rates to boost liquidity, and analysts expect the European Central Bank (ECB) to provide further stimulus as early as March. These initiatives to fuel growth are often positive for stocks in the shortterm, though the potential for a negative response exists if actual policy announcements fall short of expectations. Meanwhile, in the U.S., a key question is whether the Fed will hold to its stated intention to gradually ratchet up interest rates this year. As noted in our Monthly Insights section, there is a widening divergence developing again between the FOMC’s stated .
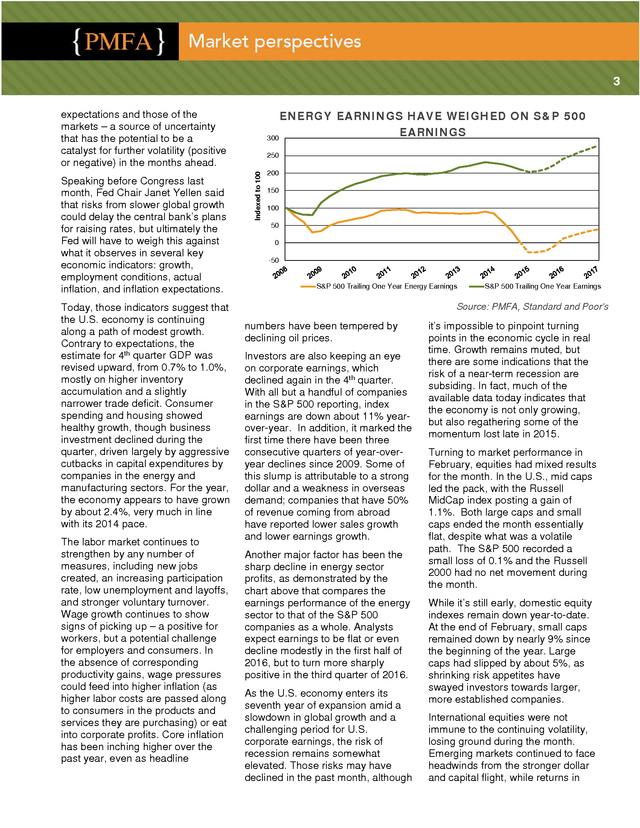
3 ENERGY EARNINGS HAVE WEIGHED ON S&P 500 EARNINGS 300 expectations and those of the markets – a source of uncertainty that has the potential to be a catalyst for further volatility (positive or negative) in the months ahead. Today, those indicators suggest that the U.S. economy is continuing along a path of modest growth. Contrary to expectations, the estimate for 4th quarter GDP was revised upward, from 0.7% to 1.0%, mostly on higher inventory accumulation and a slightly narrower trade deficit. Consumer spending and housing showed healthy growth, though business investment declined during the quarter, driven largely by aggressive cutbacks in capital expenditures by companies in the energy and manufacturing sectors. For the year, the economy appears to have grown by about 2.4%, very much in line with its 2014 pace. The labor market continues to strengthen by any number of measures, including new jobs created, an increasing participation rate, low unemployment and layoffs, and stronger voluntary turnover. Wage growth continues to show signs of picking up – a positive for workers, but a potential challenge for employers and consumers.
In the absence of corresponding productivity gains, wage pressures could feed into higher inflation (as higher labor costs are passed along to consumers in the products and services they are purchasing) or eat into corporate profits. Core inflation has been inching higher over the past year, even as headline Indexed to 100 Speaking before Congress last month, Fed Chair Janet Yellen said that risks from slower global growth could delay the central bank’s plans for raising rates, but ultimately the Fed will have to weigh this against what it observes in several key economic indicators: growth, employment conditions, actual inflation, and inflation expectations. 250 200 150 100 50 0 -50 S&P 500 Trailing One Year Energy Earnings S&P 500 Trailing One Year Earnings Source: PMFA, Standard and Poor’s numbers have been tempered by declining oil prices. Investors are also keeping an eye on corporate earnings, which declined again in the 4th quarter. With all but a handful of companies in the S&P 500 reporting, index earnings are down about 11% yearover-year. In addition, it marked the first time there have been three consecutive quarters of year-overyear declines since 2009.
Some of this slump is attributable to a strong dollar and a weakness in overseas demand; companies that have 50% of revenue coming from abroad have reported lower sales growth and lower earnings growth. Another major factor has been the sharp decline in energy sector profits, as demonstrated by the chart above that compares the earnings performance of the energy sector to that of the S&P 500 companies as a whole. Analysts expect earnings to be flat or even decline modestly in the first half of 2016, but to turn more sharply positive in the third quarter of 2016. As the U.S. economy enters its seventh year of expansion amid a slowdown in global growth and a challenging period for U.S. corporate earnings, the risk of recession remains somewhat elevated.
Those risks may have declined in the past month, although it’s impossible to pinpoint turning points in the economic cycle in real time. Growth remains muted, but there are some indications that the risk of a near-term recession are subsiding. In fact, much of the available data today indicates that the economy is not only growing, but also regathering some of the momentum lost late in 2015. Turning to market performance in February, equities had mixed results for the month.
In the U.S., mid caps led the pack, with the Russell MidCap index posting a gain of 1.1%. Both large caps and small caps ended the month essentially flat, despite what was a volatile path. The S&P 500 recorded a small loss of 0.1% and the Russell 2000 had no net movement during the month. While it’s still early, domestic equity indexes remain down year-to-date. At the end of February, small caps remained down by nearly 9% since the beginning of the year.
Large caps had slipped by about 5%, as shrinking risk appetites have swayed investors towards larger, more established companies. International equities were not immune to the continuing volatility, losing ground during the month. Emerging markets continued to face headwinds from the stronger dollar and capital flight, while returns in . 4 developed market stocks were boosted by some depreciation of the dollar relative to the Euro and Yen, but still underperformed U.S. markets for the month. The MCSI EAFE lost 1.8% in February and remains down by nearly 9.0% for the year, while the MSCI Emerging Markets Index gave up 0.2% last month, leaving it with a 6.6% loss year-to-date. Though global equities were flat or modestly negative in February, bonds rallied as the flight to quality pushed interest rates lower. The yield on the benchmark 10-year Treasury ended the month at 1.74%, down from 2.4% at the start of the year. The Barclays Aggregate added 0.7% last month, pushing its year-to-date gain to over 2.0%.
The Barclays 1-10 Year Muni Index gained 0.2%, lifting its year-to-date return to 1.3%. Domestic high yield and global credit indexes also advanced during the month, paring earlier declines. With the exception of the Barclays High Yield index, all are sitting on at least modest gains year-to-date. Overall, the first two months of 2016 serve as a good reminder of the critical role that bonds play in balancing a diversified portfolio, helping to minimize the volatility that can be associated with equities while providing a source of income. Periods of high volatility are inherently uncomfortable for investors, particularly as markets move lower.
However, volatility can generate big moves in both directions in the equity markets— BLOG Past performance does not guarantee future For other up-to-date economic briefs, visit PMFA’s Market Perspectives Blog at market-perspectivesblog.pmfa.com. PODCAST “Perspectives,” our monthly podcast, offers an abridged version of our monthly Market Perspectives. To listen, please visit iTunes or wealth.plantemoran.com. results. All investments include risk and have the potential for loss as well as gain. Data sources for peer group comparisons, returns, and standard statistical data are provided by the sources referenced and are based on data obtained from recognized statistical services or other sources believed to be reliable.
However, some or all of the information has not been verified prior to the analysis, and we do not make any representations as to its accuracy or completeness. Any analysis nonfactual in nature constitutes only current opinions, which are subject to change. Benchmarks or indices are included for information purposes only to reflect the current market environment; no index is a directly tradable investment. There may be instances when consultant opinions regarding any fundamental or quantitative analysis may not agree. Plante Moran Financial Advisors (PMFA) publishes this update to convey general information about market conditions and not for the purpose of providing investment advice.
Investment in any of the companies or sectors mentioned herein may not be appropriate for you. You should consult a representative from PMFA for investment advice regarding your own situation. such as those we witnessed in February. During such periods, it’s appropriate to reaffirm your return objectives, investment time horizon, and tolerance for risk. Most investors must assume risk to reach their goals, but finding the right level of risk that will enable them to remain committed to their strategy is critical. Failure to take sufficient risk may put an otherwise achievable goal out of reach; assuming too much risk may result in a poorly timed decision to reduce portfolio risk when a correction occurs.
Most importantly, having a plan for dealing with market volatility – and then sticking with that plan when that volatility occurs – puts the investor in the best position to achieve their goals. GRATUITOUSLY UNNECESSARY NEWS OF THE MONTH One Half-Good Samaritan New York native Reilly Flaherty lost his wallet at a concert in Brooklyn last month and assumed his cash, IDs and credit cards were gone forever. He was surprised, therefore, to find an envelope in the mail containing some of what he had lost along with a note two weeks later. Flaherty got back his credit cards and driver’s license, but not the cash, his metro card or the actual wallet. The accompanying note read: "I found your wallet, and your drivers license had your address so here's your credit cards and other important stuff. I kept the cash because I needed weed, the MetroCard because, well, the fare's $2.75 now, and the wallet 'cause it's kinda cool. Enjoy the rest of your day.
Toodles, Anonymous." Flaherty’s response to this half-Good Samaritan, half-thief was: "thanks... I think?" .
29, 2016) Source: PMFA, Federal Reserve MONTHLY INSIGHTS Since the the Fed Funds target rate was raised in December, volatility in stock prices and concerns about the pace of U.S. economic growth have widened the gap in expectations between the markets and the FOMC itself. Today, the futures market is pricing in only limited interest rate increases this year, while the official Fed stance is for four rate hikes in 2016 as part of their “gradual” transition away from the historically low rate environment. The chart on the left highlights this divergence in expectations as of the end of February. That gap is likely to be a source of uncertainty for investors until it becomes clearer whether the Fed will moderate its views or forge ahead. .
2 A Two-Way Street The most recent bout of market volatility that began mid-December persisted well into February, and equity markets extended their decline early in the month. In spite of that soft start, February also served as a demonstration that volatility is a two-way street, with a number of sizeable single-day gains for stocks that ultimately brought the broad U.S. equity market back in line with where it started the month. Performance Overview - As of 02/29/2016 Fixed Income MTD YTD 0.1% 0.7% Barclays 1-3 Yr Govt 0.4% 1.0% Barclays 3 Yr Muni 0.7% Barclays Aggregate 0.2% Barclays 1-10 Yr Muni Blend 2.1% 1.3% 1.1% Barclays US TIPS 2.6% 0.6% Barclays High Yield -1.0% 0.8% 0.7% Barclays Global Credit -5.0% 0.0% 5.0% Equity MTD S&P 500 MSCI EAFE 1.1% -5.5% 0.0% -8.8% -1.8% -8.9% MSCI EM Alternatives 0.0% -5.7% Russell MidCap Russell 2000 -0.1% -5.1% Russell 3000 YTD -0.2% -6.6% -10.0% -5.0% 0.0% MTD Alternatives 5.0% YTD -0.3% HFRX Global Hedge Fund -2.3% -1.6% Bloomberg Commodity -3.3% -5.0% Source: PMFA Indications of a slowdown in global growth generated concerns early in February, as some feared the sluggishness abroad would impede further expansion of the U.S. economy. The waters calmed somewhat by the end of the month as investors looked to indications that further stimulus may be forthcoming in China, Europe and elsewhere, and that economic data in the U.S.
was largely exceeding expectations. In China, leaders announced a target growth range of 6.5%-7% when they met in early March, in an attempt to steer the country through a transition from a manufacturing based economy to a consumerdriven one. China traditionally sets a specific growth target, but setting a target range is an attempt to reflect the inherent uncertainty in the process, while still maintaining a healthy expansionary pace. The economies in the Eurozone grew 0.3% in the last quarter of 2015, and its consumer prices rose an annual 0.4%, after a 0.2% gain last month. Some countries, like Sweden, are extending negative interest rates to boost liquidity, and analysts expect the European Central Bank (ECB) to provide further stimulus as early as March. These initiatives to fuel growth are often positive for stocks in the shortterm, though the potential for a negative response exists if actual policy announcements fall short of expectations. Meanwhile, in the U.S., a key question is whether the Fed will hold to its stated intention to gradually ratchet up interest rates this year. As noted in our Monthly Insights section, there is a widening divergence developing again between the FOMC’s stated .
3 ENERGY EARNINGS HAVE WEIGHED ON S&P 500 EARNINGS 300 expectations and those of the markets – a source of uncertainty that has the potential to be a catalyst for further volatility (positive or negative) in the months ahead. Today, those indicators suggest that the U.S. economy is continuing along a path of modest growth. Contrary to expectations, the estimate for 4th quarter GDP was revised upward, from 0.7% to 1.0%, mostly on higher inventory accumulation and a slightly narrower trade deficit. Consumer spending and housing showed healthy growth, though business investment declined during the quarter, driven largely by aggressive cutbacks in capital expenditures by companies in the energy and manufacturing sectors. For the year, the economy appears to have grown by about 2.4%, very much in line with its 2014 pace. The labor market continues to strengthen by any number of measures, including new jobs created, an increasing participation rate, low unemployment and layoffs, and stronger voluntary turnover. Wage growth continues to show signs of picking up – a positive for workers, but a potential challenge for employers and consumers.
In the absence of corresponding productivity gains, wage pressures could feed into higher inflation (as higher labor costs are passed along to consumers in the products and services they are purchasing) or eat into corporate profits. Core inflation has been inching higher over the past year, even as headline Indexed to 100 Speaking before Congress last month, Fed Chair Janet Yellen said that risks from slower global growth could delay the central bank’s plans for raising rates, but ultimately the Fed will have to weigh this against what it observes in several key economic indicators: growth, employment conditions, actual inflation, and inflation expectations. 250 200 150 100 50 0 -50 S&P 500 Trailing One Year Energy Earnings S&P 500 Trailing One Year Earnings Source: PMFA, Standard and Poor’s numbers have been tempered by declining oil prices. Investors are also keeping an eye on corporate earnings, which declined again in the 4th quarter. With all but a handful of companies in the S&P 500 reporting, index earnings are down about 11% yearover-year. In addition, it marked the first time there have been three consecutive quarters of year-overyear declines since 2009.
Some of this slump is attributable to a strong dollar and a weakness in overseas demand; companies that have 50% of revenue coming from abroad have reported lower sales growth and lower earnings growth. Another major factor has been the sharp decline in energy sector profits, as demonstrated by the chart above that compares the earnings performance of the energy sector to that of the S&P 500 companies as a whole. Analysts expect earnings to be flat or even decline modestly in the first half of 2016, but to turn more sharply positive in the third quarter of 2016. As the U.S. economy enters its seventh year of expansion amid a slowdown in global growth and a challenging period for U.S. corporate earnings, the risk of recession remains somewhat elevated.
Those risks may have declined in the past month, although it’s impossible to pinpoint turning points in the economic cycle in real time. Growth remains muted, but there are some indications that the risk of a near-term recession are subsiding. In fact, much of the available data today indicates that the economy is not only growing, but also regathering some of the momentum lost late in 2015. Turning to market performance in February, equities had mixed results for the month.
In the U.S., mid caps led the pack, with the Russell MidCap index posting a gain of 1.1%. Both large caps and small caps ended the month essentially flat, despite what was a volatile path. The S&P 500 recorded a small loss of 0.1% and the Russell 2000 had no net movement during the month. While it’s still early, domestic equity indexes remain down year-to-date. At the end of February, small caps remained down by nearly 9% since the beginning of the year.
Large caps had slipped by about 5%, as shrinking risk appetites have swayed investors towards larger, more established companies. International equities were not immune to the continuing volatility, losing ground during the month. Emerging markets continued to face headwinds from the stronger dollar and capital flight, while returns in . 4 developed market stocks were boosted by some depreciation of the dollar relative to the Euro and Yen, but still underperformed U.S. markets for the month. The MCSI EAFE lost 1.8% in February and remains down by nearly 9.0% for the year, while the MSCI Emerging Markets Index gave up 0.2% last month, leaving it with a 6.6% loss year-to-date. Though global equities were flat or modestly negative in February, bonds rallied as the flight to quality pushed interest rates lower. The yield on the benchmark 10-year Treasury ended the month at 1.74%, down from 2.4% at the start of the year. The Barclays Aggregate added 0.7% last month, pushing its year-to-date gain to over 2.0%.
The Barclays 1-10 Year Muni Index gained 0.2%, lifting its year-to-date return to 1.3%. Domestic high yield and global credit indexes also advanced during the month, paring earlier declines. With the exception of the Barclays High Yield index, all are sitting on at least modest gains year-to-date. Overall, the first two months of 2016 serve as a good reminder of the critical role that bonds play in balancing a diversified portfolio, helping to minimize the volatility that can be associated with equities while providing a source of income. Periods of high volatility are inherently uncomfortable for investors, particularly as markets move lower.
However, volatility can generate big moves in both directions in the equity markets— BLOG Past performance does not guarantee future For other up-to-date economic briefs, visit PMFA’s Market Perspectives Blog at market-perspectivesblog.pmfa.com. PODCAST “Perspectives,” our monthly podcast, offers an abridged version of our monthly Market Perspectives. To listen, please visit iTunes or wealth.plantemoran.com. results. All investments include risk and have the potential for loss as well as gain. Data sources for peer group comparisons, returns, and standard statistical data are provided by the sources referenced and are based on data obtained from recognized statistical services or other sources believed to be reliable.
However, some or all of the information has not been verified prior to the analysis, and we do not make any representations as to its accuracy or completeness. Any analysis nonfactual in nature constitutes only current opinions, which are subject to change. Benchmarks or indices are included for information purposes only to reflect the current market environment; no index is a directly tradable investment. There may be instances when consultant opinions regarding any fundamental or quantitative analysis may not agree. Plante Moran Financial Advisors (PMFA) publishes this update to convey general information about market conditions and not for the purpose of providing investment advice.
Investment in any of the companies or sectors mentioned herein may not be appropriate for you. You should consult a representative from PMFA for investment advice regarding your own situation. such as those we witnessed in February. During such periods, it’s appropriate to reaffirm your return objectives, investment time horizon, and tolerance for risk. Most investors must assume risk to reach their goals, but finding the right level of risk that will enable them to remain committed to their strategy is critical. Failure to take sufficient risk may put an otherwise achievable goal out of reach; assuming too much risk may result in a poorly timed decision to reduce portfolio risk when a correction occurs.
Most importantly, having a plan for dealing with market volatility – and then sticking with that plan when that volatility occurs – puts the investor in the best position to achieve their goals. GRATUITOUSLY UNNECESSARY NEWS OF THE MONTH One Half-Good Samaritan New York native Reilly Flaherty lost his wallet at a concert in Brooklyn last month and assumed his cash, IDs and credit cards were gone forever. He was surprised, therefore, to find an envelope in the mail containing some of what he had lost along with a note two weeks later. Flaherty got back his credit cards and driver’s license, but not the cash, his metro card or the actual wallet. The accompanying note read: "I found your wallet, and your drivers license had your address so here's your credit cards and other important stuff. I kept the cash because I needed weed, the MetroCard because, well, the fare's $2.75 now, and the wallet 'cause it's kinda cool. Enjoy the rest of your day.
Toodles, Anonymous." Flaherty’s response to this half-Good Samaritan, half-thief was: "thanks... I think?" .
Plante Moran Financial Advisors


