Positive Momentum and Low Volatility - Eye on the market by Peter Greenberger – February 24, 2016
Raymond James Financial Services


Description
VOLUME 2 // ISSUE 05
FEBRUARY 24, 2016
by Peter Greenberger, CFA, CFP®
Director, Mutual Fund Research & Marketing
Member of Raymond James Investment Strategy Committee
& Thomas Ganey
Research Analyst, Mutual Fund Research & Marketing
C O M M E N TA R Y O N S P E C I F I C M A R K E T I S S U E S A N D A C T I O N A B L E I D E A S T O C O N S I D E R
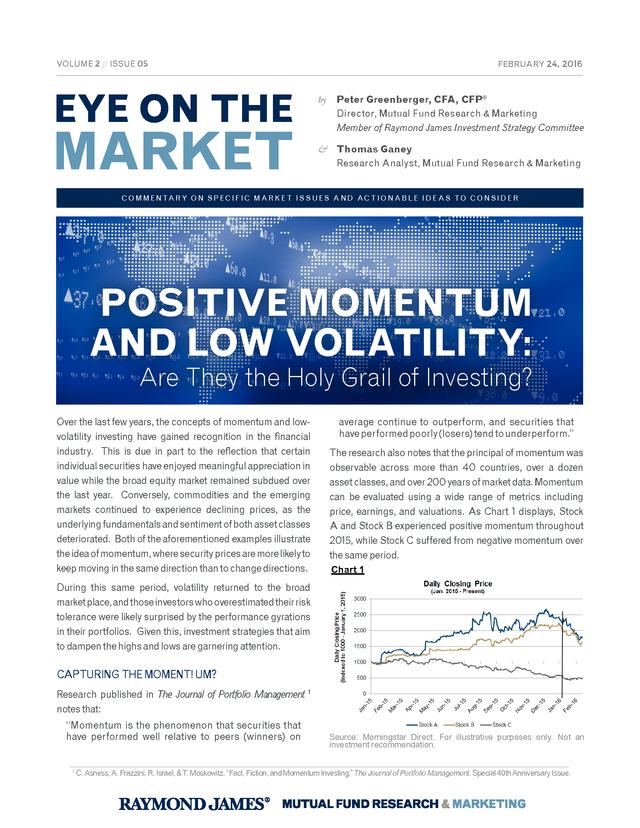
POSITIVE MOMENTUM
AND LOW VOLATILITY:
Are They the Holy Grail of Investing?
Over the last few years, the concepts of momentum and lowvolatility investing have gained recognition in the financial
industry. This is due in part to the reflection that certain
individual securities have enjoyed meaningful appreciation in
value while the broad equity market remained subdued over
the last year. Conversely, commodities and the emerging
markets continued to experience declining prices, as the
underlying fundamentals and sentiment of both asset classes
deteriorated. Both of the aforementioned examples illustrate
the idea of momentum, where security prices are more likely to
keep moving in the same direction than to change directions.
average continue to outperform, and securities that
have performed poorly (losers) tend to underperform.”
The research also notes that the principal of momentum was
observable across more than 40 countries, over a dozen
asset classes, and over 200 years of market data.
Momentum can be evaluated using a wide range of metrics including price, earnings, and valuations. As Chart 1 displays, Stock A and Stock B experienced positive momentum throughout 2015, while Stock C suffered from negative momentum over the same period. Chart 1 During this same period, volatility returned to the broad market place, and those investors who overestimated their risk tolerance were likely surprised by the performance gyrations in their portfolios. Given this, investment strategies that aim to dampen the highs and lows are garnering attention. CAPTURING THE MOMENT! UM? Research published in The Journal of Portfolio Management notes that: “Momentum is the phenomenon that securities that have performed well relative to peers (winners) on 1 1 Source: Morningstar Direct.
For illustrative purposes only. Not an investment recommendation. C. Asness, A.
Frazzini, R. Israel, & T. Moskowitz.
“Fact, Fiction, and Momentum Investing.” The Journal of Portfolio Management. Special 40th Anniversary Issue. . t basis, and can be evaluated on more than just individual stocks. As the chart indicates for the period of February 2006 through EYE ON THE MARKET FEBRUARY 24, 2016 February 2011, as denoted by the red circle, the price to earnings ratio (“P/E”) of the MSCI Emerging Market While both Stock Equity Index was generally A and Stock B have since experienced a LESS IS MORE trend reversal, it is possible for positive momentum 500, except following the financial crisis. Since the latter half of 2011, the of their higher than the P/E for the S&P It is perfectly understandable that an investor would want underlying fundamentals to for the emerging market equity index has been below that of the S&P 500, as highlighted in the P/E ratio continue over longer periods of to capture as much of upside and little to any of downside time because of how each drives future growth of its business. can be tied to long-term fundamental factors.
This included rapid blue circle. Both periods momentum momentum. To that end, Eye on the Market (“EotM”) urges the It is worth notinggrowth within emerging market economies leading to relatively higher P/E ratios during the earlier period, that momentum and investor sentiment consideration of strategies that limit the overall exposure to while The authors of the research article are not to be confused.
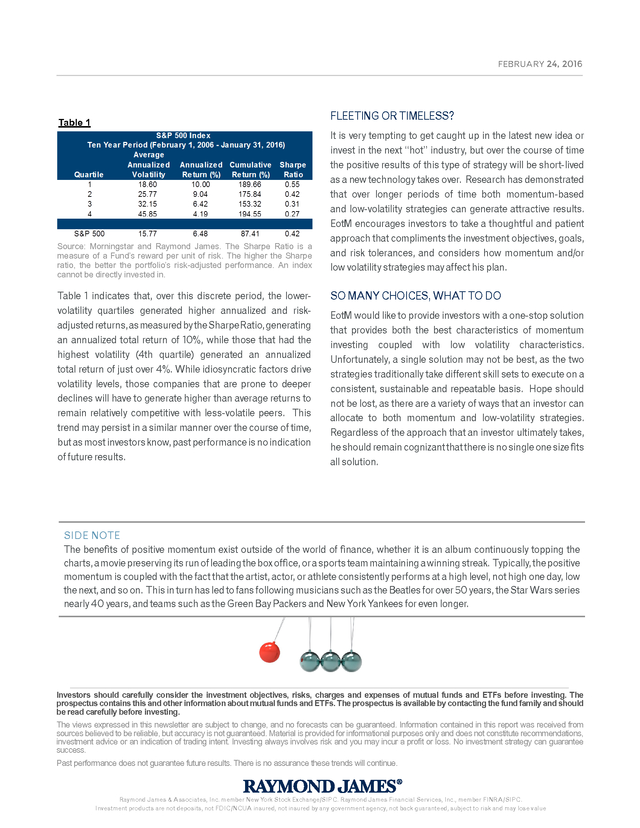
a decline in commodity prices, a rising U.S. dollar, and factors have led to a lower relative P/E ratio market volatility, particularly as volatility, as measured by the since 2011. Will these trends reverse? note that momentum, both positive and negative, can occur They may as trends shift when long-term fundamentals change, Chicago Board Options Exchange (“CBOE”) Volatility Index as has time.
On the other hand, investor over protracted periods ofbeen the case in previous economic cycles. (“VIX”) has increased, as noted on Chart 3, since the start of sentiment can vary by the day. 2015. Less Is More Chart 2 Chart 3 It is perfectly understandable that an investor would want to capture as much of upside and little to any of downside momentum. To that end, EotM urges the consideration of strategies that limit the overall exposure to market volatility, d of particularly as volatility, as measured by gh the Chicago Board Options Exchange noted (“CBOE”) Volatility Index (“VIX”) has price to increased as noted on Chart 3 since the of the et start of 2015. This matters, as the Source: Morningstar Direct.
Thelikely to become more Index is erally investor is MSCI Emerging Markets risk emerging or the S&P 500, a market capitalization-weighted index of stocks from 26of 2011, the Source: Morningstar and Raymond James. The Chicago Board except following the financial crisis. possibly exit the market adverse, and Since the latter half markets that only includes issues that may be traded by foreign Options Exchange (“CBOE”) Volatility Index (“VIX”) is a key measure ging market equity index has been belowIndexof the S&P 500, as highlighted in the that is a market-capitalization weighted investors.
The S&Pduring periods of heightened volatility, 500 of market expectations of near-term volatility conveyed by S&P 500 ods of momentum can be tied to long-term fundamental factors. This included rapid stock index option prices. An index cannot be invested in directly. index of 500 stocks, and is generally considered representative of the U.S.
stock market. particularly when the volatility is to period, ng market economies leading to relatively higher P/E ratios during the earlier the mmodity prices, a rising U.S. dollar, downside.
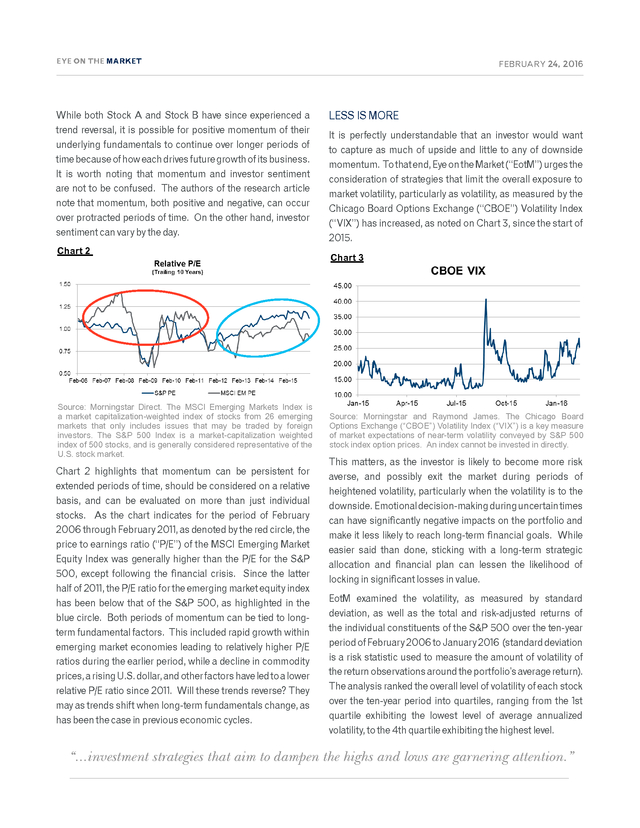
have led to a lower relative P/E ratio This matters,times can have is likely to become more risk on and factors Emotional decision-making during uncertain as the investor significantly negative impacts Chart 2 highlights that momentum can be persistent for the portfolio and make it less likely to reach averse, and possibly exit the market during than done, long-term financial goals. While easier said periods of e trends reverse? They may as trends shift when long-term fundamentals change, extended periods of time, should be considered on a relative in previous economic cycles. sticking with a long-term strategic allocationheightened volatility,can lessen the likelihood of locking in and financial plan particularly when the volatility is to the basis, and can be evaluatedlosses in value.just individual significant on more than downside. Emotional decision-making during uncertain times stocks.
As the chart indicates for the period of February can have significantly negative impacts on the portfolio and EotM examined the volatility, as measured by standard deviation, as well as the total and risk-adjusted andable that an2006 through February 2011, as denoted by the red circle, the make it less likely to reach long-term financial goals. While returns of the individual constituents of o capture as much to earnings ratio (“P/E”) of the MSCI Emerging Marketthe S&P 500 over the ten-year period of February 2006 to January price any of downside 2016. (Standard deviation for risk statistic easier to measure the amount of volatility of the return used said than done, sticking with a long-term strategic Equity Index was generally higher than the P/Eis a the S&P end, EotM urges the allocationThe analysis ranked thelessen the likelihood of of observations around the portfolio’s average return.) and financial plan can overall level of volatility 500, except following the financial crisis.
Since the latter egies that limit the locking in significant losses in value. arket volatility, half of 2011, the P/E ratio for the emerging market equity index EotM examined the volatility, as measured by standard y, as measured by been below that of the S&P 500, as highlighted in the has ptions Exchange deviation, as well as the total and risk-adjusted returns of blue circle. Both periods of momentum can be tied to longdex (“VIX”) has the individual constituents of the S&P 500 over the ten-year n Chart 3 since term fundamental factors. This included rapid growth within the period of February 2006 to January 2016 (standard deviation atters, as the emerging market economies leading to relatively higher P/E is a risk statistic used to measure the amount of volatility of come more risk ratios during the earlier period, while a decline in commodity y exit the market the return observations around the portfolio’s average return). prices, a rising U.S.
dollar, and other factors have led to a lower ghtened volatility, The analysis ranked the overall level of volatility of each stock relative P/E ratio since 2011. Will these trends reverse? They volatility is to the over the ten-year period into quartiles, ranging from the 1st decision-making during uncertain times can have significantly negative impacts on may as trends shift when long-term fundamentals change, as e it less likely to reach long-term financial goals. While easier said than done, quartile exhibiting the lowest level of average annualized has been the case in previous economic cycles. rm strategic allocation and financial plan can lessen the likelihood of locking in volatility, to the 4th quartile exhibiting the highest level. ed d be ve aluated vidual alue. “...investment strategies that aim to dampen the highs and lows are garnering attention.” olatility, as measured by standard deviation, as well as the total and risk-adjusted al constituents of the S&P 500 over the ten-year period of February 2006 to January ation is a risk statistic used to measure the amount of volatility of the return the portfolio’s average return.) The analysis ranked the overall level of volatility of .
st each stock over the ten-year period into quartiles, ranging from the 1 quartile exhibiting the lowest level th of average annualized volatility to the 4 quartile exhibiting the highest level. FEBRUARY 24, 2016 Table 1 indicates that over this discrete period, the lower-volatility quartiles generated higher annualized and risk-adjusted returns, as measured by the Sharpe Ratio. Each company in the index will ultimately FLEETING OR own, have to stand on its TIMELESS? Table 1 demonstrating its capability of It is very tempting to get caught generating attractive earnings, strong up in the latest new idea or invest in the next “hot” industry, fundamentals, and competitiveness, but over the course of time but those that exhibited of this type of strategy will be short-lived the positive results lower st volatility (1 quartile) generated an as a new technology takes over. Research has demonstrated annualized total return of 10%, while that over longer periods of those that had the highest volatility time both momentum-based th (4 and low-volatility strategies can generate attractive results. quartile) generated an annualized total return of just overinvestors to take a thoughtful and patient EotM encourages 4%. While each company will have different approach that compliments the investment objectives, goals, Source: Morningstar and Raymond James.
The Sharpe Ratio is a variables that will drive it to have and risk tolerances, and those measure of a Fund’s reward per unit of risk. The higher the Sharpe either high or low volatility, for considers how momentum and/or ratio, the better the portfolio’s risk-adjusted performance. An index companies that strategies may affect his plan. low volatility are prone to deeper cannot be directly invested in. declines, higher returns will be necessary in order to remain Table 1 indicates that, over this discrete period, the lowerSO MANY CHOICES, WHAT TO DO relatively competitive with their lessvolatility quartiles generated higher annualized and riskvolatile peers.
This trend may persist in a similar manner over the course of would like to provide investors with a one-stop solution EotM time, but as most investors know, past performance is no indication of future results. adjusted returns, as measured by the Sharpe Ratio, generating that provides both the best characteristics of momentum an annualized total return of 10%, while those that had the investing coupled with low volatility characteristics. Fleeting or Timeless highest volatility (4th quartile) generated an annualized Unfortunately, a single solution may not be best, as the two It is very tempting to over 4%. While the latest new factorsinvest in the next “hot” industry, but over the total return of just get caught up in idiosyncratic idea or drive strategies traditionally take different skill sets to execute on a course of time the positive results of this type of strategy will be short-lived as a new technology takes volatility levels, those companies that are prone to deeper over. Research has demonstrated that over longer periods of time both momentum-based and low- repeatable basis.
Hope should consistent, sustainable and declines will have to generate higher than average returns to volatility strategies can generate attractive results. EotM encourages our investor to take a thoughtful andof ways that an investor can not be lost, as there are a variety patient approach, that marries well with investment objectives, goals, and risk tolerances, and consider remain relatively competitive with less-volatile peers. This allocate to both momentum and low-volatility strategies. how momentum and/or low volatility strategies may help augment his plans. trend may persist in a similar manner over the course of time, Regardless of the approach that an investor ultimately takes, but as most investors know, past So Many Choices, What To Do performance is no indication he should remain cognizant that there is no single one size fits of future results. all solution. EotM would like to provide investors with a one-stop solution that provides both the best characteristics of momentum investing coupled with low volatility characteristics.
Unfortunately, a single solution may not be best, as the two strategies traditionally take different skill sets to execute on a consistent, sustainable and repeatable basis. Hope should not be lost, as there are a variety of ways that an investor can allocate to both momentum and low-volatility strategies including, exchange traded funds, mutual funds, and separately managed accounts. That being said, Mutual Fund Research & Marketing (“MFRM”) currently NOTE SIDE has several strategies on the Highly Recommended Funds List that historically have had lower levels of volatility relative to their peer groups and many commonly followed indexes.
This includes the The benefits of positive momentum exist outside of the world of finance, whether it is an album continuously topping the BlackRock Multi-Asset Income Fund, the Federated Strategic Value Dividend Fund, and the Western charts, a movie preserving its run of leading the box office, or a sports team maintaining a winning streak. Typically, the positive Asset Total Return Unconstrained Fund. While not on the Highly Recommended Funds List, MFRM momentum is coupled with the fact that the artist, actor, or athlete consistently performs at a high believes that the Nuveen Symphony Low Volatility and the SEI U.S.
Managed Volatility Funds also merit level, not high one day, low the next, and consideration. so on. This in turn has led to fans following musicians such as the Beatles for over 50 years, the Star Wars series nearly 40 years, and teams such as the Green Bay Packers and New York Yankees for even longer. Investors should carefully consider the investment objectives, risks, charges and expenses of mutual funds and ETFs before investing.
The prospectus contains this and other information about mutual funds and ETFs. The prospectus is available by contacting the fund family and should be read carefully before investing. The views expressed in this newsletter are subject to change, and no forecasts can be guaranteed. Information contained in this report was received from sources believed to be reliable, but accuracy is not guaranteed.
Material is provided for informational purposes only and does not constitute recommendations, investment advice or an indication of trading intent. Investing always involves risk and you may incur a profit or loss. No investment strategy can guarantee success. Past performance does not guarantee future results.
There is no assurance these trends will continue. Raymond James & Associates, Inc. member New York Stock Exchange/SIPC. Raymond James Financial Services, Inc., member FINRA/SIPC. Investment products are not deposits, not FDIC/NCUA insured, not insured by any government agency, not back guaranteed, subject to risk and may lose value .
Momentum can be evaluated using a wide range of metrics including price, earnings, and valuations. As Chart 1 displays, Stock A and Stock B experienced positive momentum throughout 2015, while Stock C suffered from negative momentum over the same period. Chart 1 During this same period, volatility returned to the broad market place, and those investors who overestimated their risk tolerance were likely surprised by the performance gyrations in their portfolios. Given this, investment strategies that aim to dampen the highs and lows are garnering attention. CAPTURING THE MOMENT! UM? Research published in The Journal of Portfolio Management notes that: “Momentum is the phenomenon that securities that have performed well relative to peers (winners) on 1 1 Source: Morningstar Direct.
For illustrative purposes only. Not an investment recommendation. C. Asness, A.
Frazzini, R. Israel, & T. Moskowitz.
“Fact, Fiction, and Momentum Investing.” The Journal of Portfolio Management. Special 40th Anniversary Issue. . t basis, and can be evaluated on more than just individual stocks. As the chart indicates for the period of February 2006 through EYE ON THE MARKET FEBRUARY 24, 2016 February 2011, as denoted by the red circle, the price to earnings ratio (“P/E”) of the MSCI Emerging Market While both Stock Equity Index was generally A and Stock B have since experienced a LESS IS MORE trend reversal, it is possible for positive momentum 500, except following the financial crisis. Since the latter half of 2011, the of their higher than the P/E for the S&P It is perfectly understandable that an investor would want underlying fundamentals to for the emerging market equity index has been below that of the S&P 500, as highlighted in the P/E ratio continue over longer periods of to capture as much of upside and little to any of downside time because of how each drives future growth of its business. can be tied to long-term fundamental factors.
This included rapid blue circle. Both periods momentum momentum. To that end, Eye on the Market (“EotM”) urges the It is worth notinggrowth within emerging market economies leading to relatively higher P/E ratios during the earlier period, that momentum and investor sentiment consideration of strategies that limit the overall exposure to while The authors of the research article are not to be confused.
a decline in commodity prices, a rising U.S. dollar, and factors have led to a lower relative P/E ratio market volatility, particularly as volatility, as measured by the since 2011. Will these trends reverse? note that momentum, both positive and negative, can occur They may as trends shift when long-term fundamentals change, Chicago Board Options Exchange (“CBOE”) Volatility Index as has time.
On the other hand, investor over protracted periods ofbeen the case in previous economic cycles. (“VIX”) has increased, as noted on Chart 3, since the start of sentiment can vary by the day. 2015. Less Is More Chart 2 Chart 3 It is perfectly understandable that an investor would want to capture as much of upside and little to any of downside momentum. To that end, EotM urges the consideration of strategies that limit the overall exposure to market volatility, d of particularly as volatility, as measured by gh the Chicago Board Options Exchange noted (“CBOE”) Volatility Index (“VIX”) has price to increased as noted on Chart 3 since the of the et start of 2015. This matters, as the Source: Morningstar Direct.
Thelikely to become more Index is erally investor is MSCI Emerging Markets risk emerging or the S&P 500, a market capitalization-weighted index of stocks from 26of 2011, the Source: Morningstar and Raymond James. The Chicago Board except following the financial crisis. possibly exit the market adverse, and Since the latter half markets that only includes issues that may be traded by foreign Options Exchange (“CBOE”) Volatility Index (“VIX”) is a key measure ging market equity index has been belowIndexof the S&P 500, as highlighted in the that is a market-capitalization weighted investors.
The S&Pduring periods of heightened volatility, 500 of market expectations of near-term volatility conveyed by S&P 500 ods of momentum can be tied to long-term fundamental factors. This included rapid stock index option prices. An index cannot be invested in directly. index of 500 stocks, and is generally considered representative of the U.S.
stock market. particularly when the volatility is to period, ng market economies leading to relatively higher P/E ratios during the earlier the mmodity prices, a rising U.S. dollar, downside.
have led to a lower relative P/E ratio This matters,times can have is likely to become more risk on and factors Emotional decision-making during uncertain as the investor significantly negative impacts Chart 2 highlights that momentum can be persistent for the portfolio and make it less likely to reach averse, and possibly exit the market during than done, long-term financial goals. While easier said periods of e trends reverse? They may as trends shift when long-term fundamentals change, extended periods of time, should be considered on a relative in previous economic cycles. sticking with a long-term strategic allocationheightened volatility,can lessen the likelihood of locking in and financial plan particularly when the volatility is to the basis, and can be evaluatedlosses in value.just individual significant on more than downside. Emotional decision-making during uncertain times stocks.
As the chart indicates for the period of February can have significantly negative impacts on the portfolio and EotM examined the volatility, as measured by standard deviation, as well as the total and risk-adjusted andable that an2006 through February 2011, as denoted by the red circle, the make it less likely to reach long-term financial goals. While returns of the individual constituents of o capture as much to earnings ratio (“P/E”) of the MSCI Emerging Marketthe S&P 500 over the ten-year period of February 2006 to January price any of downside 2016. (Standard deviation for risk statistic easier to measure the amount of volatility of the return used said than done, sticking with a long-term strategic Equity Index was generally higher than the P/Eis a the S&P end, EotM urges the allocationThe analysis ranked thelessen the likelihood of of observations around the portfolio’s average return.) and financial plan can overall level of volatility 500, except following the financial crisis.
Since the latter egies that limit the locking in significant losses in value. arket volatility, half of 2011, the P/E ratio for the emerging market equity index EotM examined the volatility, as measured by standard y, as measured by been below that of the S&P 500, as highlighted in the has ptions Exchange deviation, as well as the total and risk-adjusted returns of blue circle. Both periods of momentum can be tied to longdex (“VIX”) has the individual constituents of the S&P 500 over the ten-year n Chart 3 since term fundamental factors. This included rapid growth within the period of February 2006 to January 2016 (standard deviation atters, as the emerging market economies leading to relatively higher P/E is a risk statistic used to measure the amount of volatility of come more risk ratios during the earlier period, while a decline in commodity y exit the market the return observations around the portfolio’s average return). prices, a rising U.S.
dollar, and other factors have led to a lower ghtened volatility, The analysis ranked the overall level of volatility of each stock relative P/E ratio since 2011. Will these trends reverse? They volatility is to the over the ten-year period into quartiles, ranging from the 1st decision-making during uncertain times can have significantly negative impacts on may as trends shift when long-term fundamentals change, as e it less likely to reach long-term financial goals. While easier said than done, quartile exhibiting the lowest level of average annualized has been the case in previous economic cycles. rm strategic allocation and financial plan can lessen the likelihood of locking in volatility, to the 4th quartile exhibiting the highest level. ed d be ve aluated vidual alue. “...investment strategies that aim to dampen the highs and lows are garnering attention.” olatility, as measured by standard deviation, as well as the total and risk-adjusted al constituents of the S&P 500 over the ten-year period of February 2006 to January ation is a risk statistic used to measure the amount of volatility of the return the portfolio’s average return.) The analysis ranked the overall level of volatility of .
st each stock over the ten-year period into quartiles, ranging from the 1 quartile exhibiting the lowest level th of average annualized volatility to the 4 quartile exhibiting the highest level. FEBRUARY 24, 2016 Table 1 indicates that over this discrete period, the lower-volatility quartiles generated higher annualized and risk-adjusted returns, as measured by the Sharpe Ratio. Each company in the index will ultimately FLEETING OR own, have to stand on its TIMELESS? Table 1 demonstrating its capability of It is very tempting to get caught generating attractive earnings, strong up in the latest new idea or invest in the next “hot” industry, fundamentals, and competitiveness, but over the course of time but those that exhibited of this type of strategy will be short-lived the positive results lower st volatility (1 quartile) generated an as a new technology takes over. Research has demonstrated annualized total return of 10%, while that over longer periods of those that had the highest volatility time both momentum-based th (4 and low-volatility strategies can generate attractive results. quartile) generated an annualized total return of just overinvestors to take a thoughtful and patient EotM encourages 4%. While each company will have different approach that compliments the investment objectives, goals, Source: Morningstar and Raymond James.
The Sharpe Ratio is a variables that will drive it to have and risk tolerances, and those measure of a Fund’s reward per unit of risk. The higher the Sharpe either high or low volatility, for considers how momentum and/or ratio, the better the portfolio’s risk-adjusted performance. An index companies that strategies may affect his plan. low volatility are prone to deeper cannot be directly invested in. declines, higher returns will be necessary in order to remain Table 1 indicates that, over this discrete period, the lowerSO MANY CHOICES, WHAT TO DO relatively competitive with their lessvolatility quartiles generated higher annualized and riskvolatile peers.
This trend may persist in a similar manner over the course of would like to provide investors with a one-stop solution EotM time, but as most investors know, past performance is no indication of future results. adjusted returns, as measured by the Sharpe Ratio, generating that provides both the best characteristics of momentum an annualized total return of 10%, while those that had the investing coupled with low volatility characteristics. Fleeting or Timeless highest volatility (4th quartile) generated an annualized Unfortunately, a single solution may not be best, as the two It is very tempting to over 4%. While the latest new factorsinvest in the next “hot” industry, but over the total return of just get caught up in idiosyncratic idea or drive strategies traditionally take different skill sets to execute on a course of time the positive results of this type of strategy will be short-lived as a new technology takes volatility levels, those companies that are prone to deeper over. Research has demonstrated that over longer periods of time both momentum-based and low- repeatable basis.
Hope should consistent, sustainable and declines will have to generate higher than average returns to volatility strategies can generate attractive results. EotM encourages our investor to take a thoughtful andof ways that an investor can not be lost, as there are a variety patient approach, that marries well with investment objectives, goals, and risk tolerances, and consider remain relatively competitive with less-volatile peers. This allocate to both momentum and low-volatility strategies. how momentum and/or low volatility strategies may help augment his plans. trend may persist in a similar manner over the course of time, Regardless of the approach that an investor ultimately takes, but as most investors know, past So Many Choices, What To Do performance is no indication he should remain cognizant that there is no single one size fits of future results. all solution. EotM would like to provide investors with a one-stop solution that provides both the best characteristics of momentum investing coupled with low volatility characteristics.
Unfortunately, a single solution may not be best, as the two strategies traditionally take different skill sets to execute on a consistent, sustainable and repeatable basis. Hope should not be lost, as there are a variety of ways that an investor can allocate to both momentum and low-volatility strategies including, exchange traded funds, mutual funds, and separately managed accounts. That being said, Mutual Fund Research & Marketing (“MFRM”) currently NOTE SIDE has several strategies on the Highly Recommended Funds List that historically have had lower levels of volatility relative to their peer groups and many commonly followed indexes.
This includes the The benefits of positive momentum exist outside of the world of finance, whether it is an album continuously topping the BlackRock Multi-Asset Income Fund, the Federated Strategic Value Dividend Fund, and the Western charts, a movie preserving its run of leading the box office, or a sports team maintaining a winning streak. Typically, the positive Asset Total Return Unconstrained Fund. While not on the Highly Recommended Funds List, MFRM momentum is coupled with the fact that the artist, actor, or athlete consistently performs at a high believes that the Nuveen Symphony Low Volatility and the SEI U.S.
Managed Volatility Funds also merit level, not high one day, low the next, and consideration. so on. This in turn has led to fans following musicians such as the Beatles for over 50 years, the Star Wars series nearly 40 years, and teams such as the Green Bay Packers and New York Yankees for even longer. Investors should carefully consider the investment objectives, risks, charges and expenses of mutual funds and ETFs before investing.
The prospectus contains this and other information about mutual funds and ETFs. The prospectus is available by contacting the fund family and should be read carefully before investing. The views expressed in this newsletter are subject to change, and no forecasts can be guaranteed. Information contained in this report was received from sources believed to be reliable, but accuracy is not guaranteed.
Material is provided for informational purposes only and does not constitute recommendations, investment advice or an indication of trading intent. Investing always involves risk and you may incur a profit or loss. No investment strategy can guarantee success. Past performance does not guarantee future results.
There is no assurance these trends will continue. Raymond James & Associates, Inc. member New York Stock Exchange/SIPC. Raymond James Financial Services, Inc., member FINRA/SIPC. Investment products are not deposits, not FDIC/NCUA insured, not insured by any government agency, not back guaranteed, subject to risk and may lose value .


