


Description
Our Perspective
TAX FREEDOM DAY® 2016: APRIL 2016
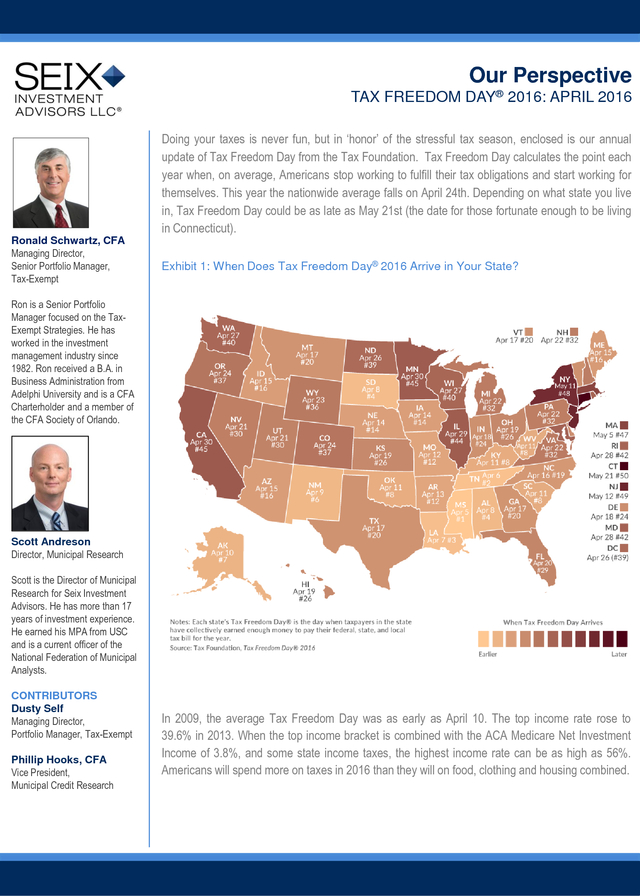
Doing your taxes is never fun, but in ‘honor’ of the stressful tax season, enclosed is our annual
update of Tax Freedom Day from the Tax Foundation. Tax Freedom Day calculates the point each
year when, on average, Americans stop working to fulfill their tax obligations and start working for
themselves. This year the nationwide average falls on April 24th. Depending on what state you live
in, Tax Freedom Day could be as late as May 21st (the date for those fortunate enough to be living
in Connecticut).
Ronald Schwartz, CFA
Managing Director,
Senior Portfolio Manager,
Tax-Exempt
Exhibit 1: When Does Tax Freedom Day® 2016 Arrive in Your State?
Ron is a Senior Portfolio
Manager focused on the TaxExempt Strategies.
He has worked in the investment management industry since 1982. Ron received a B.A. in Business Administration from Adelphi University and is a CFA Charterholder and a member of the CFA Society of Orlando. Scott Andreson Director, Municipal Research Scott is the Director of Municipal Research for Seix Investment Advisors.
He has more than 17 years of investment experience. He earned his MPA from USC and is a current officer of the National Federation of Municipal Analysts. CONTRIBUTORS Dusty Self Managing Director, Portfolio Manager, Tax-Exempt Phillip Hooks, CFA Vice President, Municipal Credit Research In 2009, the average Tax Freedom Day was as early as April 10. The top income rate rose to 39.6% in 2013. When the top income bracket is combined with the ACA Medicare Net Investment Income of 3.8%, and some state income taxes, the highest income rate can be as high as 56%. Americans will spend more on taxes in 2016 than they will on food, clothing and housing combined. .
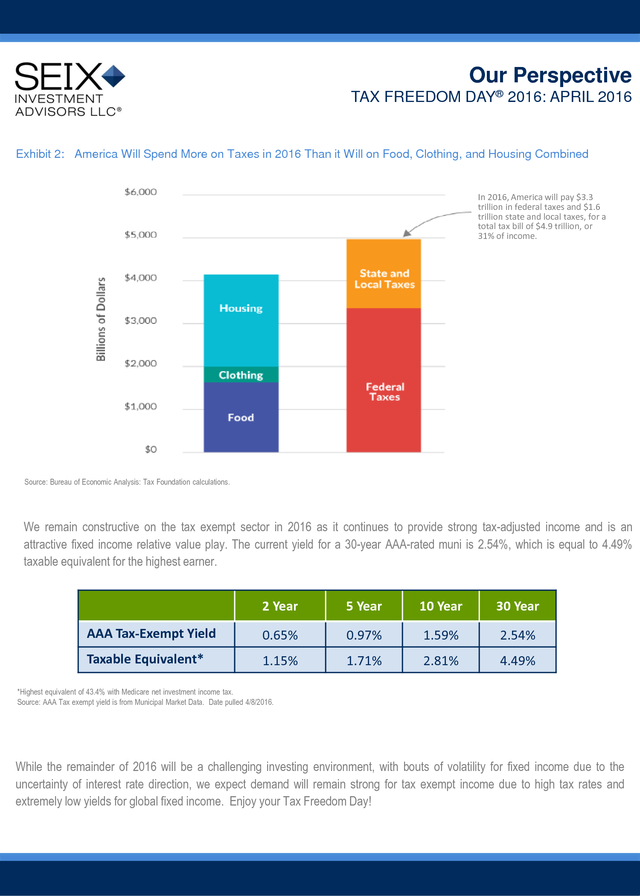
Our Perspective TAX FREEDOM DAY® 2016: APRIL 2016 Exhibit 2: America Will Spend More on Taxes in 2016 Than it Will on Food, Clothing, and Housing Combined In 2016, America will pay $3.3 trillion in federal taxes and $1.6 trillion state and local taxes, for a total tax bill of $4.9 trillion, or 31% of income. Source: Bureau of Economic Analysis: Tax Foundation calculations. We remain constructive on the tax exempt sector in 2016 as it continues to provide strong tax-adjusted income and is an attractive fixed income relative value play. The current yield for a 30-year AAA-rated muni is 2.54%, which is equal to 4.49% taxable equivalent for the highest earner. 2 Year 5 Year 10 Year 30 Year AAA Tax-Exempt Yield 0.65% 0.97% 1.59% 2.54% Taxable Equivalent* 1.15% 1.71% 2.81% 4.49% *Highest equivalent of 43.4% with Medicare net investment income tax. Source: AAA Tax exempt yield is from Municipal Market Data. Date pulled 4/8/2016. While the remainder of 2016 will be a challenging investing environment, with bouts of volatility for fixed income due to the uncertainty of interest rate direction, we expect demand will remain strong for tax exempt income due to high tax rates and extremely low yields for global fixed income. Enjoy your Tax Freedom Day! .
Our Perspective TAX FREEDOM DAY® 2016: APRIL 2016 The assertions in this perspective are Seix Investment Advisors’ opinion. BofA Merrill Lynch Municipal Master Index tracks the performance of the investment-grade U.S. tax-exempt bond market. Qualifying bonds must have at least one year remaining term to maturity, a fixed coupon schedule, and an investment grade rating (based on average of Moody’s, S&P, and Fitch). Investment Risks: All investments involve risk. Debt securities (bonds) offer a relatively stable level of income, although bond prices will fluctuate providing the potential for principal gain or loss.
Intermediate-term, higher-quality bonds generally offer less risk than longer-term bonds and a lower rate of return. Generally, a portfolio’s fixed income securities will decrease in value if interest rates rise and vice versa. A portfolio’s income may be subject to certain state and local taxes and, depending on your tax status, the federal alternative minimum tax.
There is no guarantee a specific investment strategy will be successful. This information and general market-related projections are based on information available at the time, are subject to change without notice, are for informational purposes only, are not intended as individual or specific advice, may not represent the opinions of the entire firm, and may not be relied upon for individual investing purposes. Information provided is general and educational in nature, provided as general guidance on the subject covered, and is not intended to be authoritative. All information contained herein is believed to be correct, but accuracy cannot be guaranteed.
This information may coincide or conflict with activities of the portfolio managers. It is not intended to be, and should not be construed as investment, legal, estate planning, or tax advice. Seix Investment Advisors does not provide legal, estate planning or tax advice.
Investors are advised to consult with their investment processional about their specific financial needs and goals before making any investment decisions. Past performance is not indicative of future results. ©2016 Seix Investment Advisors LLC. Seix Investment Advisors is a registered investment adviser with the SEC and a member of the RidgeWorth Capital Management LLC network of investment firms. .
He has worked in the investment management industry since 1982. Ron received a B.A. in Business Administration from Adelphi University and is a CFA Charterholder and a member of the CFA Society of Orlando. Scott Andreson Director, Municipal Research Scott is the Director of Municipal Research for Seix Investment Advisors.
He has more than 17 years of investment experience. He earned his MPA from USC and is a current officer of the National Federation of Municipal Analysts. CONTRIBUTORS Dusty Self Managing Director, Portfolio Manager, Tax-Exempt Phillip Hooks, CFA Vice President, Municipal Credit Research In 2009, the average Tax Freedom Day was as early as April 10. The top income rate rose to 39.6% in 2013. When the top income bracket is combined with the ACA Medicare Net Investment Income of 3.8%, and some state income taxes, the highest income rate can be as high as 56%. Americans will spend more on taxes in 2016 than they will on food, clothing and housing combined. .
Our Perspective TAX FREEDOM DAY® 2016: APRIL 2016 Exhibit 2: America Will Spend More on Taxes in 2016 Than it Will on Food, Clothing, and Housing Combined In 2016, America will pay $3.3 trillion in federal taxes and $1.6 trillion state and local taxes, for a total tax bill of $4.9 trillion, or 31% of income. Source: Bureau of Economic Analysis: Tax Foundation calculations. We remain constructive on the tax exempt sector in 2016 as it continues to provide strong tax-adjusted income and is an attractive fixed income relative value play. The current yield for a 30-year AAA-rated muni is 2.54%, which is equal to 4.49% taxable equivalent for the highest earner. 2 Year 5 Year 10 Year 30 Year AAA Tax-Exempt Yield 0.65% 0.97% 1.59% 2.54% Taxable Equivalent* 1.15% 1.71% 2.81% 4.49% *Highest equivalent of 43.4% with Medicare net investment income tax. Source: AAA Tax exempt yield is from Municipal Market Data. Date pulled 4/8/2016. While the remainder of 2016 will be a challenging investing environment, with bouts of volatility for fixed income due to the uncertainty of interest rate direction, we expect demand will remain strong for tax exempt income due to high tax rates and extremely low yields for global fixed income. Enjoy your Tax Freedom Day! .
Our Perspective TAX FREEDOM DAY® 2016: APRIL 2016 The assertions in this perspective are Seix Investment Advisors’ opinion. BofA Merrill Lynch Municipal Master Index tracks the performance of the investment-grade U.S. tax-exempt bond market. Qualifying bonds must have at least one year remaining term to maturity, a fixed coupon schedule, and an investment grade rating (based on average of Moody’s, S&P, and Fitch). Investment Risks: All investments involve risk. Debt securities (bonds) offer a relatively stable level of income, although bond prices will fluctuate providing the potential for principal gain or loss.
Intermediate-term, higher-quality bonds generally offer less risk than longer-term bonds and a lower rate of return. Generally, a portfolio’s fixed income securities will decrease in value if interest rates rise and vice versa. A portfolio’s income may be subject to certain state and local taxes and, depending on your tax status, the federal alternative minimum tax.
There is no guarantee a specific investment strategy will be successful. This information and general market-related projections are based on information available at the time, are subject to change without notice, are for informational purposes only, are not intended as individual or specific advice, may not represent the opinions of the entire firm, and may not be relied upon for individual investing purposes. Information provided is general and educational in nature, provided as general guidance on the subject covered, and is not intended to be authoritative. All information contained herein is believed to be correct, but accuracy cannot be guaranteed.
This information may coincide or conflict with activities of the portfolio managers. It is not intended to be, and should not be construed as investment, legal, estate planning, or tax advice. Seix Investment Advisors does not provide legal, estate planning or tax advice.
Investors are advised to consult with their investment processional about their specific financial needs and goals before making any investment decisions. Past performance is not indicative of future results. ©2016 Seix Investment Advisors LLC. Seix Investment Advisors is a registered investment adviser with the SEC and a member of the RidgeWorth Capital Management LLC network of investment firms. .
Seix Investment Advisors


