Description
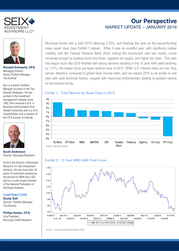
Our Perspective
MUNI YIELD LIMBO: HOW LOW CAN YOU GO? – FEBRUARY 2016
The assertions in this perspective are Seix Investment Advisors’ opinion.
Barclays Municipal Bond Index is a widely recognized index of investment grade tax-exempt bonds. The eight subsets of the Index are market weighted. The
Index includes general obligations, revenue bonds, insured bonds, and pre-refunded bonds.
Standard & Poor’s 500 Index is an unmanaged index of 500 selected common large capitalization stocks (most of which are listed on the New York Stock
Exchange) that is often used as a measure of the U.S. stock market.
Investors cannot invest directly in an index.
Credit Ratings noted herein are calculated based on S&P, Moody’s and Fitch ratings.
Generally, ratings range from AAA, the highest quality rating, to D, the lowest, with BBB and above being called investment grade securities. BB and below are considered below investment grade securities. If the ratings from all three agencies are available, securities will be assigned the median rating based on the numerical equivalents.
If the ratings are available from only two of the agencies, the more conservative of the ratings will be assigned to the security. If the rating is available from only one agency, then that rating will be used. Any security not rated by S&P, Moody’s, or Fitch is placed in the NR (Not Rated) category.
Ratings do not apply to a fund or to a fund’s shares. Ratings are subject to change. Investment Risks: All investments involve risk. Debt securities (bonds) offer a relatively stable level of income, although bond prices will fluctuate providing the potential for principal gain or loss.
Intermediate-term, higher-quality bonds generally offer less risk than longer-term bonds and a lower rate of return. Generally, a fund’s fixed income securities will decrease in value if interest rates rise and vice versa. A fund’s income may be subject to certain state and local taxes and, depending on your tax status, the federal alternative minimum tax.
There is no guarantee a specific investment strategy will be successful. This information and general market-related projections are based on information available at the time, are subject to change without notice, are for informational purposes only, are not intended as individual or specific advice, may not represent the opinions of the entire firm, and may not be relied upon for individual investing purposes. Information provided is general and educational in nature, provided as general guidance on the subject covered, and is not intended to be authoritative. All information contained herein is believed to be correct, but accuracy cannot be guaranteed.
This information may coincide or conflict with activities of the portfolio managers. It is not intended to be, and should not be construed as investment, legal, estate planning, or tax advice. Seix Investment Advisors does not provide legal, estate planning or tax advice.
Investors are advised to consult with their investment processional about their specific financial needs and goals before making any investment decisions. Past performance is not indicative of future results. ©2016 Seix Investment Advisors LLC. Seix Investment Advisors is a registered investment adviser with the SEC and a member of the RidgeWorth Capital Management LLC network of investment firms. .