


Description
Advisory Solutions Monthly Update
February 2017
ASSET ALLOCATION UPDATE
•
We recommend a mild underweight to Global Equities and overweight to Fixed Income across models.
•
Within the equity allocation, we continue to recommend an overweight to non-U.S. developed equity, concentrated in the growth segment.
•
Within the fixed income allocation, we recommend an overweight to U.S. TIPS.
EQUITY HIGHLIGHTS
•
•
•
FIXED INCOME HIGHLIGHTS
International and growth equities led the global equity markets higher in January,
which represented a change in market leadership from the U.S. and value equity
outperformance that occurred throughout much of 2016.
Emerging markets equites were particularly strong during the quarter. U.S. large-cap and mid-cap indexes reached all-time highs in late January.
After posting extraordinary gains after the U.S. elections, U.S. small-caps lagged large caps and mid-caps during the month. U.S.
equity managers generally performed in line their benchmarks in January, with small cap managers generally producing outperformance. International actively-managed equity strategies also started the year strongly, with developed markets and emerging markets managers outperforming on average during the month. • Fixed income markets were largely positive during the month of January. Within the opportunity set, high yield was once again the top performer, returning 1.45%, followed by emerging market debt, which returned 1.25%.
Global Treasuries ex U.S. produced the lowest return of -1.06%. The Bloomberg Barclays U.S. Aggregate Bond Index, a proxy for the overall bond market, returned 0.20% during the month. • Over the month, select international developed 10-year government bond yields increased, led by Italy and France.
The 10-year U.S. Treasury yield was unchanged at 2.45%. • Municipal/Treasury yield ratios moved lower for shorter-dated maturities and higher for longer-dated maturities. Ratios remain near historical averages across the curve. While international equities outpaced U.S.
equites during the first month of the year, U.S. equity relative outperformance has been substantial since the financial crisis. The relative performance of U.S.
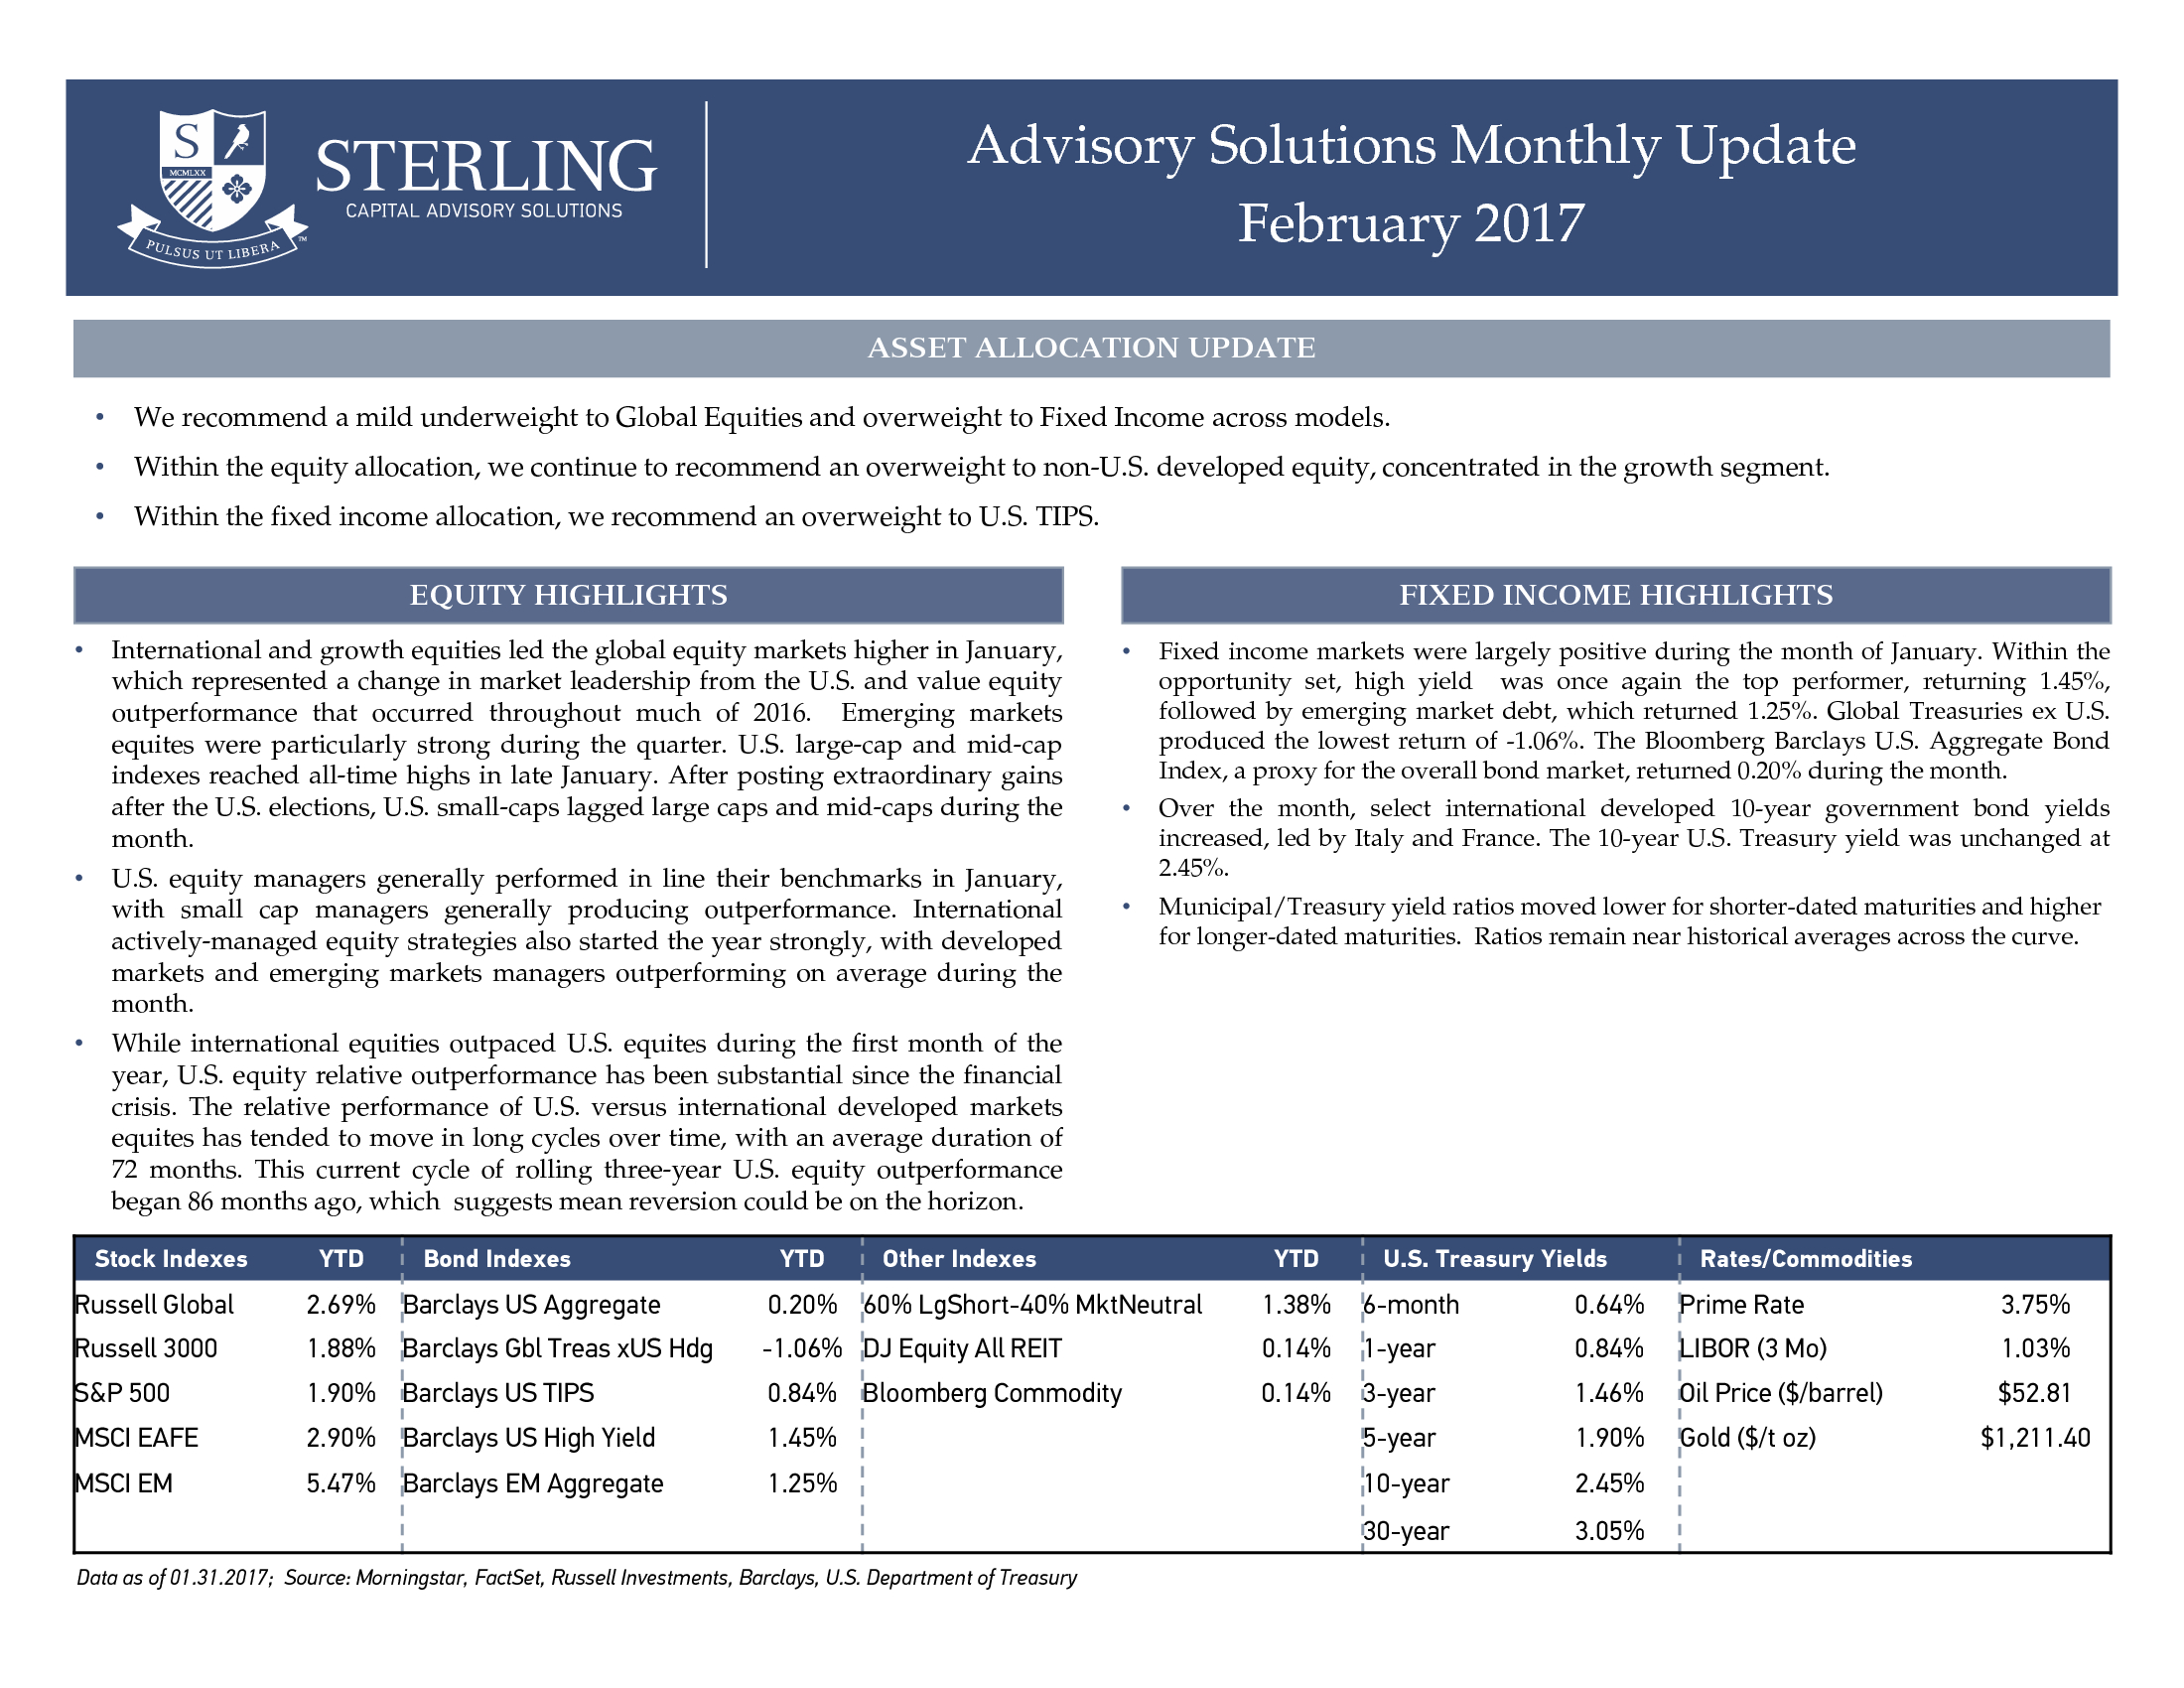
versus international developed markets equites has tended to move in long cycles over time, with an average duration of 72 months. This current cycle of rolling three-year U.S. equity outperformance began 86 months ago, which suggests mean reversion could be on the horizon. Stock Indexes YTD Bond Indexes YTD Other Indexes YTD U.S.
Treasury Yields Rates/Commodities Russell Global 2.69% Barclays US Aggregate 0.20% 60% LgShort-40% MktNeutral 1.38% 6-month 0.64% Prime Rate 3.75% Russell 3000 1.88% Barclays Gbl Treas xUS Hdg -1.06% DJ Equity All REIT 0.14% 1-year 0.84% LIBOR (3 Mo) 1.03% S&P 500 1.90% Barclays US TIPS 0.84% Bloomberg Commodity 0.14% 3-year 1.46% Oil Price ($/barrel) $52.81 MSCI EAFE 2.90% Barclays US High Yield 1.45% 5-year 1.90% Gold ($/t oz) MSCI EM 5.47% Barclays EM Aggregate 1.25% 10-year 2.45% 30-year 3.05% Data as of 01.31.2017; Source: Morningstar, FactSet, Russell Investments, Barclays, U.S. Department of Treasury $1,211.40 . YOY Real GDP Growth ($U.S.) 20.00 15.00 10.00 5.00 0.00 -5.00 -10.00 -15.00 -20.00 U.S. Eurozone U.S. Industrial Production (LHS) Japan Japan data as of 09.30.2016. U.S. and Eurozone data as of 12.31.2016.
Source: FactSet 7.00 5.00 3.00 1.00 -1.00 -3.00 -5.00 -7.00 U.S. Labor Productivity (RHS) Industrial Production as of 12.31.2016; U.S. Labor Productivity as of 12.31.2016; Source: FactSet Core Consumer Price Index (YoY Growth) U.S.
- Unemployment Rate 4.00 12.00 3.00 10.00 2.00 Percent (%) 1.00 0.00 -1.00 8.00 6.00 4.00 2.00 Feb-97 Sep-97 Apr-98 Nov-98 Jun-99 Jan-00 Aug-00 Mar-01 Oct-01 May-02 Dec-02 Jul-03 Feb-04 Sep-04 Apr-05 Nov-05 Jun-06 Jan-07 Aug-07 Mar-08 Oct-08 May-09 Dec-09 Jul-10 Feb-11 Sep-11 Apr-12 Nov-12 Jun-13 Jan-14 Aug-14 Mar-15 Oct-15 May-16 Dec-16 -2.00 U.S. Eurozone Japan U.S. data as of 12.31.2016; Eurozone data as of 01.31.2017. Japan data as of 12.31.2016; Source: FactSet The sudden increase in Japan CPI growth in 2014 coincided with an increase in national sales tax that impacted final price levels. 0.00 Feb-97 Oct-97 Jun-98 Feb-99 Oct-99 Jun-00 Feb-01 Oct-01 Jun-02 Feb-03 Oct-03 Jun-04 Feb-05 Oct-05 Jun-06 Feb-07 Oct-07 Jun-08 Feb-09 Oct-09 Jun-10 Feb-11 Oct-11 Jun-12 Feb-13 Oct-13 Jun-14 Feb-15 Oct-15 Jun-16 Percent (%) YoY U.S.
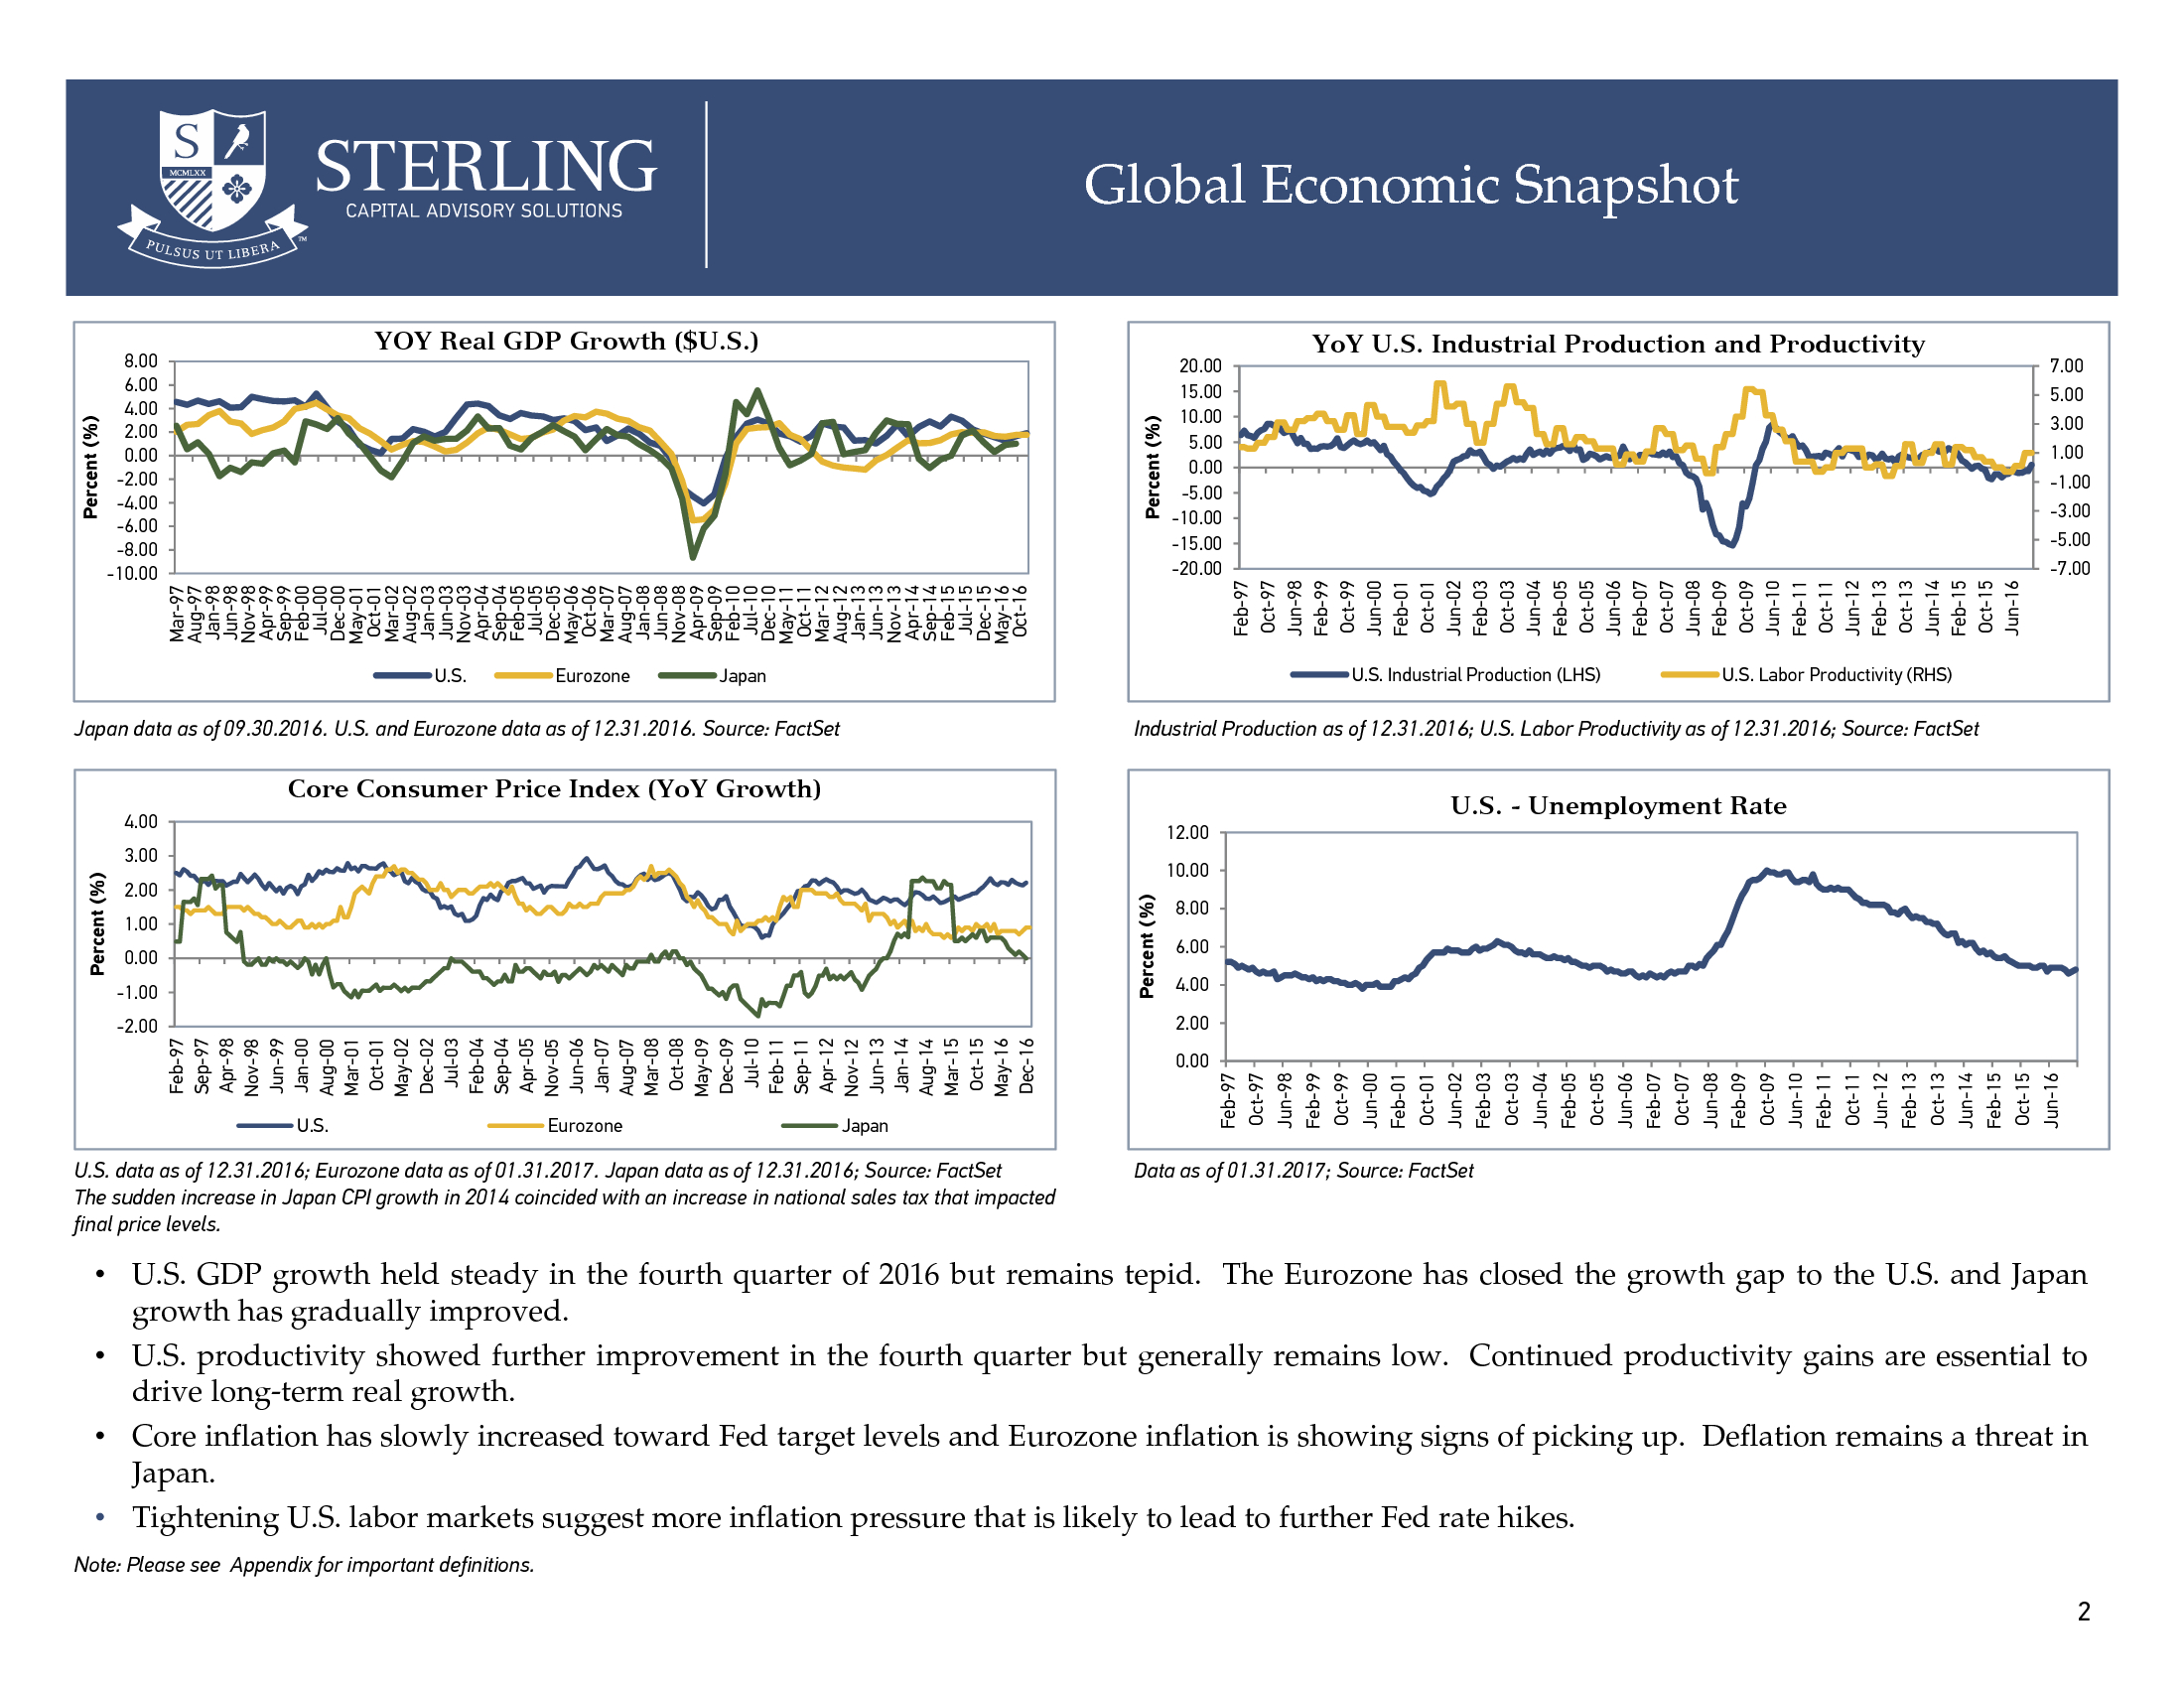
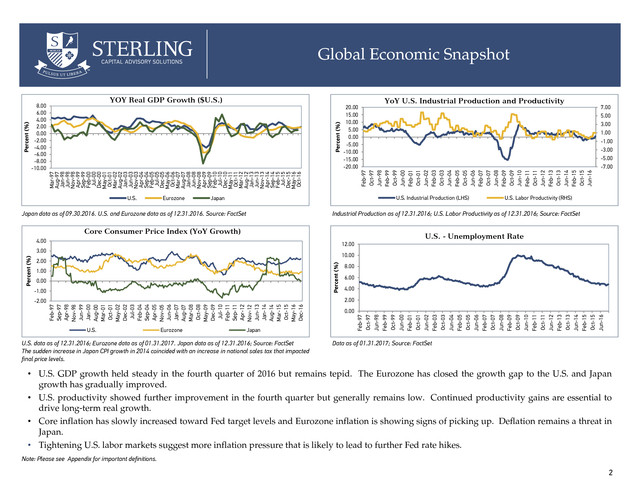
Industrial Production and Productivity Feb-97 Oct-97 Jun-98 Feb-99 Oct-99 Jun-00 Feb-01 Oct-01 Jun-02 Feb-03 Oct-03 Jun-04 Feb-05 Oct-05 Jun-06 Feb-07 Oct-07 Jun-08 Feb-09 Oct-09 Jun-10 Feb-11 Oct-11 Jun-12 Feb-13 Oct-13 Jun-14 Feb-15 Oct-15 Jun-16 Percent (%) 8.00 6.00 4.00 2.00 0.00 -2.00 -4.00 -6.00 -8.00 -10.00 Mar-97 Aug-97 Jan-98 Jun-98 Nov-98 Apr-99 Sep-99 Feb-00 Jul-00 Dec-00 May-01 Oct-01 Mar-02 Aug-02 Jan-03 Jun-03 Nov-03 Apr-04 Sep-04 Feb-05 Jul-05 Dec-05 May-06 Oct-06 Mar-07 Aug-07 Jan-08 Jun-08 Nov-08 Apr-09 Sep-09 Feb-10 Jul-10 Dec-10 May-11 Oct-11 Mar-12 Aug-12 Jan-13 Jun-13 Nov-13 Apr-14 Sep-14 Feb-15 Jul-15 Dec-15 May-16 Oct-16 Percent (%) Global Economic Snapshot Data as of 01.31.2017; Source: FactSet • U.S. GDP growth held steady in the fourth quarter of 2016 but remains tepid. The Eurozone has closed the growth gap to the U.S.
and Japan growth has gradually improved. • U.S. productivity showed further improvement in the fourth quarter but generally remains low. Continued productivity gains are essential to drive long-term real growth. • Core inflation has slowly increased toward Fed target levels and Eurozone inflation is showing signs of picking up.
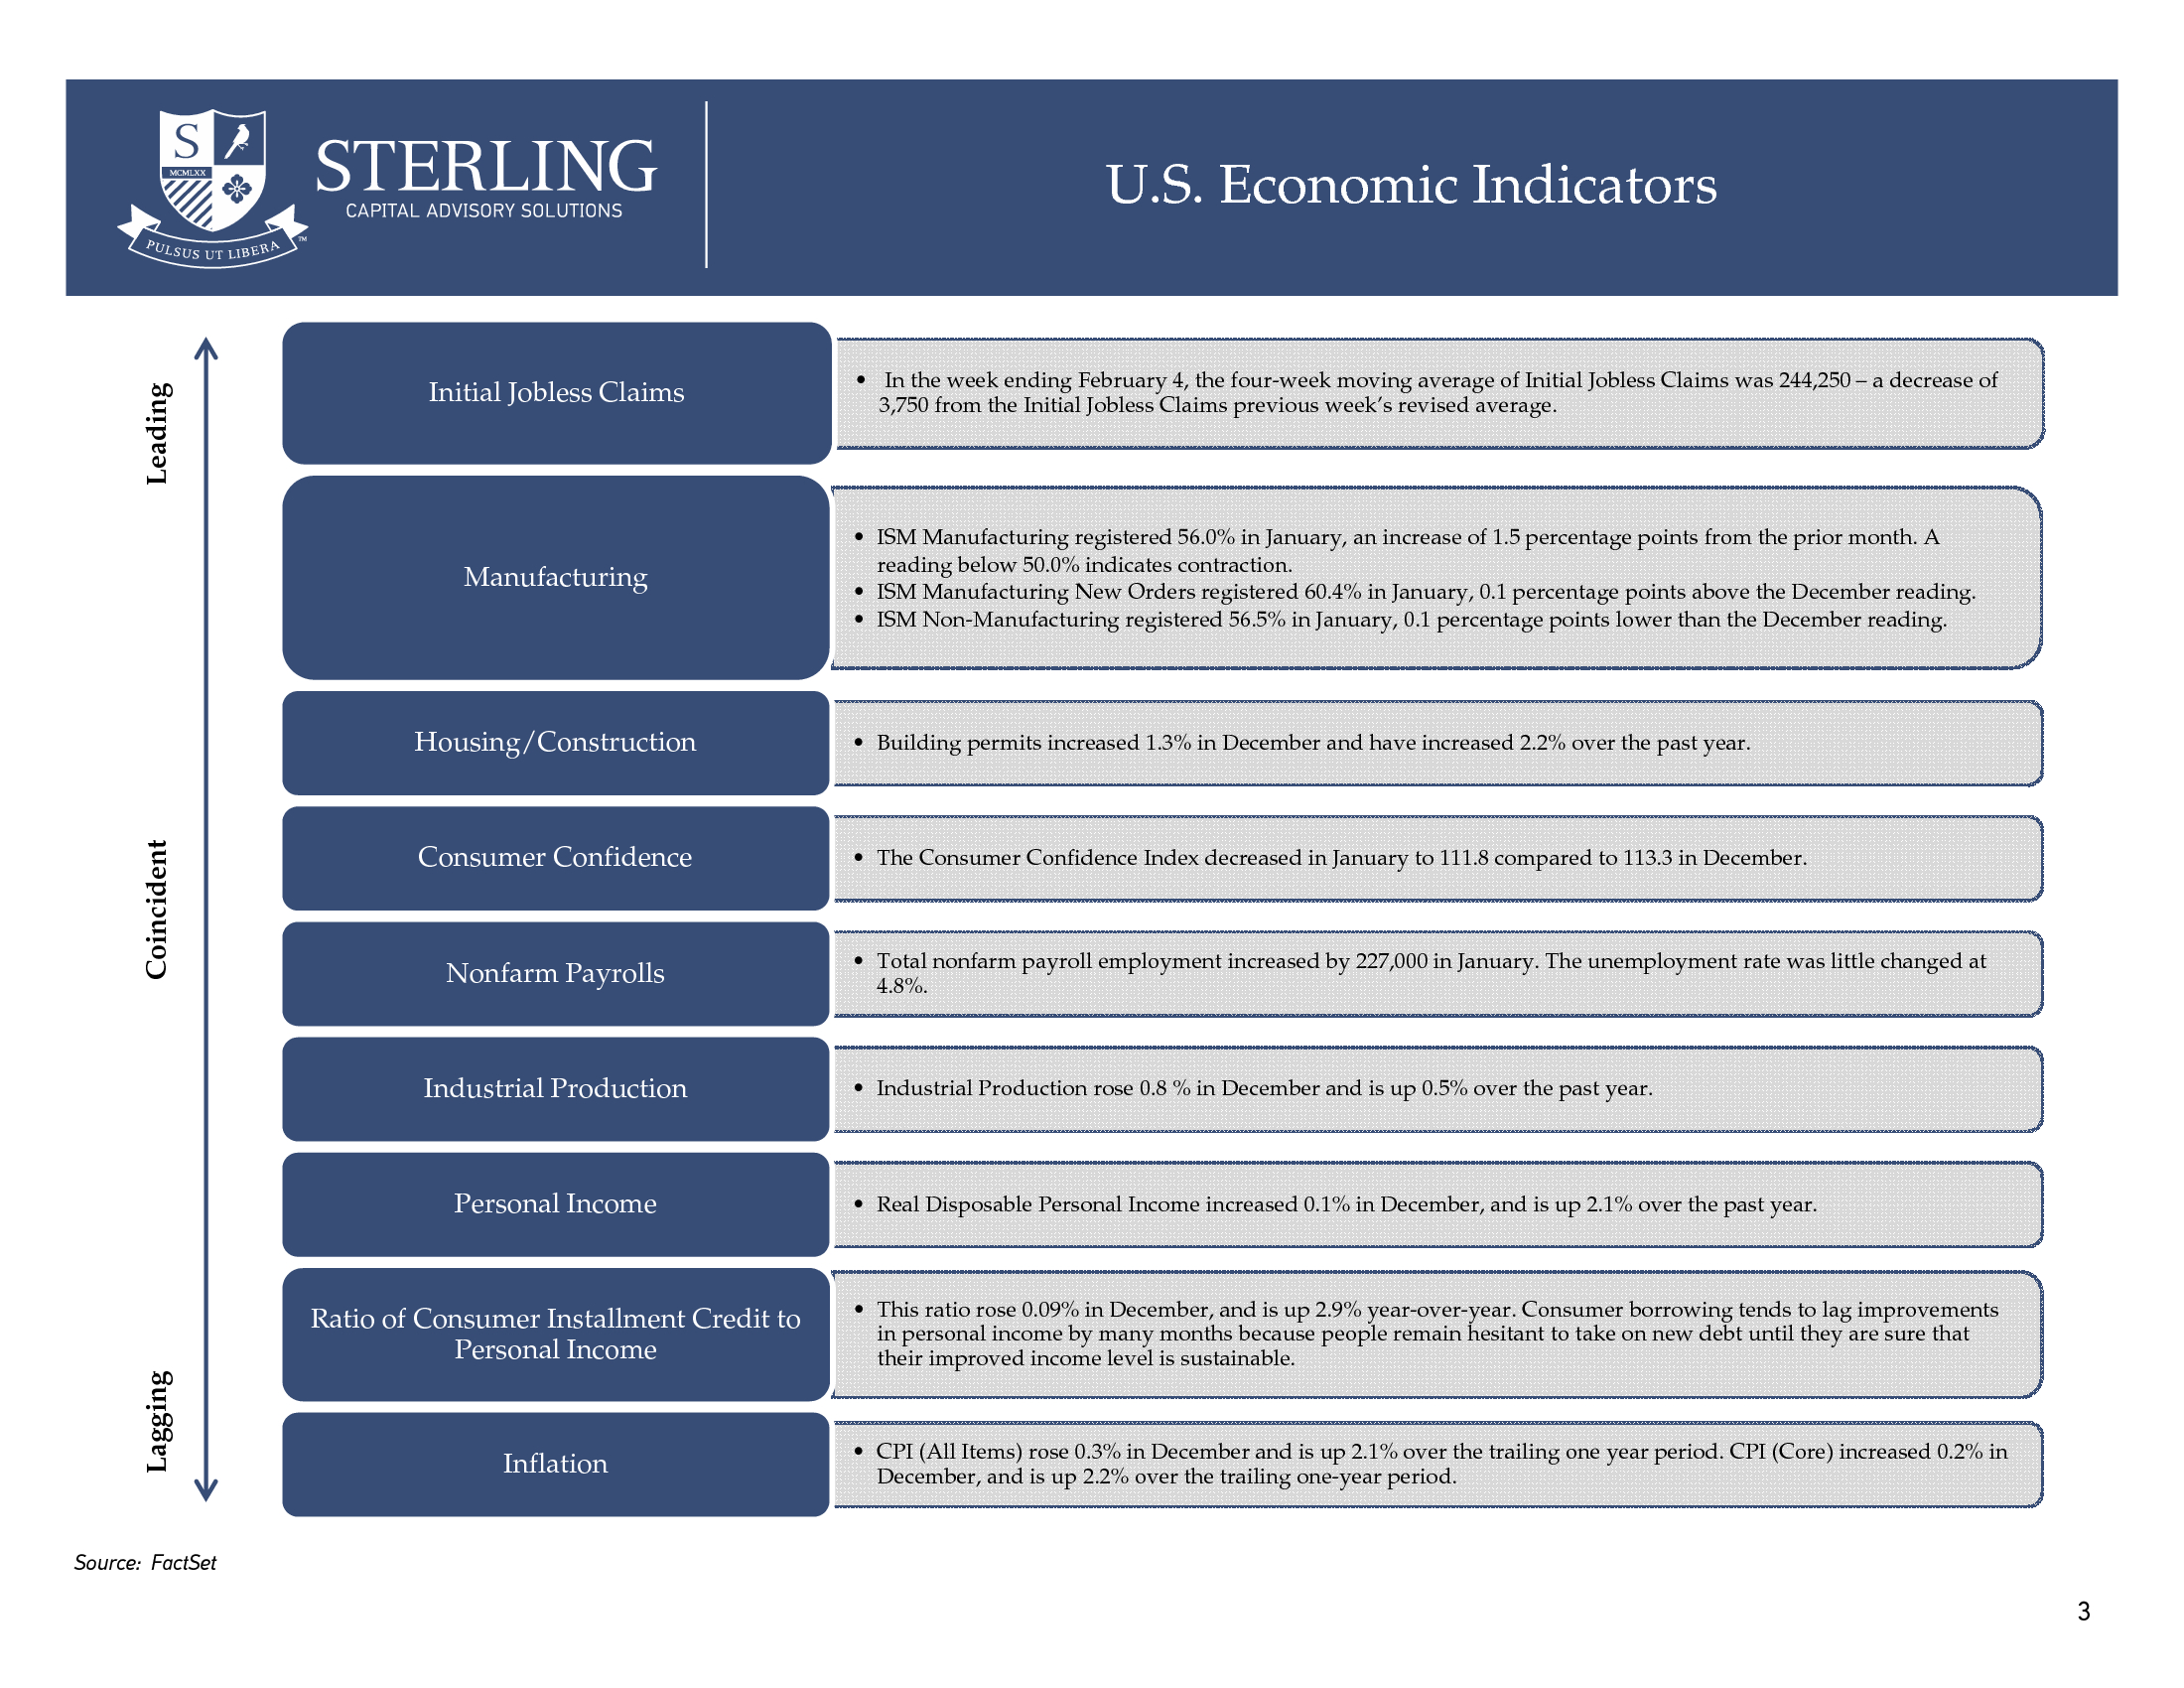
Deflation remains a threat in Japan. • Tightening U.S. labor markets suggest more inflation pressure that is likely to lead to further Fed rate hikes. Note: Please see Appendix for important definitions. 2 . Leading U.S. Economic Indicators Initial Jobless Claims Manufacturing • In the week ending February 4, the four-week moving average of Initial Jobless Claims was 244,250 – a decrease of 3,750 from the Initial Jobless Claims previous week’s revised average. • ISM Manufacturing registered 56.0% in January, an increase of 1.5 percentage points from the prior month. A reading below 50.0% indicates contraction. • ISM Manufacturing New Orders registered 60.4% in January, 0.1 percentage points above the December reading. • ISM Non-Manufacturing registered 56.5% in January, 0.1 percentage points lower than the December reading. Coincident Housing/Construction • Building permits increased 1.3% in December and have increased 2.2% over the past year. Consumer Confidence • The Consumer Confidence Index decreased in January to 111.8 compared to 113.3 in December. Nonfarm Payrolls Industrial Production Personal Income • Total nonfarm payroll employment increased by 227,000 in January. The unemployment rate was little changed at 4.8%. • Industrial Production rose 0.8 % in December and is up 0.5% over the past year. • Real Disposable Personal Income increased 0.1% in December, and is up 2.1% over the past year. Lagging Ratio of Consumer Installment Credit to Personal Income • This ratio rose 0.09% in December, and is up 2.9% year-over-year.
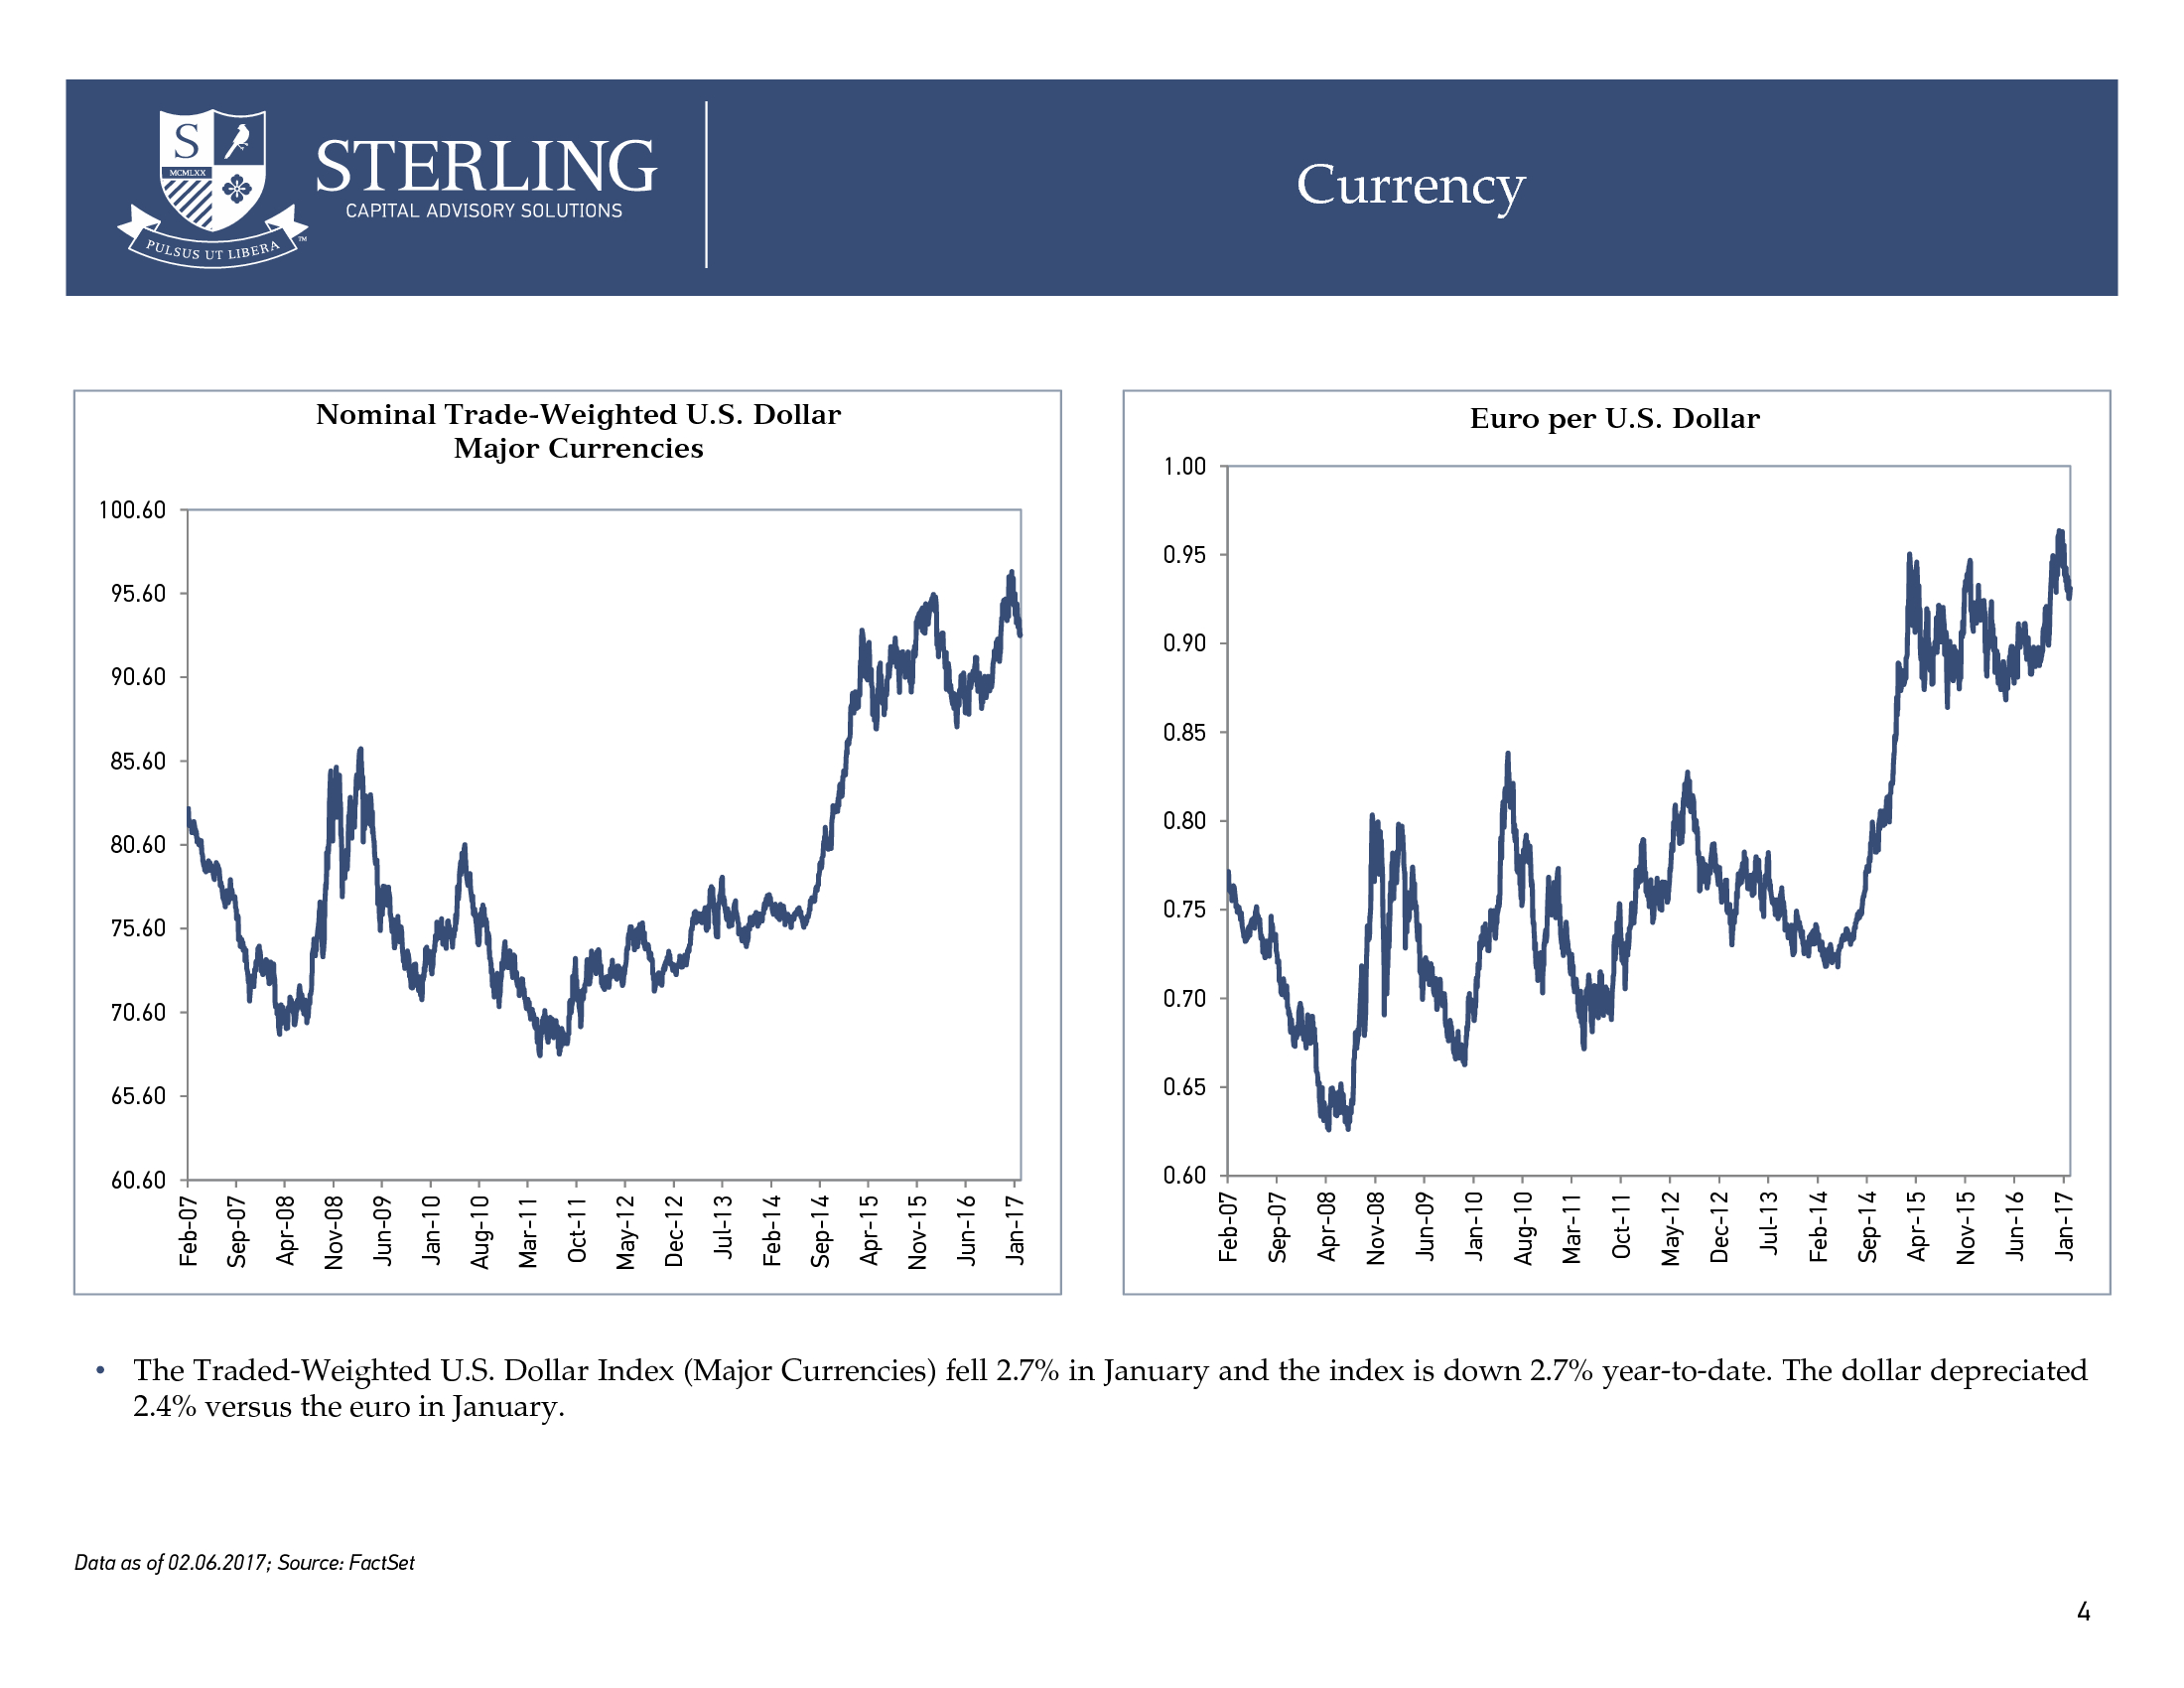
Consumer borrowing tends to lag improvements in personal income by many months because people remain hesitant to take on new debt until they are sure that their improved income level is sustainable. Inflation • CPI (All Items) rose 0.3% in December and is up 2.1% over the trailing one year period. CPI (Core) increased 0.2% in December, and is up 2.2% over the trailing one-year period. Source: FactSet 3 . Currency Nominal Trade-Weighted U.S. Dollar Major Currencies Euro per U.S. Dollar 1.00 100.60 0.95 95.60 0.90 90.60 0.85 85.60 0.80 80.60 0.75 75.60 0.70 70.60 Jan-17 Jun-16 Nov-15 Apr-15 Sep-14 Feb-14 Jul-13 Dec-12 May-12 Oct-11 Mar-11 Aug-10 Jan-10 Jun-09 Nov-08 Apr-08 Sep-07 Feb-07 Jan-17 Jun-16 Nov-15 Apr-15 Sep-14 Feb-14 Jul-13 Dec-12 May-12 Oct-11 Mar-11 Aug-10 Jan-10 Jun-09 Nov-08 0.60 Apr-08 60.60 Sep-07 0.65 Feb-07 65.60 • The Traded-Weighted U.S. Dollar Index (Major Currencies) fell 2.7% in January and the index is down 2.7% year-to-date.
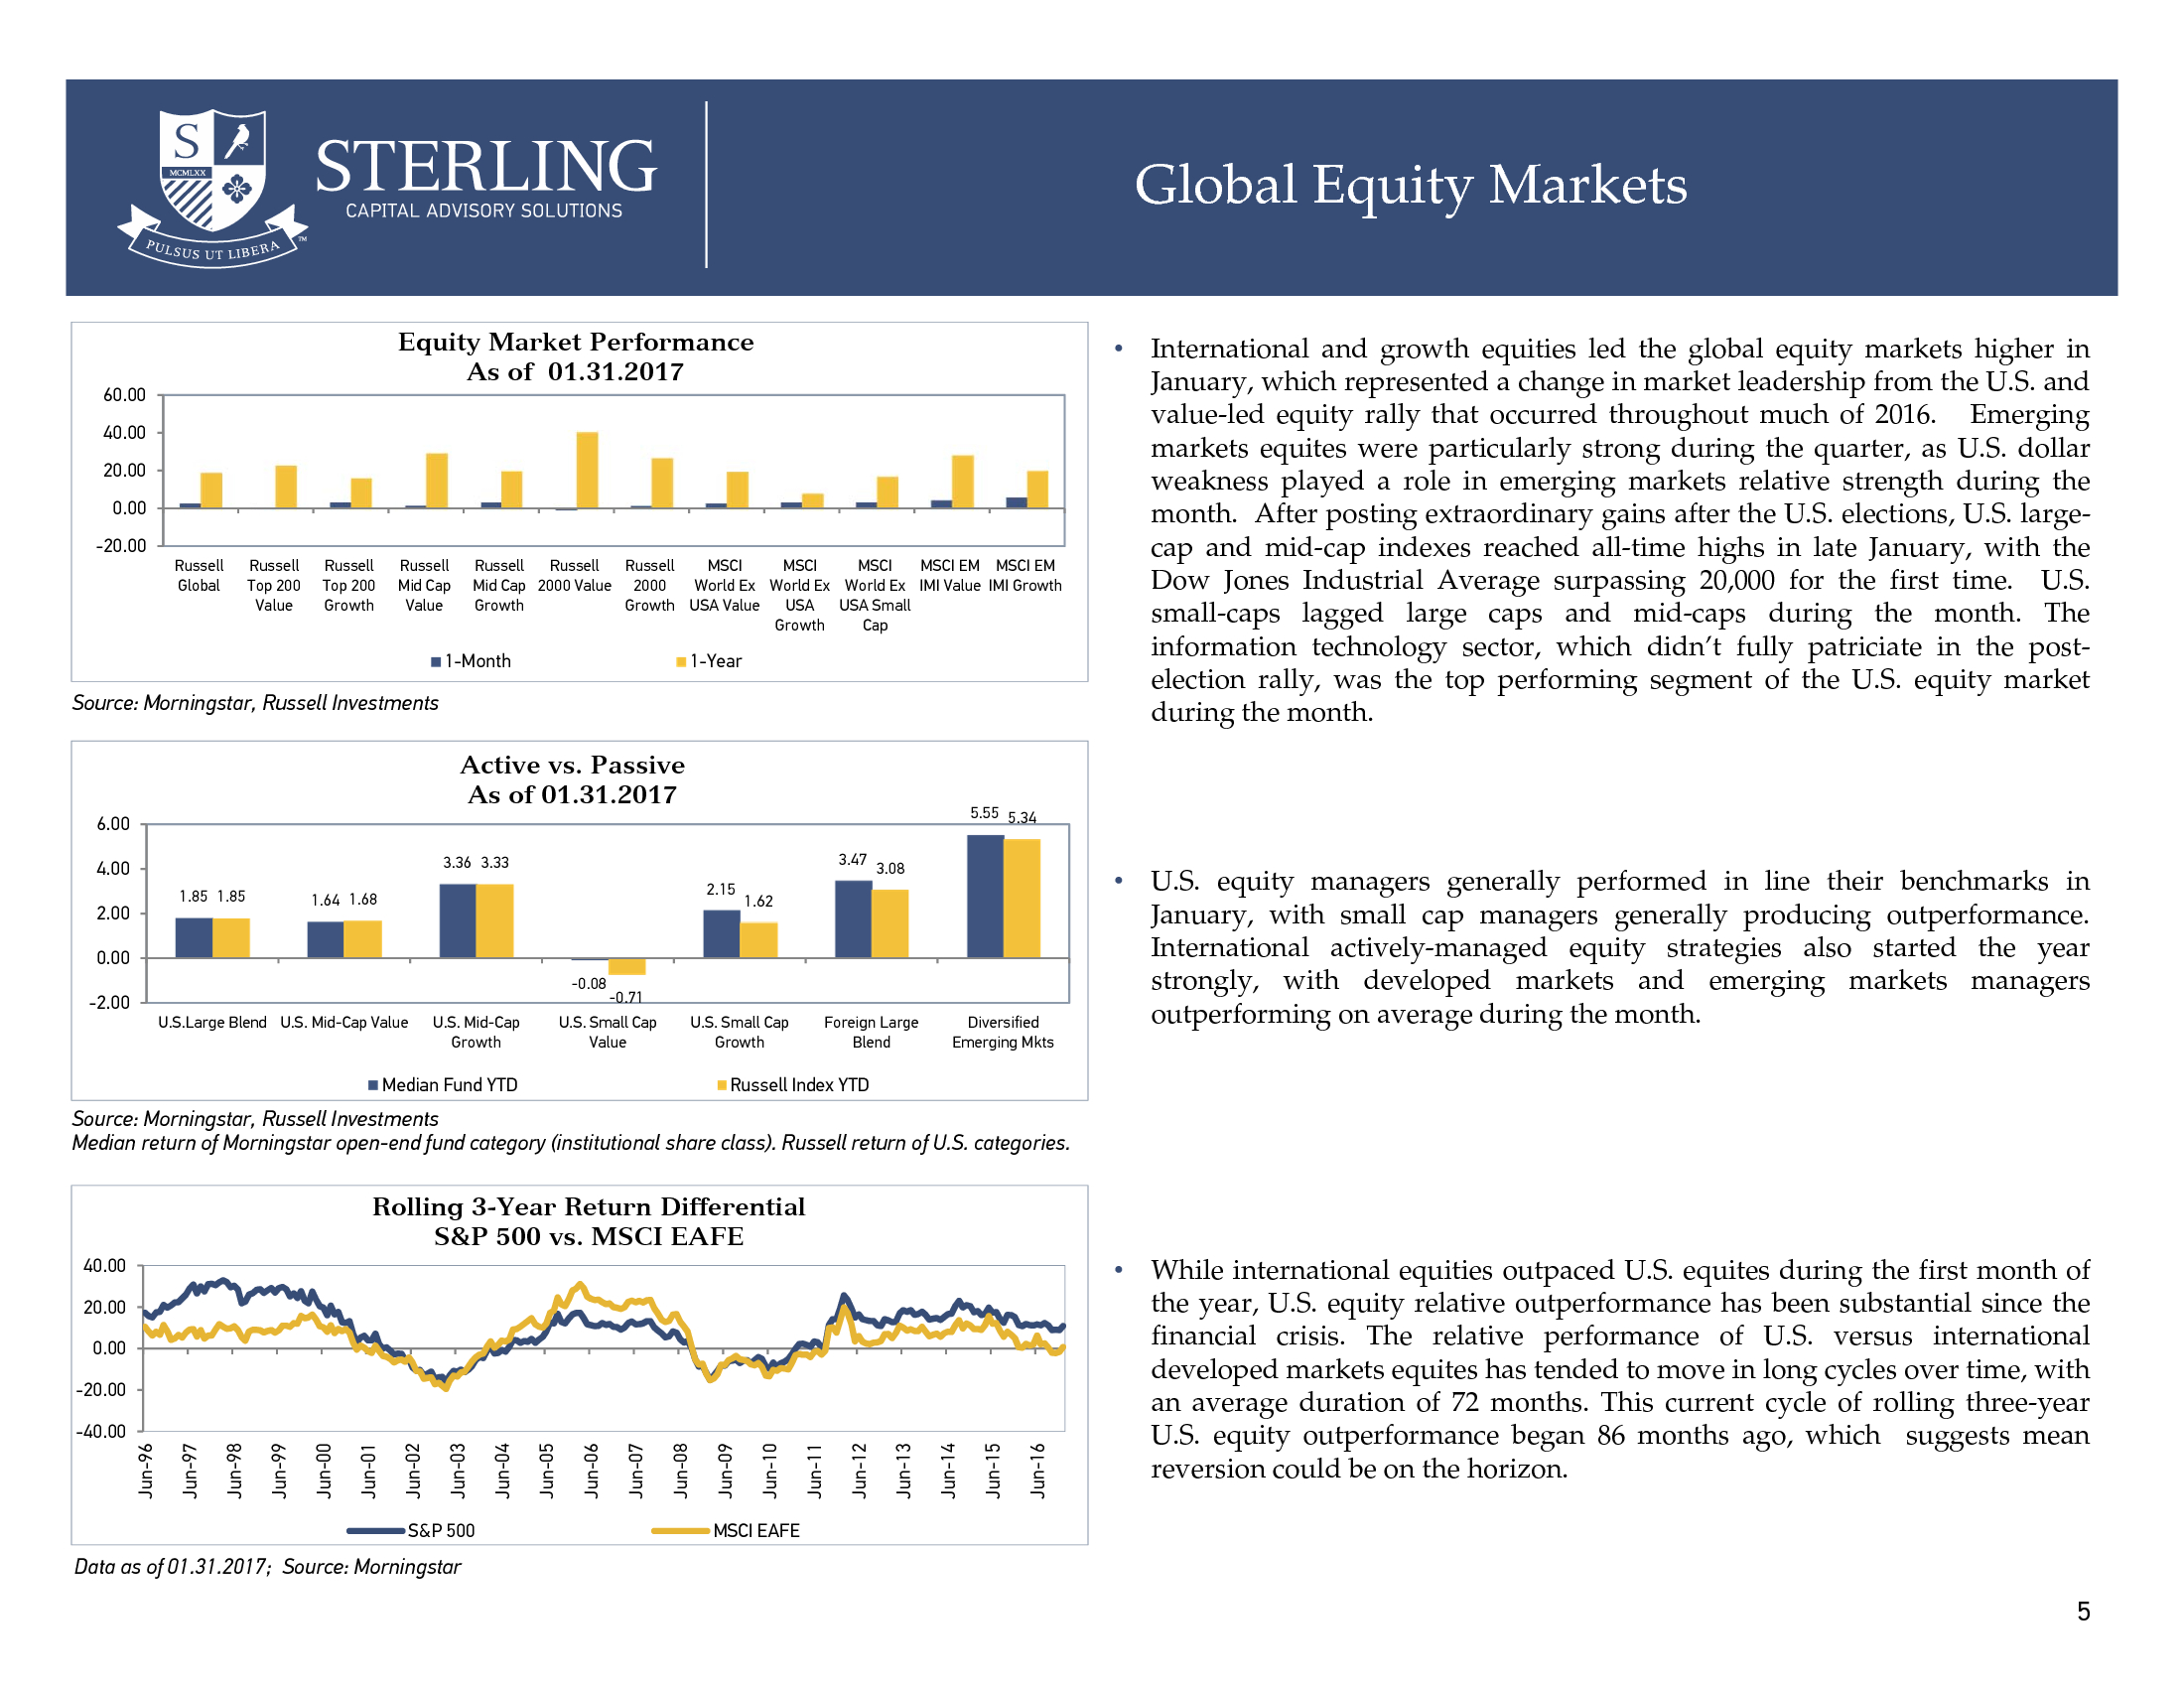
The dollar depreciated 2.4% versus the euro in January. Data as of 02.06.2017; Source: FactSet 4 . Global Equity Markets Equity Market Performance As of 01.31.2017 60.00 40.00 20.00 0.00 -20.00 Russell Global Russell Top 200 Value Russell Top 200 Growth Russell Mid Cap Value Russell Russell Russell MSCI MSCI MSCI MSCI EM MSCI EM Mid Cap 2000 Value 2000 World Ex World Ex World Ex IMI Value IMI Growth Growth Growth USA Value USA USA Small Growth Cap 1-Month 1-Year Source: Morningstar, Russell Investments Active vs. Passive As of 01.31.2017 5.55 5.34 6.00 3.47 3.36 3.33 4.00 1.85 1.85 2.15 1.64 1.68 2.00 3.08 1.62 0.00 -0.08 -2.00 U.S.Large Blend U.S. Mid-Cap Value U.S. Mid-Cap Growth -0.71 U.S.
Small Cap Value • International and growth equities led the global equity markets higher in January, which represented a change in market leadership from the U.S. and value-led equity rally that occurred throughout much of 2016. Emerging markets equites were particularly strong during the quarter, as U.S.
dollar weakness played a role in emerging markets relative strength during the month. After posting extraordinary gains after the U.S. elections, U.S.
largecap and mid-cap indexes reached all-time highs in late January, with the Dow Jones Industrial Average surpassing 20,000 for the first time. U.S. small-caps lagged large caps and mid-caps during the month. The information technology sector, which didn’t fully patriciate in the postelection rally, was the top performing segment of the U.S.
equity market during the month. U.S. Small Cap Growth Median Fund YTD Foreign Large Blend Diversified Emerging Mkts • U.S. equity managers generally performed in line their benchmarks in January, with small cap managers generally producing outperformance. International actively-managed equity strategies also started the year strongly, with developed markets and emerging markets managers outperforming on average during the month. Russell Index YTD Source: Morningstar, Russell Investments Median return of Morningstar open-end fund category (institutional share class).
Russell return of U.S. categories. Rolling 3-Year Return Differential S&P 500 vs. MSCI EAFE 40.00 20.00 0.00 -20.00 S&P 500 Jun-16 Jun-15 Jun-14 Jun-13 Jun-12 Jun-11 Jun-10 Jun-09 Jun-08 Jun-07 Jun-06 Jun-05 Jun-04 Jun-03 Jun-02 Jun-01 Jun-00 Jun-99 Jun-98 Jun-97 Jun-96 -40.00 • While international equities outpaced U.S.
equites during the first month of the year, U.S. equity relative outperformance has been substantial since the financial crisis. The relative performance of U.S.
versus international developed markets equites has tended to move in long cycles over time, with an average duration of 72 months. This current cycle of rolling three-year U.S. equity outperformance began 86 months ago, which suggests mean reversion could be on the horizon. MSCI EAFE Data as of 01.31.2017; Source: Morningstar 5 .
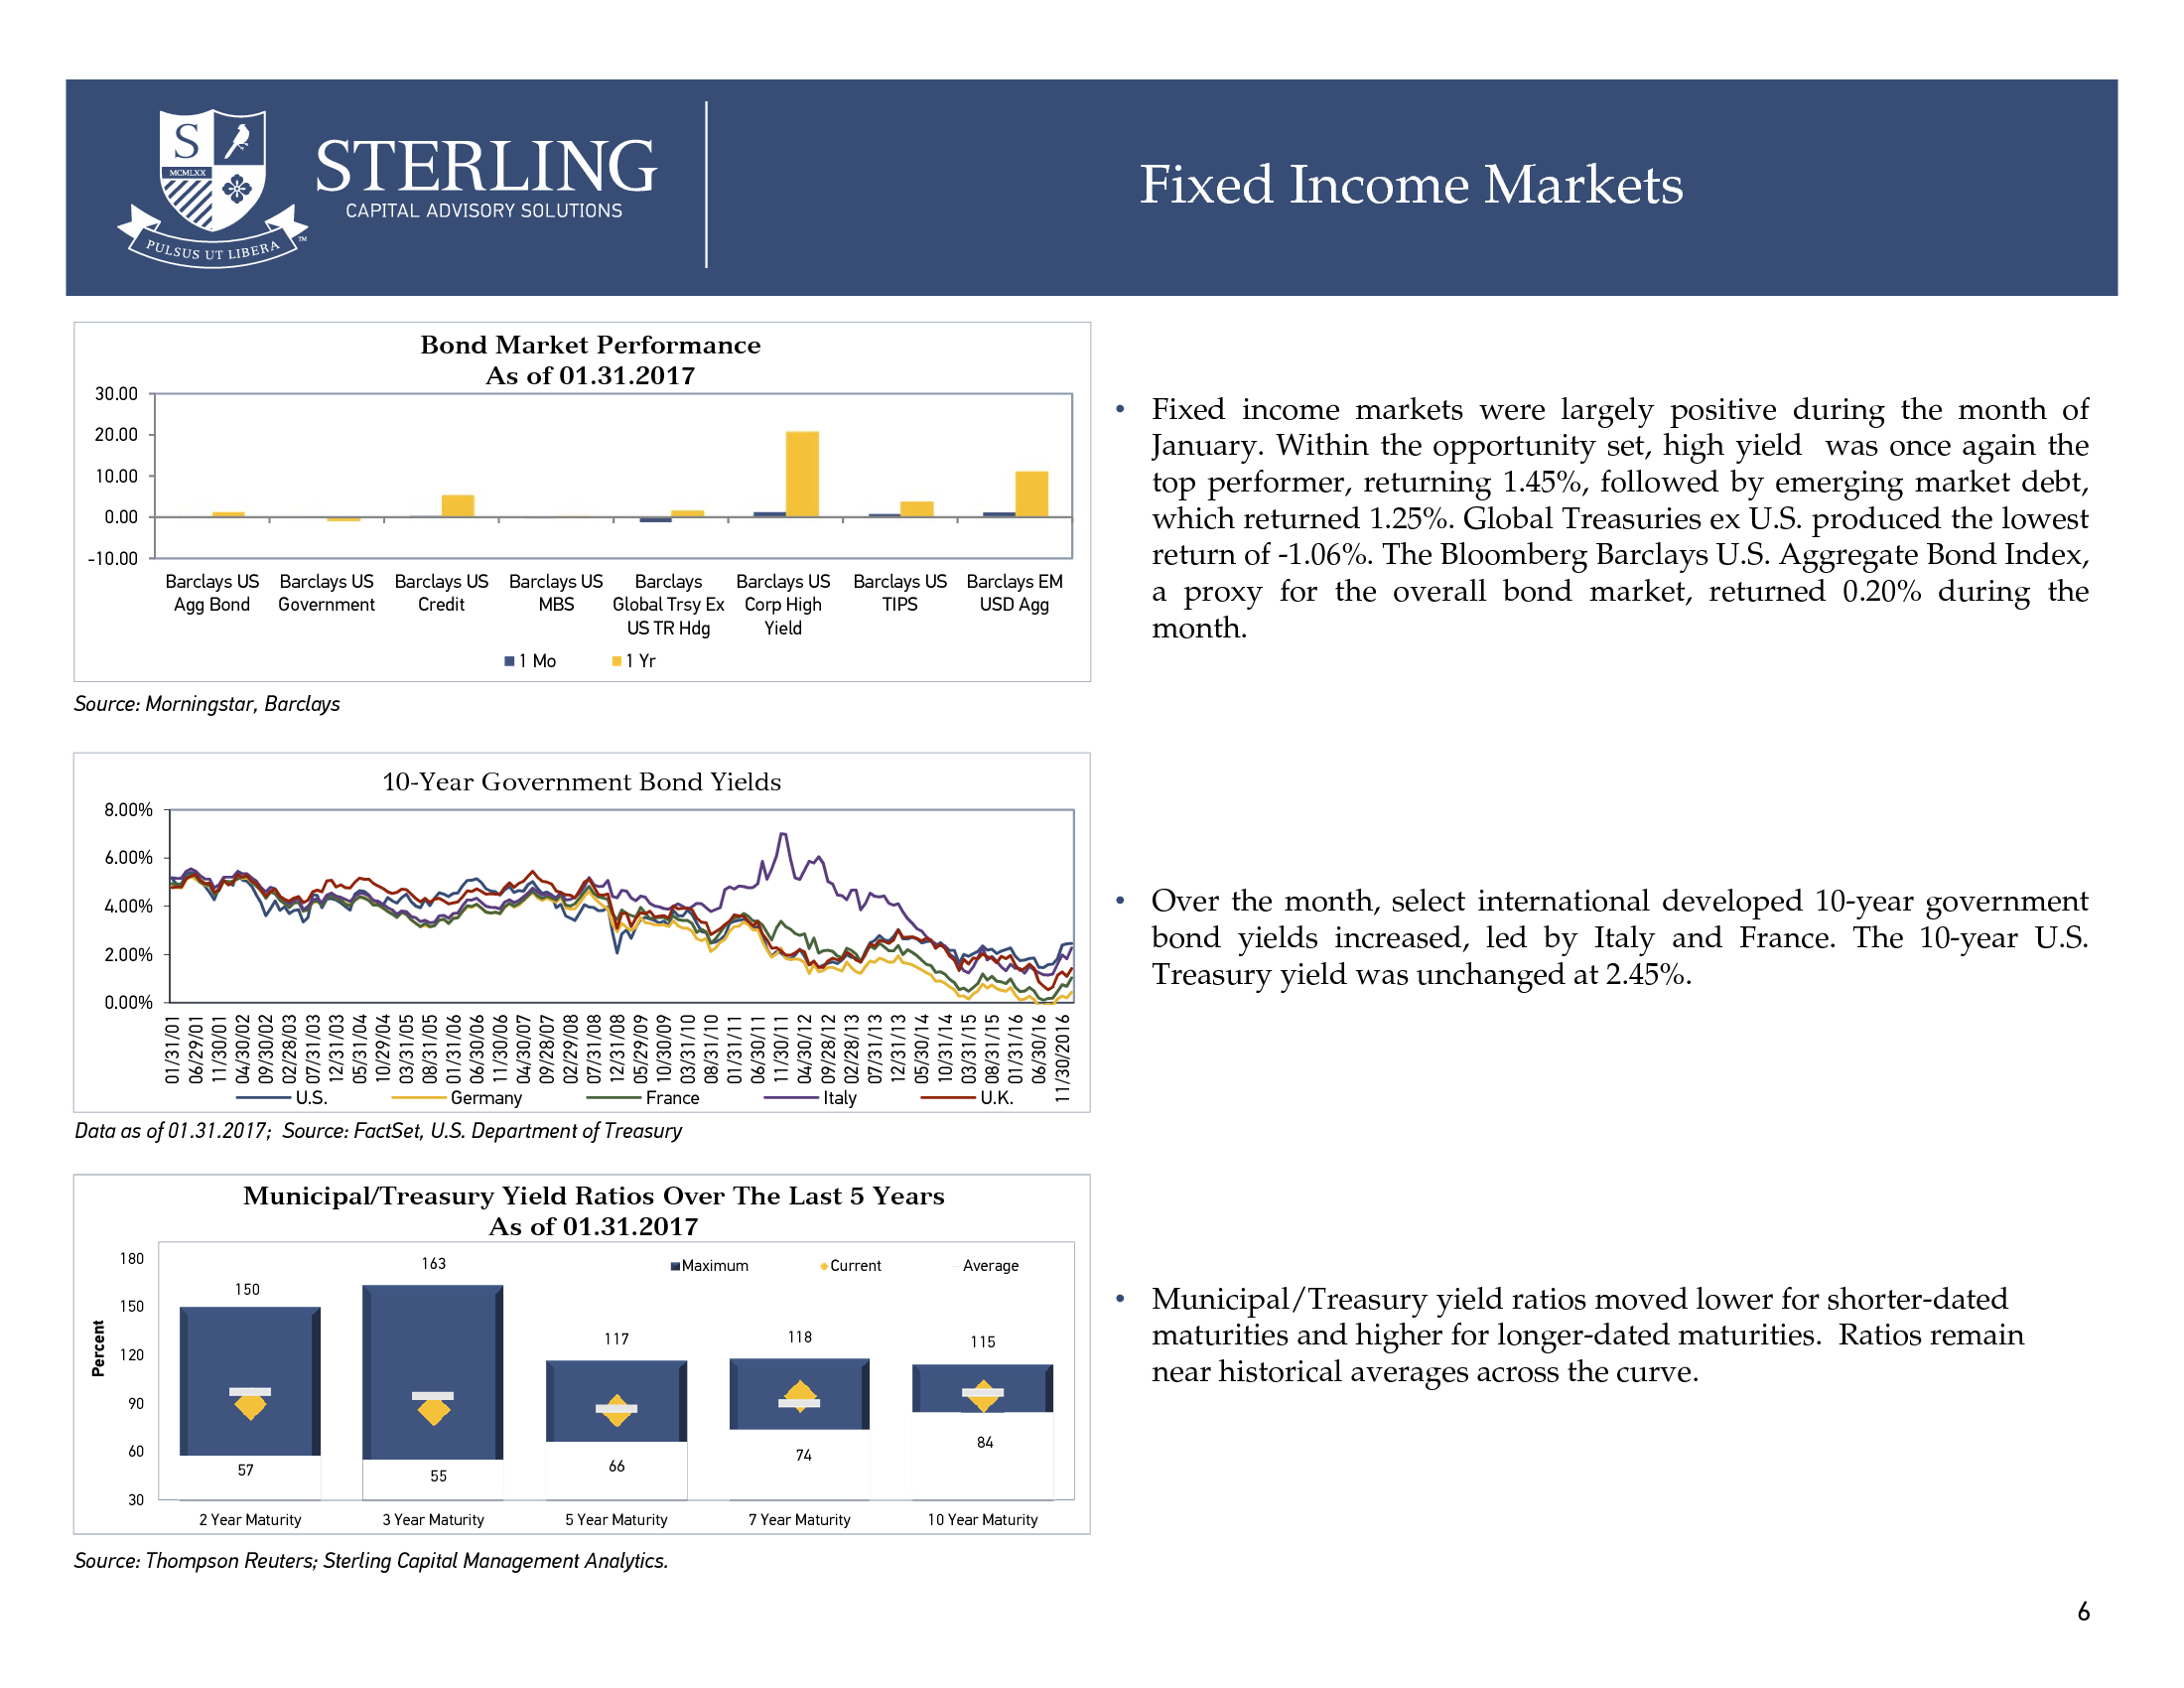
Fixed Income Markets Bond Market Performance As of 01.31.2017 30.00 20.00 10.00 0.00 -10.00 Barclays US Barclays US Barclays US Agg Bond Government Credit Barclays US Barclays Barclays US MBS Global Trsy Ex Corp High US TR Hdg Yield 1 Mo Barclays US Barclays EM TIPS USD Agg • Fixed income markets were largely positive during the month of January. Within the opportunity set, high yield was once again the top performer, returning 1.45%, followed by emerging market debt, which returned 1.25%. Global Treasuries ex U.S. produced the lowest return of -1.06%.
The Bloomberg Barclays U.S. Aggregate Bond Index, a proxy for the overall bond market, returned 0.20% during the month. 1 Yr Source: Morningstar, Barclays 10-Year Government Bond Yields 8.00% 6.00% • Over the month, select international developed 10-year government bond yields increased, led by Italy and France. The 10-year U.S. Treasury yield was unchanged at 2.45%. 4.00% 2.00% 01/31/01 06/29/01 11/30/01 04/30/02 09/30/02 02/28/03 07/31/03 12/31/03 05/31/04 10/29/04 03/31/05 08/31/05 01/31/06 06/30/06 11/30/06 04/30/07 09/28/07 02/29/08 07/31/08 12/31/08 05/29/09 10/30/09 03/31/10 08/31/10 01/31/11 06/30/11 11/30/11 04/30/12 09/28/12 02/28/13 07/31/13 12/31/13 05/30/14 10/31/14 03/31/15 08/31/15 01/31/16 06/30/16 11/30/2016 0.00% U.S. Germany France Italy U.K. Data as of 01.31.2017; Source: FactSet, U.S.
Department of Treasury Municipal/Treasury Yield Ratios Over The Last 5 Years As of 01.31.2017 180 163 Maximum Current Average 150 Percent 150 117 120 118 115 • Municipal/Treasury yield ratios moved lower for shorter-dated maturities and higher for longer-dated maturities. Ratios remain near historical averages across the curve. 90 60 57 55 66 74 84 30 2 Year Maturity 3 Year Maturity 5 Year Maturity 7 Year Maturity 10 Year Maturity Source: Thompson Reuters; Sterling Capital Management Analytics. 6 . Fixed Income Spreads and TIPS Breakeven 10-Year TIPS Breakeven 3.50 2000 U.S. Corporate Investment Grade (LHS) 1.00 0.50 Breakeven Aug-15 May-16 Feb-14 Nov-14 Aug-12 May-13 Feb-11 Nov-11 Aug-09 May-10 Feb-08 Nov-08 May-07 Aug-06 Feb-05 Nov-05 May-04 Aug-03 Feb-02 U.S. Corporate High Yield (RHS) Average Data as of 01.31.2017; Source: Federal Reserve Board of Governors Data as of 01.31.2017; Source: FactSet EM Debt OAS Yield Spread of Barclays U.S. Treasury Index to Global ExU.S.
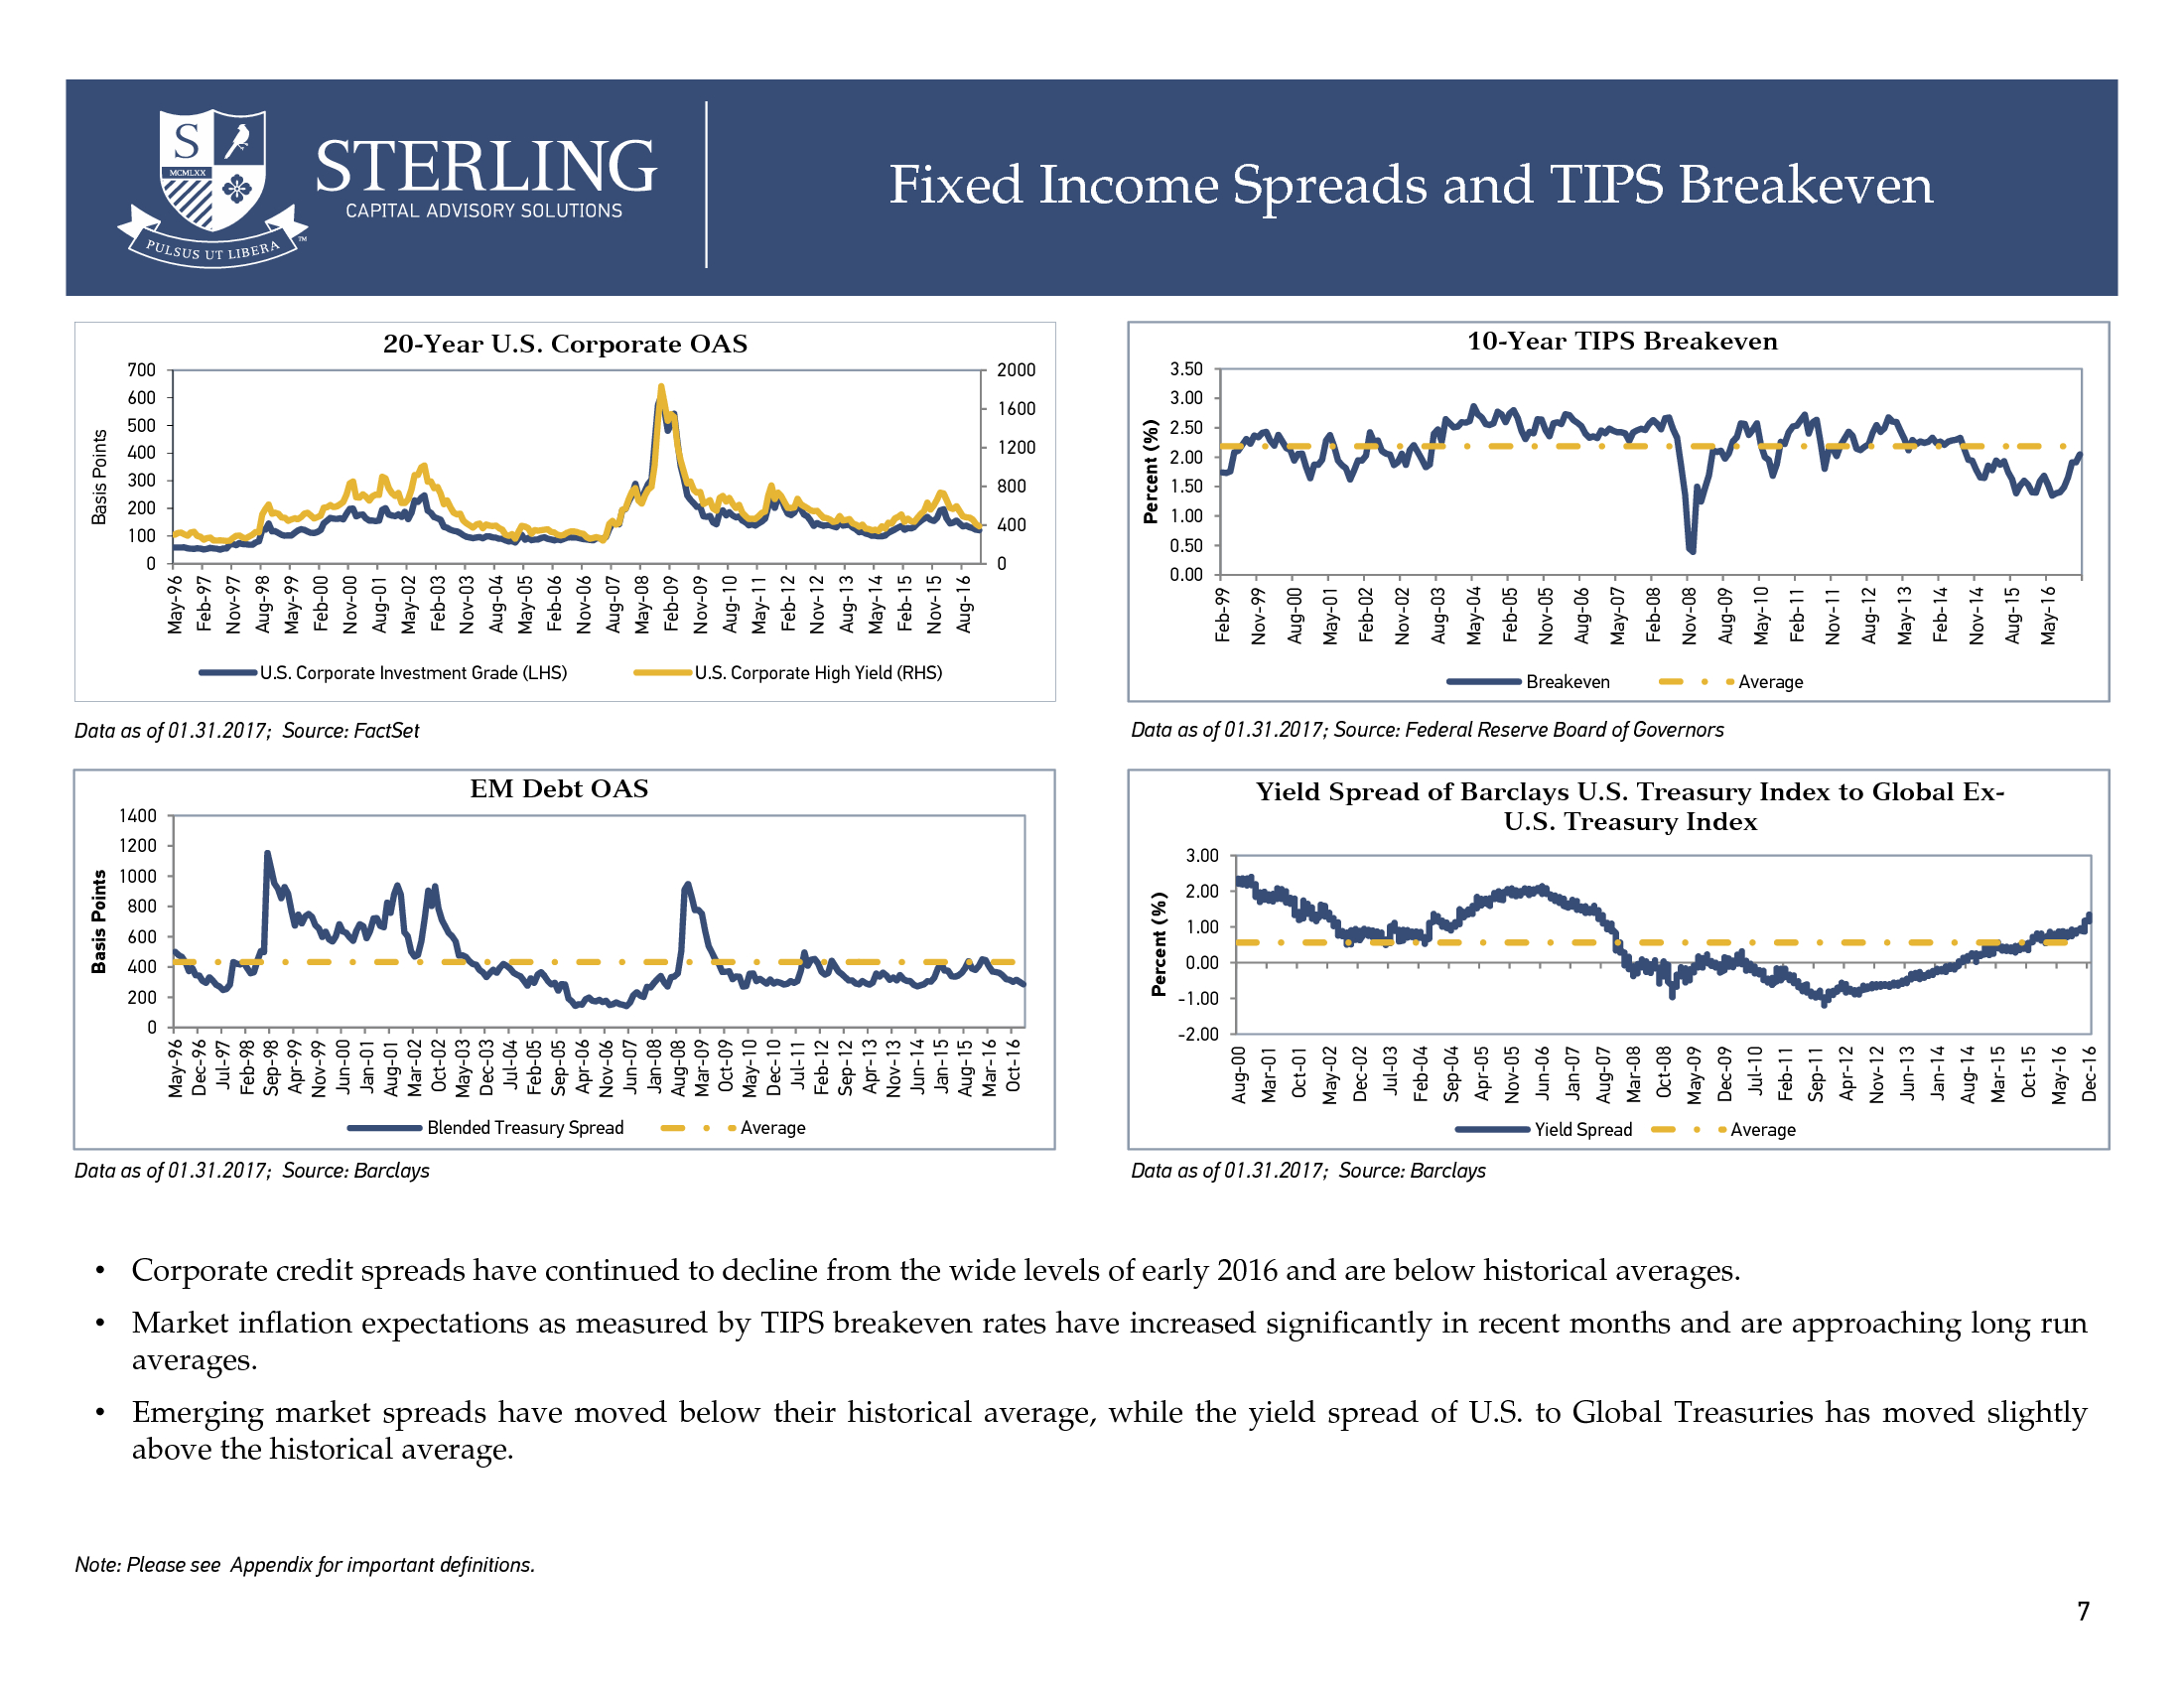
Treasury Index 1400 1200 3.00 1000 Percent (%) Blended Treasury Spread Data as of 01.31.2017; Source: Barclays -1.00 Yield Spread Dec-16 May-16 Oct-15 Mar-15 Jan-14 Aug-14 Jun-13 Apr-12 Nov-12 Feb-11 Sep-11 Jul-10 Dec-09 May-09 Oct-08 Mar-08 Jan-07 Aug-07 Jun-06 Apr-05 Average Nov-05 Feb-04 Sep-04 -2.00 Jul-03 May-96 Dec-96 Jul-97 Feb-98 Sep-98 Apr-99 Nov-99 Jun-00 Jan-01 Aug-01 Mar-02 Oct-02 May-03 Dec-03 Jul-04 Feb-05 Sep-05 Apr-06 Nov-06 Jun-07 Jan-08 Aug-08 Mar-09 Oct-09 May-10 Dec-10 Jul-11 Feb-12 Sep-12 Apr-13 Nov-13 Jun-14 Jan-15 Aug-15 Mar-16 Oct-16 0 0.00 Dec-02 200 May-02 400 1.00 Oct-01 600 2.00 Mar-01 800 Aug-00 Basis Points Nov-02 0.00 May-01 Aug-16 Feb-15 Nov-15 Aug-13 May-14 Feb-12 Nov-12 Aug-10 May-11 Feb-09 Nov-09 Aug-07 May-08 Feb-06 Nov-06 Aug-04 May-05 Feb-03 Nov-03 Aug-01 May-02 Feb-00 Nov-00 Aug-98 May-99 Feb-97 Nov-97 0 1.50 Aug-00 400 2.00 Feb-99 800 2.50 Nov-99 1200 3.00 Percent (%) 1600 May-96 Basis Points 20-Year U.S. Corporate OAS 700 600 500 400 300 200 100 0 Average Data as of 01.31.2017; Source: Barclays • Corporate credit spreads have continued to decline from the wide levels of early 2016 and are below historical averages. • Market inflation expectations as measured by TIPS breakeven rates have increased significantly in recent months and are approaching long run averages. • Emerging market spreads have moved below their historical average, while the yield spread of U.S. to Global Treasuries has moved slightly above the historical average. Note: Please see Appendix for important definitions. 7 .
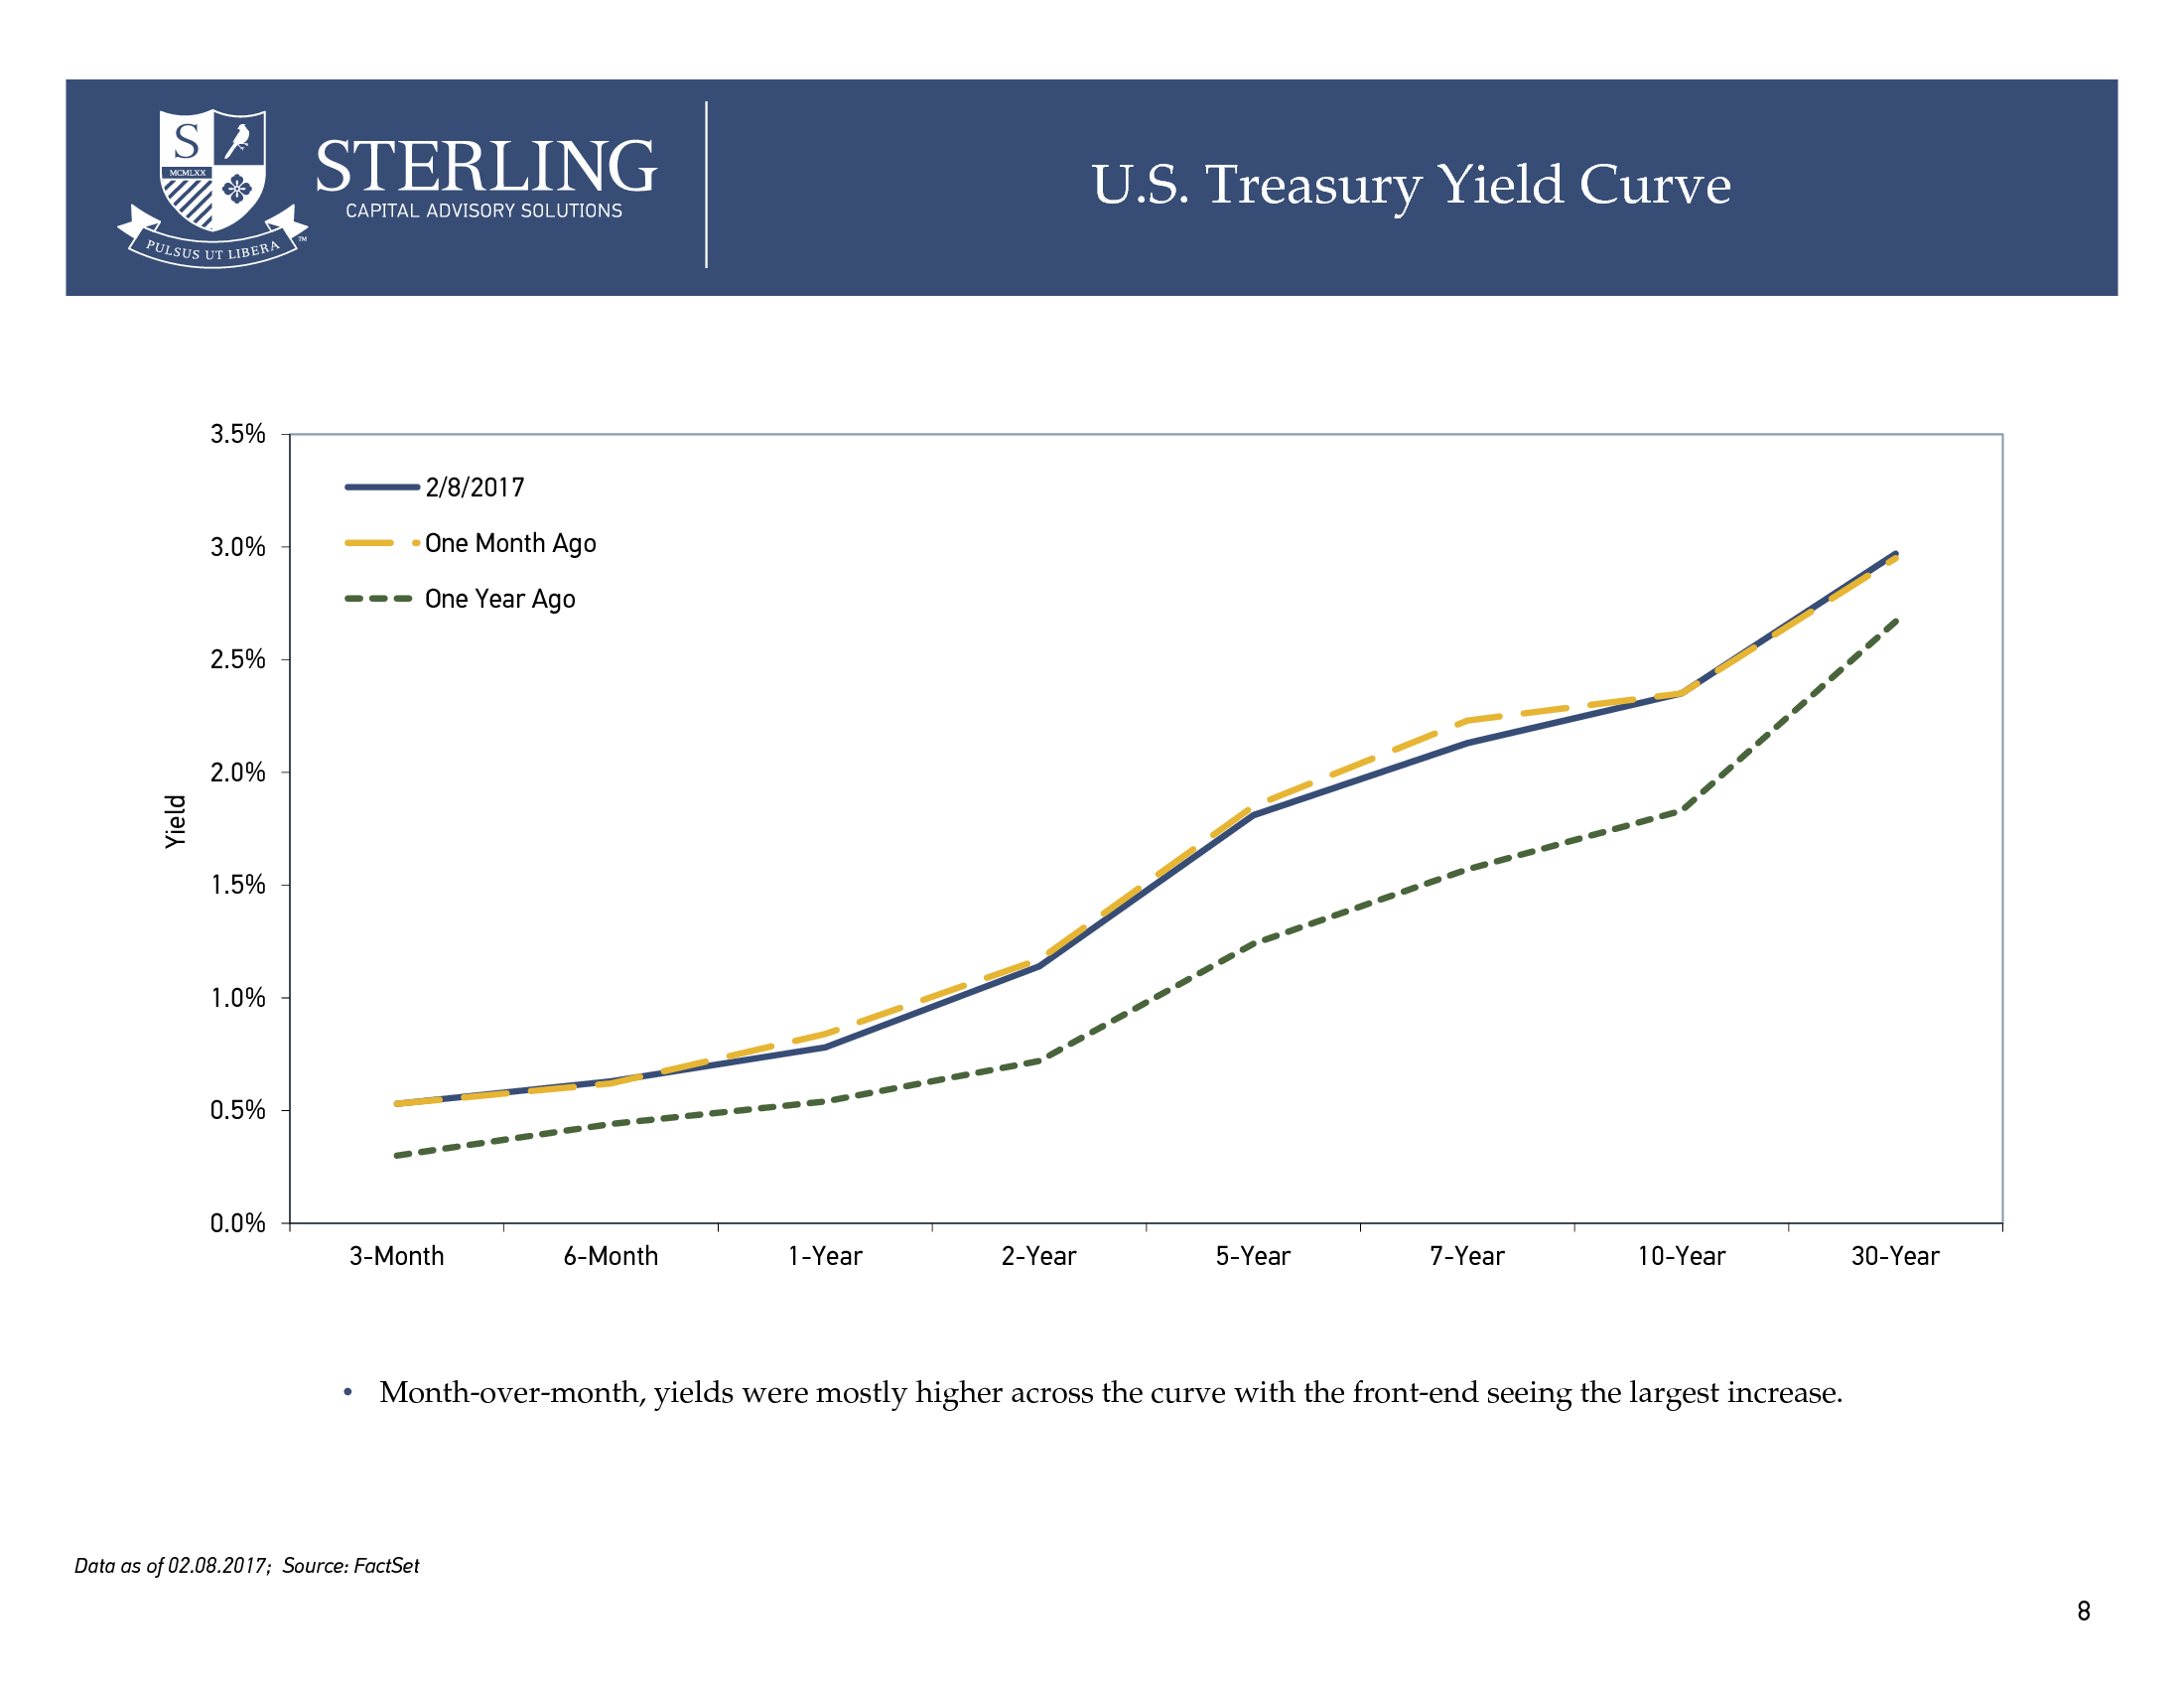
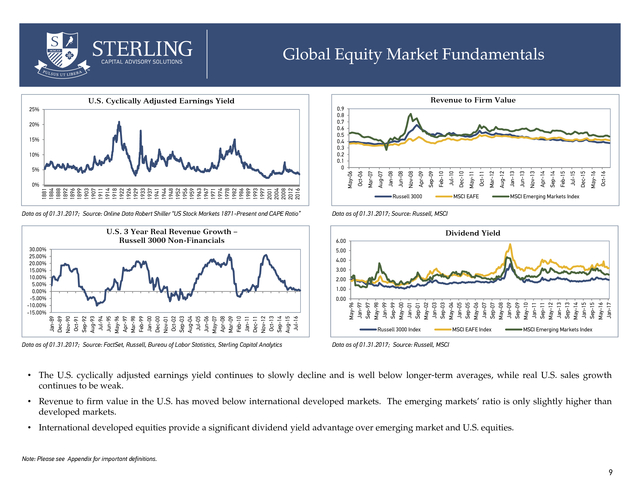
U.S. Treasury Yield Curve 3.5% 2/8/2017 One Month Ago 3.0% One Year Ago 2.5% Yield 2.0% 1.5% 1.0% 0.5% 0.0% 3-Month 6-Month 1-Year 2-Year 5-Year 7-Year 10-Year 30-Year • Month-over-month, yields were mostly higher across the curve with the front-end seeing the largest increase. Data as of 02.08.2017; Source: FactSet 8 . Global Equity Market Fundamentals Revenue to Firm Value U.S. Cyclically Adjusted Earnings Yield 1881 1884 1888 1892 1896 1899 1903 1907 1911 1914 1918 1922 1926 1929 1933 1937 1941 1944 1948 1952 1956 1959 1963 1967 1971 1974 1978 1982 1986 1989 1993 1997 2001 2004 2008 2012 2016 Data as of 01.31.2017; Source: Online Data Robert Shiller “US Stock Markets 1871-Present and CAPE Ratio” U.S. 3 Year Real Revenue Growth – Russell 3000 Non-Financials 30.00% 25.00% 20.00% 15.00% 10.00% 5.00% 0.00% -5.00% -10.00% -15.00% MSCI EAFE Oct-16 May-16 Jul-15 Dec-15 Feb-15 Apr-14 Sep-14 Nov-13 Jan-13 Jun-13 Aug-12 Oct-11 Mar-12 May-11 Jul-10 Russell 3000 Dec-10 Feb-10 Apr-09 Sep-09 Nov-08 0% Jan-08 May-06 5% Jun-08 10% Aug-07 15% Oct-06 20% Mar-07 0.9 0.8 0.7 0.6 0.5 0.4 0.3 0.2 0.1 0 25% MSCI Emerging Markets Index Data as of 01.31.2017; Source: Russell, MSCI Dividend Yield 6.00 5.00 4.00 3.00 2.00 1.00 Data as of 01.31.2017; Source: FactSet, Russell, Bureau of Labor Statistics, Sterling Capital Analytics May-96 Jan-97 Sep-97 May-98 Jan-99 Sep-99 May-00 Jan-01 Sep-01 May-02 Jan-03 Sep-03 May-04 Jan-05 Sep-05 May-06 Jan-07 Sep-07 May-08 Jan-09 Sep-09 May-10 Jan-11 Sep-11 May-12 Jan-13 Sep-13 May-14 Jan-15 Sep-15 May-16 Jan-17 Jan-89 Dec-89 Nov-90 Oct-91 Sep-92 Aug-93 Jul-94 Jun-95 May-96 Apr-97 Mar-98 Feb-99 Jan-00 Dec-00 Nov-01 Oct-02 Sep-03 Aug-04 Jul-05 Jun-06 May-07 Apr-08 Mar-09 Feb-10 Jan-11 Dec-11 Nov-12 Oct-13 Sep-14 Aug-15 Jul-16 0.00 Russell 3000 Index MSCI EAFE Index MSCI Emerging Markets Index Data as of 01.31.2017; Source: Russell, MSCI • The U.S. cyclically adjusted earnings yield continues to slowly decline and is well below longer-term averages, while real U.S.
sales growth continues to be weak. • Revenue to firm value in the U.S. has moved below international developed markets. The emerging markets’ ratio is only slightly higher than developed markets. • International developed equities provide a significant dividend yield advantage over emerging market and U.S.
equities. Note: Please see Appendix for important definitions. 9 . Appendix . Definitions Core Consumer Price Index: Core inflation is a measure of inflation that excludes certain items, usually food and energy, that face volatile price movements. Option Adjusted Spread (OAS): A bond’s yield spread over comparable maturity government bonds, adjusted for any embedded options. Real GDP: Real gross domestic product (GDP) is an inflation-adjusted measure that reflects the value of all goods and services produced by an economy in a given year, expressed in base-year prices. Revenue to Firm Value: Total Index Revenues of the past 12 months divided by the sum of equity market value and the value of total debt. This is a measure of total sales generated on the total value (debt plus equity) of firms in the index. TIPS Breakeven: The inflation rate implied by the spread in yield between U.S. TIPS (Treasury Inflation Protected Securities) and nominal U.S. Government Bonds of equal maturity. U.S.
3 yr. Real Revenue Growth, Russell 3000 Non-Financials: For the Russell 3000 excluding financial firms, the percentage change in trailing 12-month inflation adjusted revenue over 12-month inflation adjusted revenue three years prior. U.S. Cyclically Adjusted Earnings Yield: The 10-year average of annual, inflation adjusted earnings divided by the current inflation adjusted price of the S&P 500 index.
This measure is the inverse of the Shiller CAPE Ratio. YOY US Productivity Growth: The year-over-year growth in real U.S. output produced per hour worked for non-farm workers. 10 . Disclosures The opinions expressed herein are those of Sterling Capital Management and the Sterling Advisory Solutions Team, and not those of BB&T Corporation or its executives. The stated opinions are for general information only and are not meant to be predictions or an offer of individual or personalized investment advice. They are not intended as an offer or solicitation with respect to the purchase or sale of any security. This information and these opinions are subject to change without notice.
Any type of investing involves risk and there are no guarantees. Sterling Capital Management LLC does not assume liability for any loss which may result from the reliance by any person upon such information or opinions. Investment advisory services are available through Sterling Capital Management LLC, a separate subsidiary of BB&T Corporation. Sterling Capital Management LLC manages customized investment portfolios, provides asset allocation analysis and offers other investment-related services to affluent individuals and businesses.
Securities and other investments held in investment management or investment advisory accounts at Sterling Capital Management LLC are not deposits or other obligations of BB&T Corporation, Branch Banking and Trust Company or any affiliate, are not guaranteed by Branch Banking and Trust Company or any other bank, are not insured by the FDIC or any other federal government agency, and are subject to investment risk, including possible loss of principal invested. The securities/instruments discussed in this material may not be suitable for all investors. The appropriateness of a particular investment or strategy will depend on an investor’s individual circumstances and objectives. Asset allocation and diversification do not assure a profit or protect against loss in declining financial markets. The indexes are unmanaged and are shown for illustrative purposes only. Indexes do not represent the performance of any specific investment.
An investor cannot invest directly in an index. The indexes selected by Sterling Capital Management to measure performance are representative of broad asset classes. Sterling Capital Management retains the right to change representative indexes at any time. 11 .
Emerging markets equites were particularly strong during the quarter. U.S. large-cap and mid-cap indexes reached all-time highs in late January.
After posting extraordinary gains after the U.S. elections, U.S. small-caps lagged large caps and mid-caps during the month. U.S.
equity managers generally performed in line their benchmarks in January, with small cap managers generally producing outperformance. International actively-managed equity strategies also started the year strongly, with developed markets and emerging markets managers outperforming on average during the month. • Fixed income markets were largely positive during the month of January. Within the opportunity set, high yield was once again the top performer, returning 1.45%, followed by emerging market debt, which returned 1.25%.
Global Treasuries ex U.S. produced the lowest return of -1.06%. The Bloomberg Barclays U.S. Aggregate Bond Index, a proxy for the overall bond market, returned 0.20% during the month. • Over the month, select international developed 10-year government bond yields increased, led by Italy and France.
The 10-year U.S. Treasury yield was unchanged at 2.45%. • Municipal/Treasury yield ratios moved lower for shorter-dated maturities and higher for longer-dated maturities. Ratios remain near historical averages across the curve. While international equities outpaced U.S.
equites during the first month of the year, U.S. equity relative outperformance has been substantial since the financial crisis. The relative performance of U.S.
versus international developed markets equites has tended to move in long cycles over time, with an average duration of 72 months. This current cycle of rolling three-year U.S. equity outperformance began 86 months ago, which suggests mean reversion could be on the horizon. Stock Indexes YTD Bond Indexes YTD Other Indexes YTD U.S.
Treasury Yields Rates/Commodities Russell Global 2.69% Barclays US Aggregate 0.20% 60% LgShort-40% MktNeutral 1.38% 6-month 0.64% Prime Rate 3.75% Russell 3000 1.88% Barclays Gbl Treas xUS Hdg -1.06% DJ Equity All REIT 0.14% 1-year 0.84% LIBOR (3 Mo) 1.03% S&P 500 1.90% Barclays US TIPS 0.84% Bloomberg Commodity 0.14% 3-year 1.46% Oil Price ($/barrel) $52.81 MSCI EAFE 2.90% Barclays US High Yield 1.45% 5-year 1.90% Gold ($/t oz) MSCI EM 5.47% Barclays EM Aggregate 1.25% 10-year 2.45% 30-year 3.05% Data as of 01.31.2017; Source: Morningstar, FactSet, Russell Investments, Barclays, U.S. Department of Treasury $1,211.40 . YOY Real GDP Growth ($U.S.) 20.00 15.00 10.00 5.00 0.00 -5.00 -10.00 -15.00 -20.00 U.S. Eurozone U.S. Industrial Production (LHS) Japan Japan data as of 09.30.2016. U.S. and Eurozone data as of 12.31.2016.
Source: FactSet 7.00 5.00 3.00 1.00 -1.00 -3.00 -5.00 -7.00 U.S. Labor Productivity (RHS) Industrial Production as of 12.31.2016; U.S. Labor Productivity as of 12.31.2016; Source: FactSet Core Consumer Price Index (YoY Growth) U.S.
- Unemployment Rate 4.00 12.00 3.00 10.00 2.00 Percent (%) 1.00 0.00 -1.00 8.00 6.00 4.00 2.00 Feb-97 Sep-97 Apr-98 Nov-98 Jun-99 Jan-00 Aug-00 Mar-01 Oct-01 May-02 Dec-02 Jul-03 Feb-04 Sep-04 Apr-05 Nov-05 Jun-06 Jan-07 Aug-07 Mar-08 Oct-08 May-09 Dec-09 Jul-10 Feb-11 Sep-11 Apr-12 Nov-12 Jun-13 Jan-14 Aug-14 Mar-15 Oct-15 May-16 Dec-16 -2.00 U.S. Eurozone Japan U.S. data as of 12.31.2016; Eurozone data as of 01.31.2017. Japan data as of 12.31.2016; Source: FactSet The sudden increase in Japan CPI growth in 2014 coincided with an increase in national sales tax that impacted final price levels. 0.00 Feb-97 Oct-97 Jun-98 Feb-99 Oct-99 Jun-00 Feb-01 Oct-01 Jun-02 Feb-03 Oct-03 Jun-04 Feb-05 Oct-05 Jun-06 Feb-07 Oct-07 Jun-08 Feb-09 Oct-09 Jun-10 Feb-11 Oct-11 Jun-12 Feb-13 Oct-13 Jun-14 Feb-15 Oct-15 Jun-16 Percent (%) YoY U.S.
Industrial Production and Productivity Feb-97 Oct-97 Jun-98 Feb-99 Oct-99 Jun-00 Feb-01 Oct-01 Jun-02 Feb-03 Oct-03 Jun-04 Feb-05 Oct-05 Jun-06 Feb-07 Oct-07 Jun-08 Feb-09 Oct-09 Jun-10 Feb-11 Oct-11 Jun-12 Feb-13 Oct-13 Jun-14 Feb-15 Oct-15 Jun-16 Percent (%) 8.00 6.00 4.00 2.00 0.00 -2.00 -4.00 -6.00 -8.00 -10.00 Mar-97 Aug-97 Jan-98 Jun-98 Nov-98 Apr-99 Sep-99 Feb-00 Jul-00 Dec-00 May-01 Oct-01 Mar-02 Aug-02 Jan-03 Jun-03 Nov-03 Apr-04 Sep-04 Feb-05 Jul-05 Dec-05 May-06 Oct-06 Mar-07 Aug-07 Jan-08 Jun-08 Nov-08 Apr-09 Sep-09 Feb-10 Jul-10 Dec-10 May-11 Oct-11 Mar-12 Aug-12 Jan-13 Jun-13 Nov-13 Apr-14 Sep-14 Feb-15 Jul-15 Dec-15 May-16 Oct-16 Percent (%) Global Economic Snapshot Data as of 01.31.2017; Source: FactSet • U.S. GDP growth held steady in the fourth quarter of 2016 but remains tepid. The Eurozone has closed the growth gap to the U.S.
and Japan growth has gradually improved. • U.S. productivity showed further improvement in the fourth quarter but generally remains low. Continued productivity gains are essential to drive long-term real growth. • Core inflation has slowly increased toward Fed target levels and Eurozone inflation is showing signs of picking up.
Deflation remains a threat in Japan. • Tightening U.S. labor markets suggest more inflation pressure that is likely to lead to further Fed rate hikes. Note: Please see Appendix for important definitions. 2 . Leading U.S. Economic Indicators Initial Jobless Claims Manufacturing • In the week ending February 4, the four-week moving average of Initial Jobless Claims was 244,250 – a decrease of 3,750 from the Initial Jobless Claims previous week’s revised average. • ISM Manufacturing registered 56.0% in January, an increase of 1.5 percentage points from the prior month. A reading below 50.0% indicates contraction. • ISM Manufacturing New Orders registered 60.4% in January, 0.1 percentage points above the December reading. • ISM Non-Manufacturing registered 56.5% in January, 0.1 percentage points lower than the December reading. Coincident Housing/Construction • Building permits increased 1.3% in December and have increased 2.2% over the past year. Consumer Confidence • The Consumer Confidence Index decreased in January to 111.8 compared to 113.3 in December. Nonfarm Payrolls Industrial Production Personal Income • Total nonfarm payroll employment increased by 227,000 in January. The unemployment rate was little changed at 4.8%. • Industrial Production rose 0.8 % in December and is up 0.5% over the past year. • Real Disposable Personal Income increased 0.1% in December, and is up 2.1% over the past year. Lagging Ratio of Consumer Installment Credit to Personal Income • This ratio rose 0.09% in December, and is up 2.9% year-over-year.
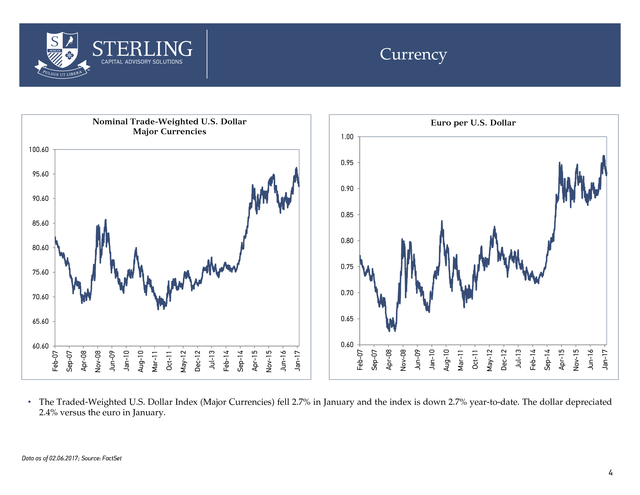
Consumer borrowing tends to lag improvements in personal income by many months because people remain hesitant to take on new debt until they are sure that their improved income level is sustainable. Inflation • CPI (All Items) rose 0.3% in December and is up 2.1% over the trailing one year period. CPI (Core) increased 0.2% in December, and is up 2.2% over the trailing one-year period. Source: FactSet 3 . Currency Nominal Trade-Weighted U.S. Dollar Major Currencies Euro per U.S. Dollar 1.00 100.60 0.95 95.60 0.90 90.60 0.85 85.60 0.80 80.60 0.75 75.60 0.70 70.60 Jan-17 Jun-16 Nov-15 Apr-15 Sep-14 Feb-14 Jul-13 Dec-12 May-12 Oct-11 Mar-11 Aug-10 Jan-10 Jun-09 Nov-08 Apr-08 Sep-07 Feb-07 Jan-17 Jun-16 Nov-15 Apr-15 Sep-14 Feb-14 Jul-13 Dec-12 May-12 Oct-11 Mar-11 Aug-10 Jan-10 Jun-09 Nov-08 0.60 Apr-08 60.60 Sep-07 0.65 Feb-07 65.60 • The Traded-Weighted U.S. Dollar Index (Major Currencies) fell 2.7% in January and the index is down 2.7% year-to-date.
The dollar depreciated 2.4% versus the euro in January. Data as of 02.06.2017; Source: FactSet 4 . Global Equity Markets Equity Market Performance As of 01.31.2017 60.00 40.00 20.00 0.00 -20.00 Russell Global Russell Top 200 Value Russell Top 200 Growth Russell Mid Cap Value Russell Russell Russell MSCI MSCI MSCI MSCI EM MSCI EM Mid Cap 2000 Value 2000 World Ex World Ex World Ex IMI Value IMI Growth Growth Growth USA Value USA USA Small Growth Cap 1-Month 1-Year Source: Morningstar, Russell Investments Active vs. Passive As of 01.31.2017 5.55 5.34 6.00 3.47 3.36 3.33 4.00 1.85 1.85 2.15 1.64 1.68 2.00 3.08 1.62 0.00 -0.08 -2.00 U.S.Large Blend U.S. Mid-Cap Value U.S. Mid-Cap Growth -0.71 U.S.
Small Cap Value • International and growth equities led the global equity markets higher in January, which represented a change in market leadership from the U.S. and value-led equity rally that occurred throughout much of 2016. Emerging markets equites were particularly strong during the quarter, as U.S.
dollar weakness played a role in emerging markets relative strength during the month. After posting extraordinary gains after the U.S. elections, U.S.
largecap and mid-cap indexes reached all-time highs in late January, with the Dow Jones Industrial Average surpassing 20,000 for the first time. U.S. small-caps lagged large caps and mid-caps during the month. The information technology sector, which didn’t fully patriciate in the postelection rally, was the top performing segment of the U.S.
equity market during the month. U.S. Small Cap Growth Median Fund YTD Foreign Large Blend Diversified Emerging Mkts • U.S. equity managers generally performed in line their benchmarks in January, with small cap managers generally producing outperformance. International actively-managed equity strategies also started the year strongly, with developed markets and emerging markets managers outperforming on average during the month. Russell Index YTD Source: Morningstar, Russell Investments Median return of Morningstar open-end fund category (institutional share class).
Russell return of U.S. categories. Rolling 3-Year Return Differential S&P 500 vs. MSCI EAFE 40.00 20.00 0.00 -20.00 S&P 500 Jun-16 Jun-15 Jun-14 Jun-13 Jun-12 Jun-11 Jun-10 Jun-09 Jun-08 Jun-07 Jun-06 Jun-05 Jun-04 Jun-03 Jun-02 Jun-01 Jun-00 Jun-99 Jun-98 Jun-97 Jun-96 -40.00 • While international equities outpaced U.S.
equites during the first month of the year, U.S. equity relative outperformance has been substantial since the financial crisis. The relative performance of U.S.
versus international developed markets equites has tended to move in long cycles over time, with an average duration of 72 months. This current cycle of rolling three-year U.S. equity outperformance began 86 months ago, which suggests mean reversion could be on the horizon. MSCI EAFE Data as of 01.31.2017; Source: Morningstar 5 .
Fixed Income Markets Bond Market Performance As of 01.31.2017 30.00 20.00 10.00 0.00 -10.00 Barclays US Barclays US Barclays US Agg Bond Government Credit Barclays US Barclays Barclays US MBS Global Trsy Ex Corp High US TR Hdg Yield 1 Mo Barclays US Barclays EM TIPS USD Agg • Fixed income markets were largely positive during the month of January. Within the opportunity set, high yield was once again the top performer, returning 1.45%, followed by emerging market debt, which returned 1.25%. Global Treasuries ex U.S. produced the lowest return of -1.06%.
The Bloomberg Barclays U.S. Aggregate Bond Index, a proxy for the overall bond market, returned 0.20% during the month. 1 Yr Source: Morningstar, Barclays 10-Year Government Bond Yields 8.00% 6.00% • Over the month, select international developed 10-year government bond yields increased, led by Italy and France. The 10-year U.S. Treasury yield was unchanged at 2.45%. 4.00% 2.00% 01/31/01 06/29/01 11/30/01 04/30/02 09/30/02 02/28/03 07/31/03 12/31/03 05/31/04 10/29/04 03/31/05 08/31/05 01/31/06 06/30/06 11/30/06 04/30/07 09/28/07 02/29/08 07/31/08 12/31/08 05/29/09 10/30/09 03/31/10 08/31/10 01/31/11 06/30/11 11/30/11 04/30/12 09/28/12 02/28/13 07/31/13 12/31/13 05/30/14 10/31/14 03/31/15 08/31/15 01/31/16 06/30/16 11/30/2016 0.00% U.S. Germany France Italy U.K. Data as of 01.31.2017; Source: FactSet, U.S.
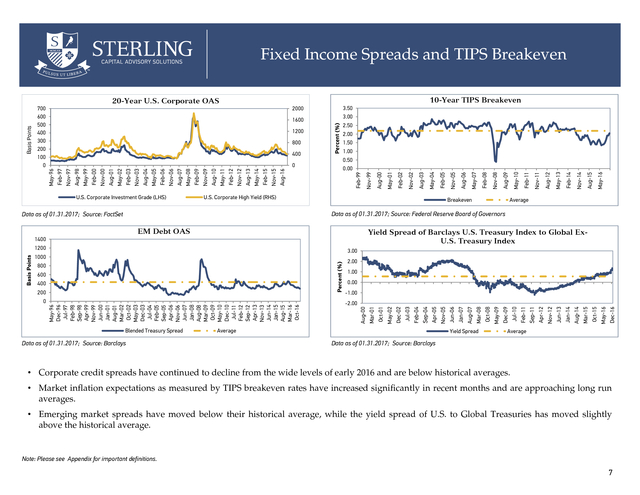
Department of Treasury Municipal/Treasury Yield Ratios Over The Last 5 Years As of 01.31.2017 180 163 Maximum Current Average 150 Percent 150 117 120 118 115 • Municipal/Treasury yield ratios moved lower for shorter-dated maturities and higher for longer-dated maturities. Ratios remain near historical averages across the curve. 90 60 57 55 66 74 84 30 2 Year Maturity 3 Year Maturity 5 Year Maturity 7 Year Maturity 10 Year Maturity Source: Thompson Reuters; Sterling Capital Management Analytics. 6 . Fixed Income Spreads and TIPS Breakeven 10-Year TIPS Breakeven 3.50 2000 U.S. Corporate Investment Grade (LHS) 1.00 0.50 Breakeven Aug-15 May-16 Feb-14 Nov-14 Aug-12 May-13 Feb-11 Nov-11 Aug-09 May-10 Feb-08 Nov-08 May-07 Aug-06 Feb-05 Nov-05 May-04 Aug-03 Feb-02 U.S. Corporate High Yield (RHS) Average Data as of 01.31.2017; Source: Federal Reserve Board of Governors Data as of 01.31.2017; Source: FactSet EM Debt OAS Yield Spread of Barclays U.S. Treasury Index to Global ExU.S.
Treasury Index 1400 1200 3.00 1000 Percent (%) Blended Treasury Spread Data as of 01.31.2017; Source: Barclays -1.00 Yield Spread Dec-16 May-16 Oct-15 Mar-15 Jan-14 Aug-14 Jun-13 Apr-12 Nov-12 Feb-11 Sep-11 Jul-10 Dec-09 May-09 Oct-08 Mar-08 Jan-07 Aug-07 Jun-06 Apr-05 Average Nov-05 Feb-04 Sep-04 -2.00 Jul-03 May-96 Dec-96 Jul-97 Feb-98 Sep-98 Apr-99 Nov-99 Jun-00 Jan-01 Aug-01 Mar-02 Oct-02 May-03 Dec-03 Jul-04 Feb-05 Sep-05 Apr-06 Nov-06 Jun-07 Jan-08 Aug-08 Mar-09 Oct-09 May-10 Dec-10 Jul-11 Feb-12 Sep-12 Apr-13 Nov-13 Jun-14 Jan-15 Aug-15 Mar-16 Oct-16 0 0.00 Dec-02 200 May-02 400 1.00 Oct-01 600 2.00 Mar-01 800 Aug-00 Basis Points Nov-02 0.00 May-01 Aug-16 Feb-15 Nov-15 Aug-13 May-14 Feb-12 Nov-12 Aug-10 May-11 Feb-09 Nov-09 Aug-07 May-08 Feb-06 Nov-06 Aug-04 May-05 Feb-03 Nov-03 Aug-01 May-02 Feb-00 Nov-00 Aug-98 May-99 Feb-97 Nov-97 0 1.50 Aug-00 400 2.00 Feb-99 800 2.50 Nov-99 1200 3.00 Percent (%) 1600 May-96 Basis Points 20-Year U.S. Corporate OAS 700 600 500 400 300 200 100 0 Average Data as of 01.31.2017; Source: Barclays • Corporate credit spreads have continued to decline from the wide levels of early 2016 and are below historical averages. • Market inflation expectations as measured by TIPS breakeven rates have increased significantly in recent months and are approaching long run averages. • Emerging market spreads have moved below their historical average, while the yield spread of U.S. to Global Treasuries has moved slightly above the historical average. Note: Please see Appendix for important definitions. 7 .
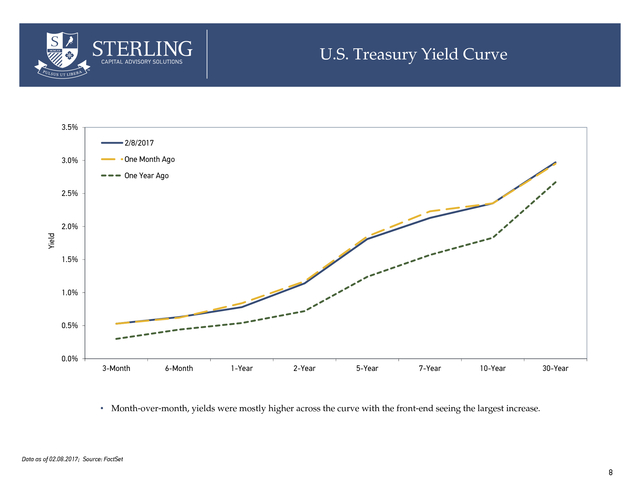
U.S. Treasury Yield Curve 3.5% 2/8/2017 One Month Ago 3.0% One Year Ago 2.5% Yield 2.0% 1.5% 1.0% 0.5% 0.0% 3-Month 6-Month 1-Year 2-Year 5-Year 7-Year 10-Year 30-Year • Month-over-month, yields were mostly higher across the curve with the front-end seeing the largest increase. Data as of 02.08.2017; Source: FactSet 8 . Global Equity Market Fundamentals Revenue to Firm Value U.S. Cyclically Adjusted Earnings Yield 1881 1884 1888 1892 1896 1899 1903 1907 1911 1914 1918 1922 1926 1929 1933 1937 1941 1944 1948 1952 1956 1959 1963 1967 1971 1974 1978 1982 1986 1989 1993 1997 2001 2004 2008 2012 2016 Data as of 01.31.2017; Source: Online Data Robert Shiller “US Stock Markets 1871-Present and CAPE Ratio” U.S. 3 Year Real Revenue Growth – Russell 3000 Non-Financials 30.00% 25.00% 20.00% 15.00% 10.00% 5.00% 0.00% -5.00% -10.00% -15.00% MSCI EAFE Oct-16 May-16 Jul-15 Dec-15 Feb-15 Apr-14 Sep-14 Nov-13 Jan-13 Jun-13 Aug-12 Oct-11 Mar-12 May-11 Jul-10 Russell 3000 Dec-10 Feb-10 Apr-09 Sep-09 Nov-08 0% Jan-08 May-06 5% Jun-08 10% Aug-07 15% Oct-06 20% Mar-07 0.9 0.8 0.7 0.6 0.5 0.4 0.3 0.2 0.1 0 25% MSCI Emerging Markets Index Data as of 01.31.2017; Source: Russell, MSCI Dividend Yield 6.00 5.00 4.00 3.00 2.00 1.00 Data as of 01.31.2017; Source: FactSet, Russell, Bureau of Labor Statistics, Sterling Capital Analytics May-96 Jan-97 Sep-97 May-98 Jan-99 Sep-99 May-00 Jan-01 Sep-01 May-02 Jan-03 Sep-03 May-04 Jan-05 Sep-05 May-06 Jan-07 Sep-07 May-08 Jan-09 Sep-09 May-10 Jan-11 Sep-11 May-12 Jan-13 Sep-13 May-14 Jan-15 Sep-15 May-16 Jan-17 Jan-89 Dec-89 Nov-90 Oct-91 Sep-92 Aug-93 Jul-94 Jun-95 May-96 Apr-97 Mar-98 Feb-99 Jan-00 Dec-00 Nov-01 Oct-02 Sep-03 Aug-04 Jul-05 Jun-06 May-07 Apr-08 Mar-09 Feb-10 Jan-11 Dec-11 Nov-12 Oct-13 Sep-14 Aug-15 Jul-16 0.00 Russell 3000 Index MSCI EAFE Index MSCI Emerging Markets Index Data as of 01.31.2017; Source: Russell, MSCI • The U.S. cyclically adjusted earnings yield continues to slowly decline and is well below longer-term averages, while real U.S.
sales growth continues to be weak. • Revenue to firm value in the U.S. has moved below international developed markets. The emerging markets’ ratio is only slightly higher than developed markets. • International developed equities provide a significant dividend yield advantage over emerging market and U.S.
equities. Note: Please see Appendix for important definitions. 9 . Appendix . Definitions Core Consumer Price Index: Core inflation is a measure of inflation that excludes certain items, usually food and energy, that face volatile price movements. Option Adjusted Spread (OAS): A bond’s yield spread over comparable maturity government bonds, adjusted for any embedded options. Real GDP: Real gross domestic product (GDP) is an inflation-adjusted measure that reflects the value of all goods and services produced by an economy in a given year, expressed in base-year prices. Revenue to Firm Value: Total Index Revenues of the past 12 months divided by the sum of equity market value and the value of total debt. This is a measure of total sales generated on the total value (debt plus equity) of firms in the index. TIPS Breakeven: The inflation rate implied by the spread in yield between U.S. TIPS (Treasury Inflation Protected Securities) and nominal U.S. Government Bonds of equal maturity. U.S.
3 yr. Real Revenue Growth, Russell 3000 Non-Financials: For the Russell 3000 excluding financial firms, the percentage change in trailing 12-month inflation adjusted revenue over 12-month inflation adjusted revenue three years prior. U.S. Cyclically Adjusted Earnings Yield: The 10-year average of annual, inflation adjusted earnings divided by the current inflation adjusted price of the S&P 500 index.
This measure is the inverse of the Shiller CAPE Ratio. YOY US Productivity Growth: The year-over-year growth in real U.S. output produced per hour worked for non-farm workers. 10 . Disclosures The opinions expressed herein are those of Sterling Capital Management and the Sterling Advisory Solutions Team, and not those of BB&T Corporation or its executives. The stated opinions are for general information only and are not meant to be predictions or an offer of individual or personalized investment advice. They are not intended as an offer or solicitation with respect to the purchase or sale of any security. This information and these opinions are subject to change without notice.
Any type of investing involves risk and there are no guarantees. Sterling Capital Management LLC does not assume liability for any loss which may result from the reliance by any person upon such information or opinions. Investment advisory services are available through Sterling Capital Management LLC, a separate subsidiary of BB&T Corporation. Sterling Capital Management LLC manages customized investment portfolios, provides asset allocation analysis and offers other investment-related services to affluent individuals and businesses.
Securities and other investments held in investment management or investment advisory accounts at Sterling Capital Management LLC are not deposits or other obligations of BB&T Corporation, Branch Banking and Trust Company or any affiliate, are not guaranteed by Branch Banking and Trust Company or any other bank, are not insured by the FDIC or any other federal government agency, and are subject to investment risk, including possible loss of principal invested. The securities/instruments discussed in this material may not be suitable for all investors. The appropriateness of a particular investment or strategy will depend on an investor’s individual circumstances and objectives. Asset allocation and diversification do not assure a profit or protect against loss in declining financial markets. The indexes are unmanaged and are shown for illustrative purposes only. Indexes do not represent the performance of any specific investment.
An investor cannot invest directly in an index. The indexes selected by Sterling Capital Management to measure performance are representative of broad asset classes. Sterling Capital Management retains the right to change representative indexes at any time. 11 .