1) Behavioral Finance
360°Behavioral View
May 2015
Our Periodic Review Exploring Multiple Topics Related to Behavioral Finance
• Market Driven • Economic • Psychological • Probabilistic • Investable •
Market Inflections…Sometimes the Tides Shift; Sometimes it is Just a Head Fake
The recent volatility in the price of oil has provided a good backdrop to review how
Sterling’s Behavioral Equity Strategies dynamically adjust to changing market
fundamentals and sentiment.
Oil Price Recap
Oil traded in a fairly tight range around $110 since the middle of 2013. That all changed in the
middle of 2014 when oil started its descent that ultimately lead to an almost 60% decline in
price where the trough was reached on January 13, 2015 at a price of $46.59. April saw
another significant shift in the energy markets. Brent crude oil rallied from $55.11 to $66.78 in
the month of April (a 21% gain in the period of a month). This completely reversed the
negative returns associated with Brent (3.9%) in the first quarter.
BRENT Crude Oil Price
160
21% increase in price
in the month of April 2015.
3/31/15 - 4/30/15 Increasinging price of crude
140
GICS_SUBINDUSTRY
120
Average
Performance
(%)
Oil & Gas Drilling
Oil & Gas Refining & Marketing
100
23.0
(6.1)
80
60
40
Brent trading relatively range bound.
6/26/13 - 6/30/14 - Steady price of crude
GICS_SUBINDUSTRY
Average
Performance
(%)
Oil & Gas Drilling
20
37.7
Oil & Gas Refining & Marketing
19.8
59% decline in price from 6/30/14
to the trough of $46.59 on 1/13/15.
6/30/14 - 3/31/15 - Declinging price of crude
GICS_SUBINDUSTRY
Average
Performance
(%)
Oil & Gas Drilling
Oil & Gas Refining & Marketing
(50.8)
20.1
0
Data as of 4/30/15. Source: Bloomberg, Sterling Capital Management Analytics.
1
2) Behavioral Finance
360°Behavioral View
May 2015
Energy Sub Industry Analysis
Oil and gas drilling companies are heavily levered to the price of oil (they also have a fair
degree of financial leverage). At $110 a barrel, drilling can be quite lucrative. Indeed, from the
middle of 2013 through the middle of 2014 US large and midcap drillers’ average return was
over +37%. This contrasted with the refiners (less impacted by the price of oil) which had an
average return of just over +19% during the same period. As the price of oil fell significantly,
the drillers significantly underperformed the refiners; average returns of -50% relative to +20%
respectively. As the price of oil rebounded in April, those companies more highly levered to
the price of oil such as the drillers massively outperformed those less levered to the price of oil
as evidenced by the drillers average April 2015 return of +23% relative to the refiners of just
shy of -6%. During the rebound in price of oil we saw in April, the drillers significantly
outperformed the refiners as the prospect of higher oil prices on drillers earnings going
forward was viewed favorably by the market.
Sterling Capital Behavioral Portfolio Construction – A Dynamic Investment Process
Integral to our portfolio construction process is our stock ranking methodology that seeks to
capitalize upon investor biases and heuristics (rules of thumb). Each of our behaviorally
driven momentum and value factors is ranked relative to the entire investment universe (in the
case of large cap, the largest 1,000 stocks by market cap). The ultimate result leads to a
portfolio of stocks that is cheaper than and has more momentum than the associated
benchmark index. Sterling’s behavioral value and momentum ranks are dynamic: they adjust
as new information enters the market.
Behavioral Value and Momentum Ranks
(Lower is Better)
100
90
80
70
60
50
40
30
20
10
0
6/26/2013
9/30/2013
12/31/2013
3/31/2014
Oil & Gas Drilling
6/30/2014
9/30/2014
12/31/2014
3/31/2015
4/29/2015
Oil & Gas Refining & Marketing
Data as of 4/29/15. Source: Bloomberg, Sterling Capital Management Analytics.
2
3) Behavioral Finance
360°Behavioral View
May 2015
Using the previous two sub industries as an example, one can see ranks adjust as new information
comes to market.
Oil and Gas Refining and Marketing – A sub- industry that is less sensitive to absolute price of oil
US Large and Midcap refiners have exhibited favorable value and momentum traits to various degrees
from the middle of 2013 through today. What is interesting is that their ranks deteriorated at the
margin as the price of oil moved. In the time series ranks listed above one can see a noticeable decline
in rank between June and December 2014 in tandem with the fall in oil prices. This was largely driven
by momentum, specifically our behaviorally based Price Momentum coupled with Earnings Revisions
as analysts took into account the fact that refiners had a bunch of higher cost inventory (oil) on their
books that they would have refine and sell at lower prices. Once these adjustments were made, refiners
enjoyed a period of attractive relative returns as the costs of goods (oil) were aligned with their
proceeds (gasoline, other refined products).
Oil and Gas Drilling – A sub- industry that is more sensitive to absolute price of oil
This sub-industry is highly levered to the absolute price of oil (the higher the price, the more
profitable). Despite the average (hovering between the 50 and 60th percentile meaning average
behavioral value and momentum traits) constituent ranks of the sub-industry during the boom times,
there were companies in it that were attractive when the price of oil was trading around $110/barrel.
Once the oil price decline commenced, as can be expected, momentum collapsed led by earnings
revisions as analysts took down future earnings estimates which was followed by deterioration in price
momentum. Unlike the refiners, the momentum didn’t re-establish itself. This was due to the fact that
this subindustry is more sensitive to the absolute price of oil, at a price in the mid $40’s drilling for oil is
nowhere near as lucrative as $60 never mind $110.
BRENT Crude Oil Price
Rising oil prices:
Oil and Gas Drilling - Start to
outperform given prospects of
higher oil prices
Oil and Gas Refining and Marketing Start to underperform sub industries
with greater exposure to absolute
price of oil.
140
120
100
80
60
40
20
Range bound oil prices:
Oil and Gas Drilling - Favorable Price Momentum and Earnings Revision
possible given higher cost of oil.
Oil and Gas Refining and Marketing - Favorable Price Momentum and Earnings
Revisions possible given the range bound price of oil.
Declining oil prices:
Oil and Gas Drilling - Declining Earnings Revisions given profit margin squeeze.
Declining Price Momentum.
Oil and Gas Refining and Marketing - Declining Earnings Revision (temporary) given
higher cost inventory. Price Momentum declines but not as much as the Drillers.
0
Data as of 4/30/15. Source: Bloomberg.
3
4) Behavioral Finance
360°Behavioral View
May 2015
A Tale of Two Portfolios, or More Applicably a Portfolio in Transition:
Conclusion
More
Oil & Gas Drilling
% of
Energy
Exposure
8%
Oil & Gas Equipment & Services
15%
Oil & Gas Exploration & Production
15% 38%
Oil & Gas Storage & Transporta
Less
Sensitivity to Absolute
Price of Oil
6/30/2013
0%
Oil & Gas Refining & Marketing
45%
Integrated Oil & Gas
18%
Coal & Consumable Fuels
More
6/30/2014
0% 62%
% of
Energy
Exposure
Oil & Gas Drilling
12%
Oil & Gas Equipment & Services
24%
Oil & Gas Exploration & Production
5% 41%
Oil & Gas Storage & Transporta
Less
Sensitivity to Absolute
Price of Oil
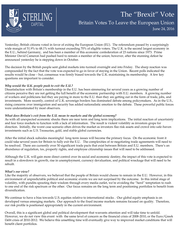
As the price of oil collapsed, our behavioral
large cap value strategy dynamically shifted
energy exposure from a stance that was
positioned to capture the high price of oil to
one that was less susceptible to the price of
oil.
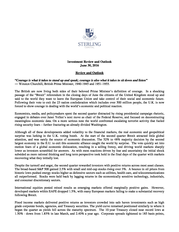
Below are three different periods
showing the energy exposure of a
Behavioral Large Cap Value representative
account. The first two cuts show how we
were positioned at peak oil, the last how the
portfolio had shifted exposure as the price of
oil declined. In the first two time periods,
notice how our overall exposure to subindustries that are more levered to the
absolute price of oil is little changed.
Contrast this with the 12/31/14 portfolio.
Note how the portfolio dynamically
adjusted to sub-industries less driven by the
absolute price of oil.
0%
Oil & Gas Refining & Marketing
41%
Integrated Oil & Gas
18%
Coal & Consumable Fuels
0% 59%
% of
Energy
Exposure
More
Less
Sensitivity to Absolute
Price of Oil
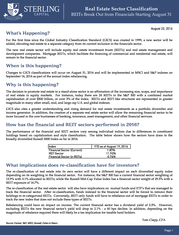
Our Behavioral based strategies are
specifically designed to trade on actual
12/31/2014
shifts in fundamentals and sentiment, not
Oil & Gas Drilling
4%
market “head fakes.” Over time more often
Oil & Gas Equipment & Services
12%
than not the market will go one direction in
Oil & Gas Exploration & Production
0% 16%
the short term only to turn on a dime and
Oil & Gas Storage & Transporta
22%
head the other direction. As the price of oil
continues to climb the odds are increasing
Oil & Gas Refining & Marketing
62%
that the portfolio will self-adjust and gain
Integrated Oil & Gas
0%
more exposure to those sub-industries that
Coal & Consumable Fuels
0% 84%
have greater exposure to the absolute level
Source: Sterling Capital Management Analytics
of oil as it becomes more attractive to own
them. That said it is futile to try to game the investment process. As of this time, our investment
process has not adjusted the portfolios due to this increase in oil price. One should be rest-assured, if
the trend persists (and or the price of oil doesn’t go back down and fundamentals support an
adjustment), much as we saw the adjustment occur on the way down to holdings less sensitive to the
price of oil, we will likely see the portfolio positions adjust and ultimately own more names that are
levered to the absolute price of oil.
FOR INSTITUTIONAL USE ONLY. NOT TO BE DISTRIBUTED OR COMMUNICATED TO THE GENERAL PUBLIC
The opinions contained in the preceding commentary reflect those of Sterling Capital Management LLC, and not those of BB&T Corporation or its executives. The stated opinions
are for general information only and are not meant to be predictions or an offer of individual or personalized investment advice. This information and these opinions are subject to
change without notice. Any type of investing involves risk and there are no guarantees. Sterling Capital Management LLC does not assume liability for any loss which may result
from the reliance by any person upon such information or opinions.
4