x
Total Views  :   1208
Total Likes  :  0
Total Shares  :  0
Total Comments :  0
Total Downloads :  0

Add Comments
Presentation Slides

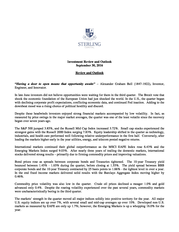
1) Investment Review and Outlook September 30, 2016 Review and Outlook “Having a door to open means that opportunity awaits” – Alexander Graham Bell (1847-1922), Inventor, Engineer, and Innovator. In late June investors did not believe opportunities were waiting for them in the third quarter. The Brexit vote that shook the economic foundation of the European Union had just shocked the world. In the U.S., the quarter began with declining corporate profit expectations, conflicting economic data, and continued Fed inaction. Adding to the downbeat mood was a rising chorus of political hostility and discord. Despite these headwinds investors enjoyed strong financial markets accompanied by low volatility. In fact, as measured by price swings in the major market averages, the quarter was one of the least volatile since the recovery began over seven years ago. The S&P 500 jumped 3.85%, and the Russell Mid Cap Index increased 3.72%. Small cap stocks experienced the strongest gains with the Russell 2000 Index surging 7.83%. Equity leadership shifted in the quarter as technology, industrials, and health care performed well following relative underperformance in the first half. Conversely, after leading the markets higher early in the year utilities, energy, and telecom posted negative returns. International markets continued their global outperformance as the MSCI EAFE Index rose 6.43% and the Emerging Markets Index surged 9.03%. After nearly three years of trailing the domestic markets, international stocks delivered strong results – primarily due to firming commodity prices and improving valuations. Bond prices rose as spreads between corporate bonds and Treasuries tightened. The 10-year Treasury yield bounced between 1.45% - 1.65% during the quarter, before closing at 1.55%. The yield spread between BBB corporate bonds and the 10-year Treasury contracted by 25 basis points to 1.66% - the tightest level in over a year. In the end fixed income markets delivered solid results with the Barclays Aggregate Index moving higher by 0.46%. Commodity price volatility was also low in the quarter. Crude oil prices declined a meager 1.0% and gold advanced only 0.4%. Despite the roaring volatility experienced over the past several years, commodity markets were uncharacteristically boring in the third quarter. The markets’ strength in the quarter moved all major indices solidly into positive territory for the year. All major U.S. equity indices are up over 7%, with several small and mid-cap averages up over 10%. Developed non-U.S. markets as measured by EAFE are only up 1.7%; however, the Emerging Markets is up a whopping 16.0% for the year.

2) Page 2 Despite rising economic, political, and global anxiety, markets’ posted one of their most broad-based quarterly advances in several years. Volatility was historically low as the S&P 500 traded in a narrow channel, and most economic reports fell within expectations. Overall, markets were steady and calm, prompting one pundit to refer to them as “boring and monotonous”. The Economy and Financial Markets: Tranquility Comes to an End “We choose chaos over boredom every time” – James Gleick (1954 – Present), Pulitzer Prize winning author and noted authority on chaos theory. As financial markets go, the third quarter was surprisingly tranquil – characterized by low volatility and steadily rising returns. Markets seemed to respond rationally to economic news and geopolitical developments. Although the quarter offered a much needed respite after years of market mania, we do not believe this trend will continue. In fact, we see resurgence in volatility as we trudge through the fourth quarter and into 2017. As we enter the fourth quarter investors will have to contend with the uncertainty of the U.S elections, rising global banking concerns, a re-start of the Fed’s monetary tightening policy, and negative interest rates in Japan and Germany. The question facing investors is whether fundamentals are strong enough to support the market when these, and other, unsettling events unfold. U.S. equity valuations by many measures are elevated, and year-over-year corporate earnings are expected to decline for the sixth consecutive quarter. After starting the year playing it safe, investors have ratcheted up their risk exposure. Corporate yield spreads have tightened, a rotation out of low beta sectors such as utilities into high beta technology stocks is underway, and small caps are outpacing large caps. Globally, the volatile emerging markets are attracting substantial capital flows - driving these risky markets higher. In our view the impending collision between fragile fundamentals and major geopolitical and monetary events will cause markets to be vulnerable to sharply higher volatility, and the increased potential for price pullbacks. We believe there is a low probability that the U.S. slips into a recession. The Fed has signaled it will raise interest rates in a measured and deliberate fashion. Although we believe the Fed will resume its rate hikes in December, it is likely to be a marginal increase, and laced with cautionary guidance that suggests the Fed does not want to risk an economic retrenchment. The absence of a recession should allow financial markets to avoid a sustained downturn. Modest growth should continue, which will allow corporate profitability to gradually improve in the first half of 2017. Strong corporate balance sheets, rising consumer spending and continued M&A activity should further support the markets. In this environment investors need to keep their return expectations in check. As we’ve seen over the past several years, building expectations based on past experiences can lead to poor investment decisions. For instance, with historically low interest rates, benign inflation, and slow economic growth, equity return expectations need to be pushed down from the traditional long-term assumptions that have been used in previous cycles. Equity return expectations in the 5%-6% range seem more reasonable in the current environment than previous expectations of 8%-10% Internationally, the risk of recession is higher than what exists in the U.S. – particularly in Europe. Unease over the impact of Brexit, uncertainty over the state of many European banks, and the unsettling political environment makes the Eurozone susceptible to an economic contraction. However, we would expect this to be short-lived and relatively shallow in its magnitude. Since we do not anticipate a prolonged economic downturn and subsequent

3) Page 3 decline in asset values we are maintaining our exposure. Long term, we believe many of these markets offer attractive growth potential. Emerging markets offer their own unique economic challenges. China continues to pursue fiscal and monetary policies that encourage their economic transition away from manufacturing and more towards a consumer-driven economy. Several missteps, such as erratic monetary policies, over the past few years have resulted in a slowdown in growth. Despite these setbacks China is expected to be a significant driver of global economic demand over the long term. Other emerging markets such as Brazil and Russia are held hostage to the weak commodity markets. However, global economic growth will ultimately drive higher demand for these markets’ raw materials. Overall, our expectations for global economic growth are modest. We don’t foresee signs of significant recession, nor do we expect a meaningful expansion. U.S. GDP growth for 2016 is likely to finish in the 2.00%-2.25% range – up only marginally from 2015’s 2.0% growth. The developed economies of Europe, Japan, and Australia should post positive growth of about half the rate of the U.S. Our expectations for 2017 are higher than what we are experiencing this year. Our optimism is based on improvements in consumer spending and a global increase in capital investment. As we head into the final months of 2016 there is a great deal of economic and market uncertainty. However, we believe investors can count on a sharp increase in volatility accompanied by bouts of investor chaos. Active vs. Passive Investing: Is There a Middle Ground? “If you seek peace, if you seek prosperity for the Soviet Union and Eastern Europe, come here to this gate. Mr. Gorbachev, tear down this wall!” – President Ronald Reagan in East Berlin, June 12, 1987. President Reagan’s demand to have the Berlin wall torn down has some relevance in today’s financial markets. The investment management industry has been engaged in a philosophical “cold war” for decades. Since the launch of the modern mutual fund structure for individual investors in the early 1970’s investment managers, academicians, and other market participants have engaged in heated debate over the question of active versus passive management. After years of contentious exchange of investment ideas and philosophies a virtual wall of strong disagreement has developed. We have followed this debate for many years, and our conclusion is best summarized by what is known as the Mile’s Law – named after a federal judge during the Truman administration. He said “where you stand, depends on where you sit.” In other words, your opinion is strongly rooted in where you have a vested interest. Those standing to gain by one approach versus the other will argue strongly in favor of their own interests – making it difficult to reach an objective conclusion. There have been countless academic and industry research reports written on this subject. We do not intend to add to the massive pile of research and commentary that has been produced over the years. However, there are some useful findings that we can implement in portfolios that help achieve investment objectives. Our view is that there can be significant benefits to blending both approaches in portfolios. Active management is an investment strategy that uses research to select and build a portfolio. By evaluating a company’s financial fundamentals, active managers believe their security selections can lead them to identify investments that will outperform their benchmark index. Passive management is an investment strategy that is based on the belief that the market is “efficient”, or that stocks will always trade at a fair price that reflects all available market information. Passive managers will seek to closely match the returns of the index by owning all constituents of the benchmark. After years of fighting to gather investor assets disciples of both philosophies have

4) Page 4 become hardened in their beliefs. Our view is that we can use these competing approaches to build portfolios with an improved risk/return balance versus choosing one or the other. In addition, the availability of passive strategies to track multiple asset classes continues to grow. Beyond traditional equity and fixed income index funds, there are strategies that are managed to track sub-markets and specific sectors. Growth has exploded in index mutual funds and exchange traded funds (ETFs). At the end of the first quarter ETF assets topped $2 trillion. At the close of 2015 28% of total industry assets were in passively managed strategies, up from 11% in 2005. However, despite the proliferation of these strategies it is critical that appropriate aspects of these products are included in the investment decision. Low management fees can be tempting; but, other considerations such as liquidity, tracking error versus the benchmark, and manager suitability are equally as important. We believe this is an essential part of our research responsibility when looking to add any strategy to portfolios. Similar to the return pattern found in competing asset classes such as stocks and bonds, active and passive strategies also exhibit a distinct cycle. By taking the performance difference between the median active manager and the underlying benchmark over time we can see that there is a cycle with extended periods when security selection adds value over the passive benchmark. Conversely, there are times when the benchmark beats the return of the active manager. The bars measure the spread between the median active manager (net of fees) and the return of the benchmark. Bars above the zero reference line are periods of relative outperformance by the active manager, with those below the line being periods where managers have lagged. The chart below demonstrates this cycle over rolling three year returns for the past 25 years for managers that consider the S&P 500 to be their benchmark. The solid line shows the level of dispersion within the S&P 500 on a three year rolling basis. By measuring the return spread between the highest and lowest performing quintiles within the benchmark we see that dispersion moves in cycles. 18 Median Manager Spread vs. Index Dispersion Rolling 3 Years (12/31/91-6/30/16) Strategy 14 Median Manager S&P 500 50/50 Blend Annual Return 9.28% 8.91% 9.12% Standard Deviation 8.06% 7.27% 6.95% 10 Median Dispersion: 6.4% 6 2 -2 Median Manager Outperforming Median Manager Underperforming -6 Median Mgr vs. S&P 500 Index Dispersion Manager universe includes returns of active managers with the S&P 500 as their benchmark (net of fees). Dispersion as measured by top decile performance of index minus bottom decile return.

5) Page 5 The primary driver of active manager relative performance is the dispersion of individual security returns within the benchmark. When performance among constituents is “bunched” together with low dispersion it becomes very difficult for managers to add value through stock selection. Low dispersion has dominated the market since 2011. This has made it extremely difficult for active managers to outperform. However, the opposite is true when dispersion is wide within the benchmark. High dispersion offers managers a better opportunity to outperform through stock selection. This occurred from 1999–2003 and 2006-2009. Both were extended periods of active manager outperformance. Similar to the relationship between different asset classes it is evident that a cycle exists between investment approaches within asset classes. Therefore, blending active and passive strategies can offer further diversification. As the inset box on the chart shows, active managers have outperformed the benchmark over the long-term; however, with more volatility. By blending active with passive, portfolio returns exceed the benchmark with less volatility. This analysis of manager performance in environments of high and low dispersion only shows results relative to the S&P 500. Less efficient asset classes such as small and mid-caps, international developed and emerging markets have significantly higher dispersion. The wider return spreads in these markets give active managers greater opportunities to outperform. Increased volatility can drive higher levels of dispersion. Therefore, we believe there will be future opportunities for active managers to outperform after a prolonged period of underperformance. Our long held belief has been that diversification across multiple asset classes is a key driver to achieving investment objectives. In addition, there are significant benefits to diversifying among active and passive investment strategies within the multiple asset classes. We plan to continue to use this approach. Investment Strategy “Anyone can hold the helm when the sea is calm”- (1848) Original inscription on the America’s Cup trophy. The tranquility of the financial markets is behind us. We fully anticipate a choppy journey between now and year end. The challenge most investors face during uncertain times is the temptation to overreact. Our view is that discipline and adherence to our long term approach to investing helps us “hold the helm” during both calm and turbulent times. The market’s migration to more risk-oriented assets since mid-year is not surprising given investor focus on risk reduction in the first half of the year. Rapid shifts in risk appetite are expected during uncertain times. Our emphasis on diversification helps mitigate unnecessary risk while allowing for participation in areas of the market that are performing well. We continue to watch closely the developments unfolding in the presidential election. As with most political spectators we have become exhausted by the race. Despite moments of great amusement, we believe our markets will benefit most from putting this election behind us and removing uncertainty. Regardless of who occupies the oval office we anticipate their passionate campaign rhetoric about taxes, regulations, fiscal spending, and trade policies will encounter the same slow moving legislative grinder that defines Washington. Although it may seem frustrating to many, a “slow-motion” government is what markets like the most. Despite concerns over slow economic growth and near term earnings prospects, we remain committed to U.S. equities. Our continued focus is on balance sheets, cash flow, durable earnings and dividend growth, and M&A

6) Page 6 activity. Maintaining diversification across market capitalization will be important as leadership is expected to shift rapidly as risk tolerances gyrate. Outside of the U.S., we maintain our long term exposure to international markets although we are underweight relative to U.S. equities. We expect global markets to be the victim of sharp volatility as we close out the year. Although unsettling in the near term, non-U.S. markets account for over 50% of global capitalization, provide positive growth opportunities, and offer improving valuations. Our fixed income strategy remains consistent with where we have been positioned throughout the year. Our portfolios are positioned defensively with intermediate and long-term portfolios managed short versus their benchmarks. Slowly improving economic growth favors overweighting corporate securities relative to Treasury and agency bonds. Municipal bonds lagged taxable bonds in the third quarter – making their valuations more attractive than earlier in the year. Consistent with consensus the Fed opted to not raise interest rates in September. In our view the combination of the upcoming presidential election and persistently slow growth allows the Fed to delay action until December. The peace and quiet that defined the markets in the third quarter is behind us. The opinions contained in the preceding commentary reflect those of Sterling Capital Management LLC, and not those of BB&T Corporation or its executives. The stated opinions are for general information only and are not meant to be predictions or an offer of individual or personalized investment advice. They also are not intended as an offer or solicitation with respect to the purchase or sale of any security. This information and these opinions are subject to change without notice. Any type of investing involves risk and there are no guarantees. Sterling Capital Management LLC does not assume liability for any loss which may result from the reliance by any person upon any such information or opinions. Investment advisory services are available through Sterling Capital Management LLC, a separate subsidiary of BB&T Corporation. Sterling Capital Management LLC manages customized investment portfolios, provides asset allocation analysis and offers other investment-related services to affluent individuals and businesses. Securities and other investments held in investment management or investment advisory accounts at Sterling Capital Management LLC are not deposits or other obligations of BB&T Corporation, Branch Banking and Trust Company or any affiliate, are not guaranteed by Branch Banking and Trust Company or any other bank, are not insured by the FDIC or any other government agency, and are subject to investment risk, including possible loss of principal invested.