Strategy & Outlook - Economic and Market Recap January 31, 2017
Sterling Capital Management LLC


Description
Strategy & Outlook
. Economic and Market Recap
January 31, 2017
U.S Equity Markets
Index
S&P 500
Russell 3000
Russell Mid Cap
Russell 2000
January
1.90%
1.88%
2.41%
0.39%
Index
EAFE Developed Markets
MSCI Emerging Markets
Euro-Zone
Japan
China
Brazil
January
2.90%
5.47%
-1.07%
-1.07%
1.49%
6.66%
Security
2 Year UST
10 Year UST
"BBB" Corporate
Yield Spread in BPS (1)
Gold / oz.
Oil (WTI) / barrel
1/31/2017
1.23%
2.47%
3.68%
119
$1,211
$52.81
One Year
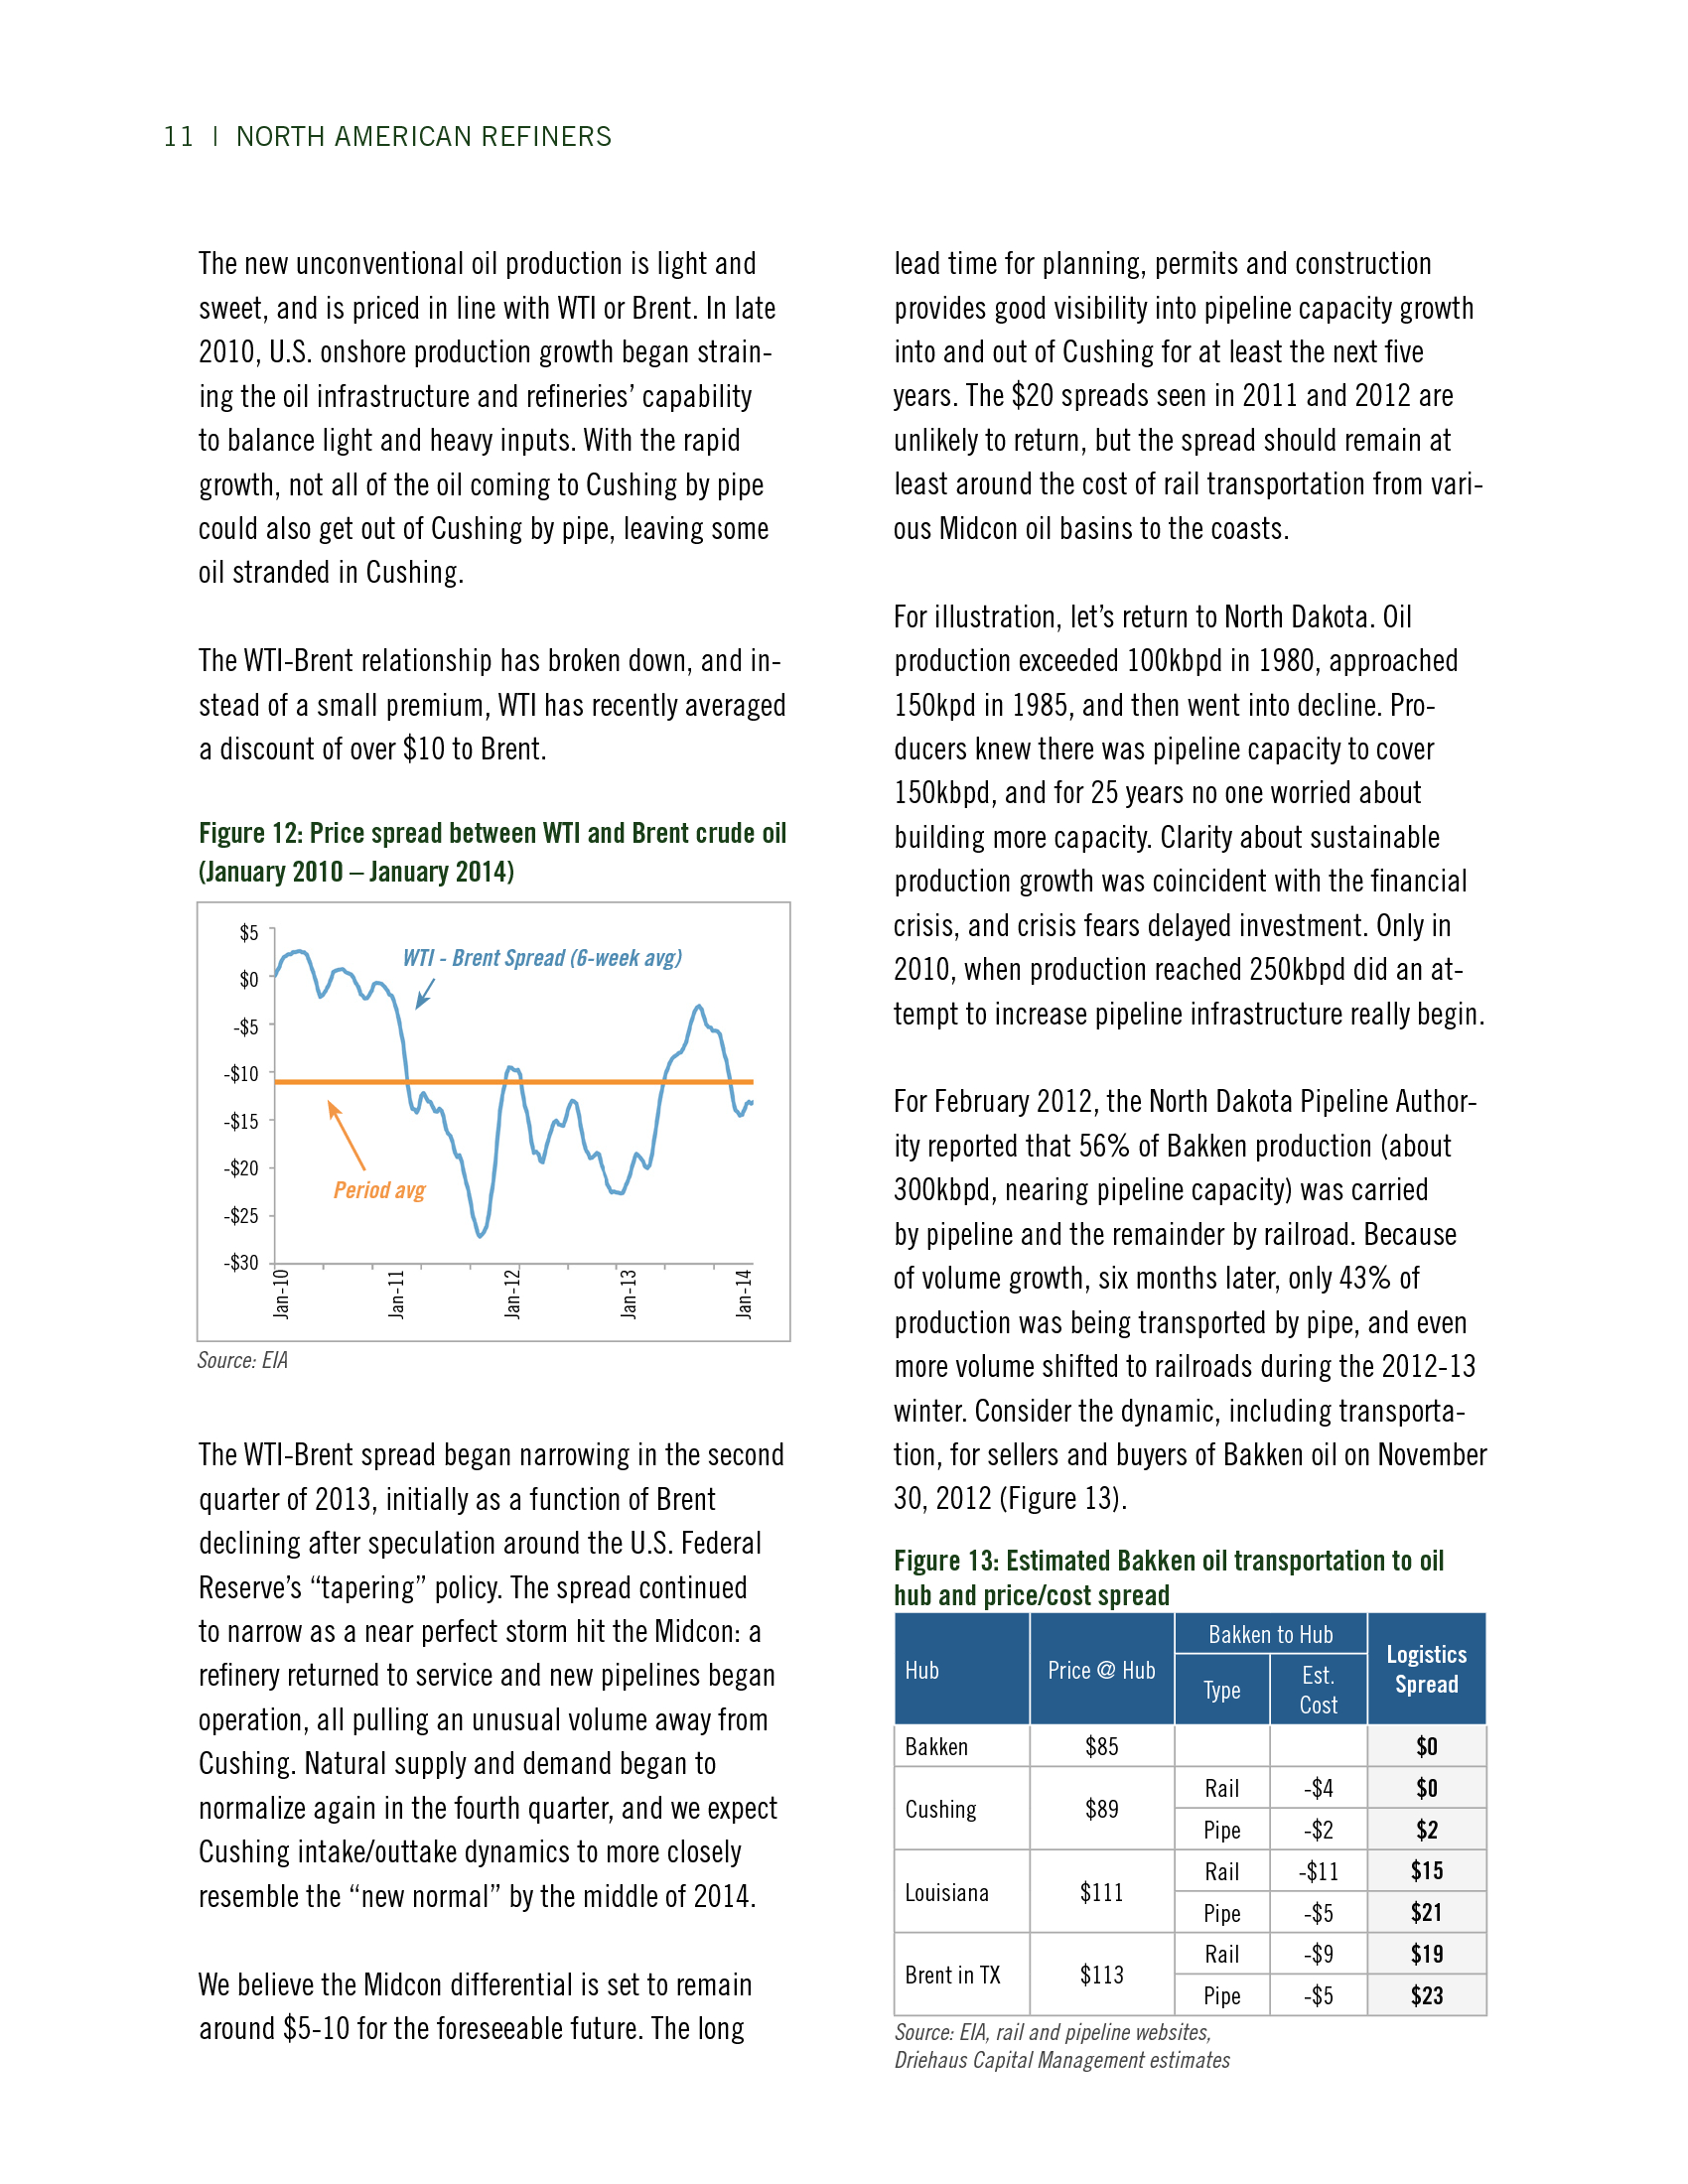
 Markets continued to rally in January pushing year-over-year
20.04%
returns above 20% for most indices.
21.73%
24.72%
 Financials and technology led the markets higher with energy and
33.53%
telecommunication lagging.
International Markets
One Year
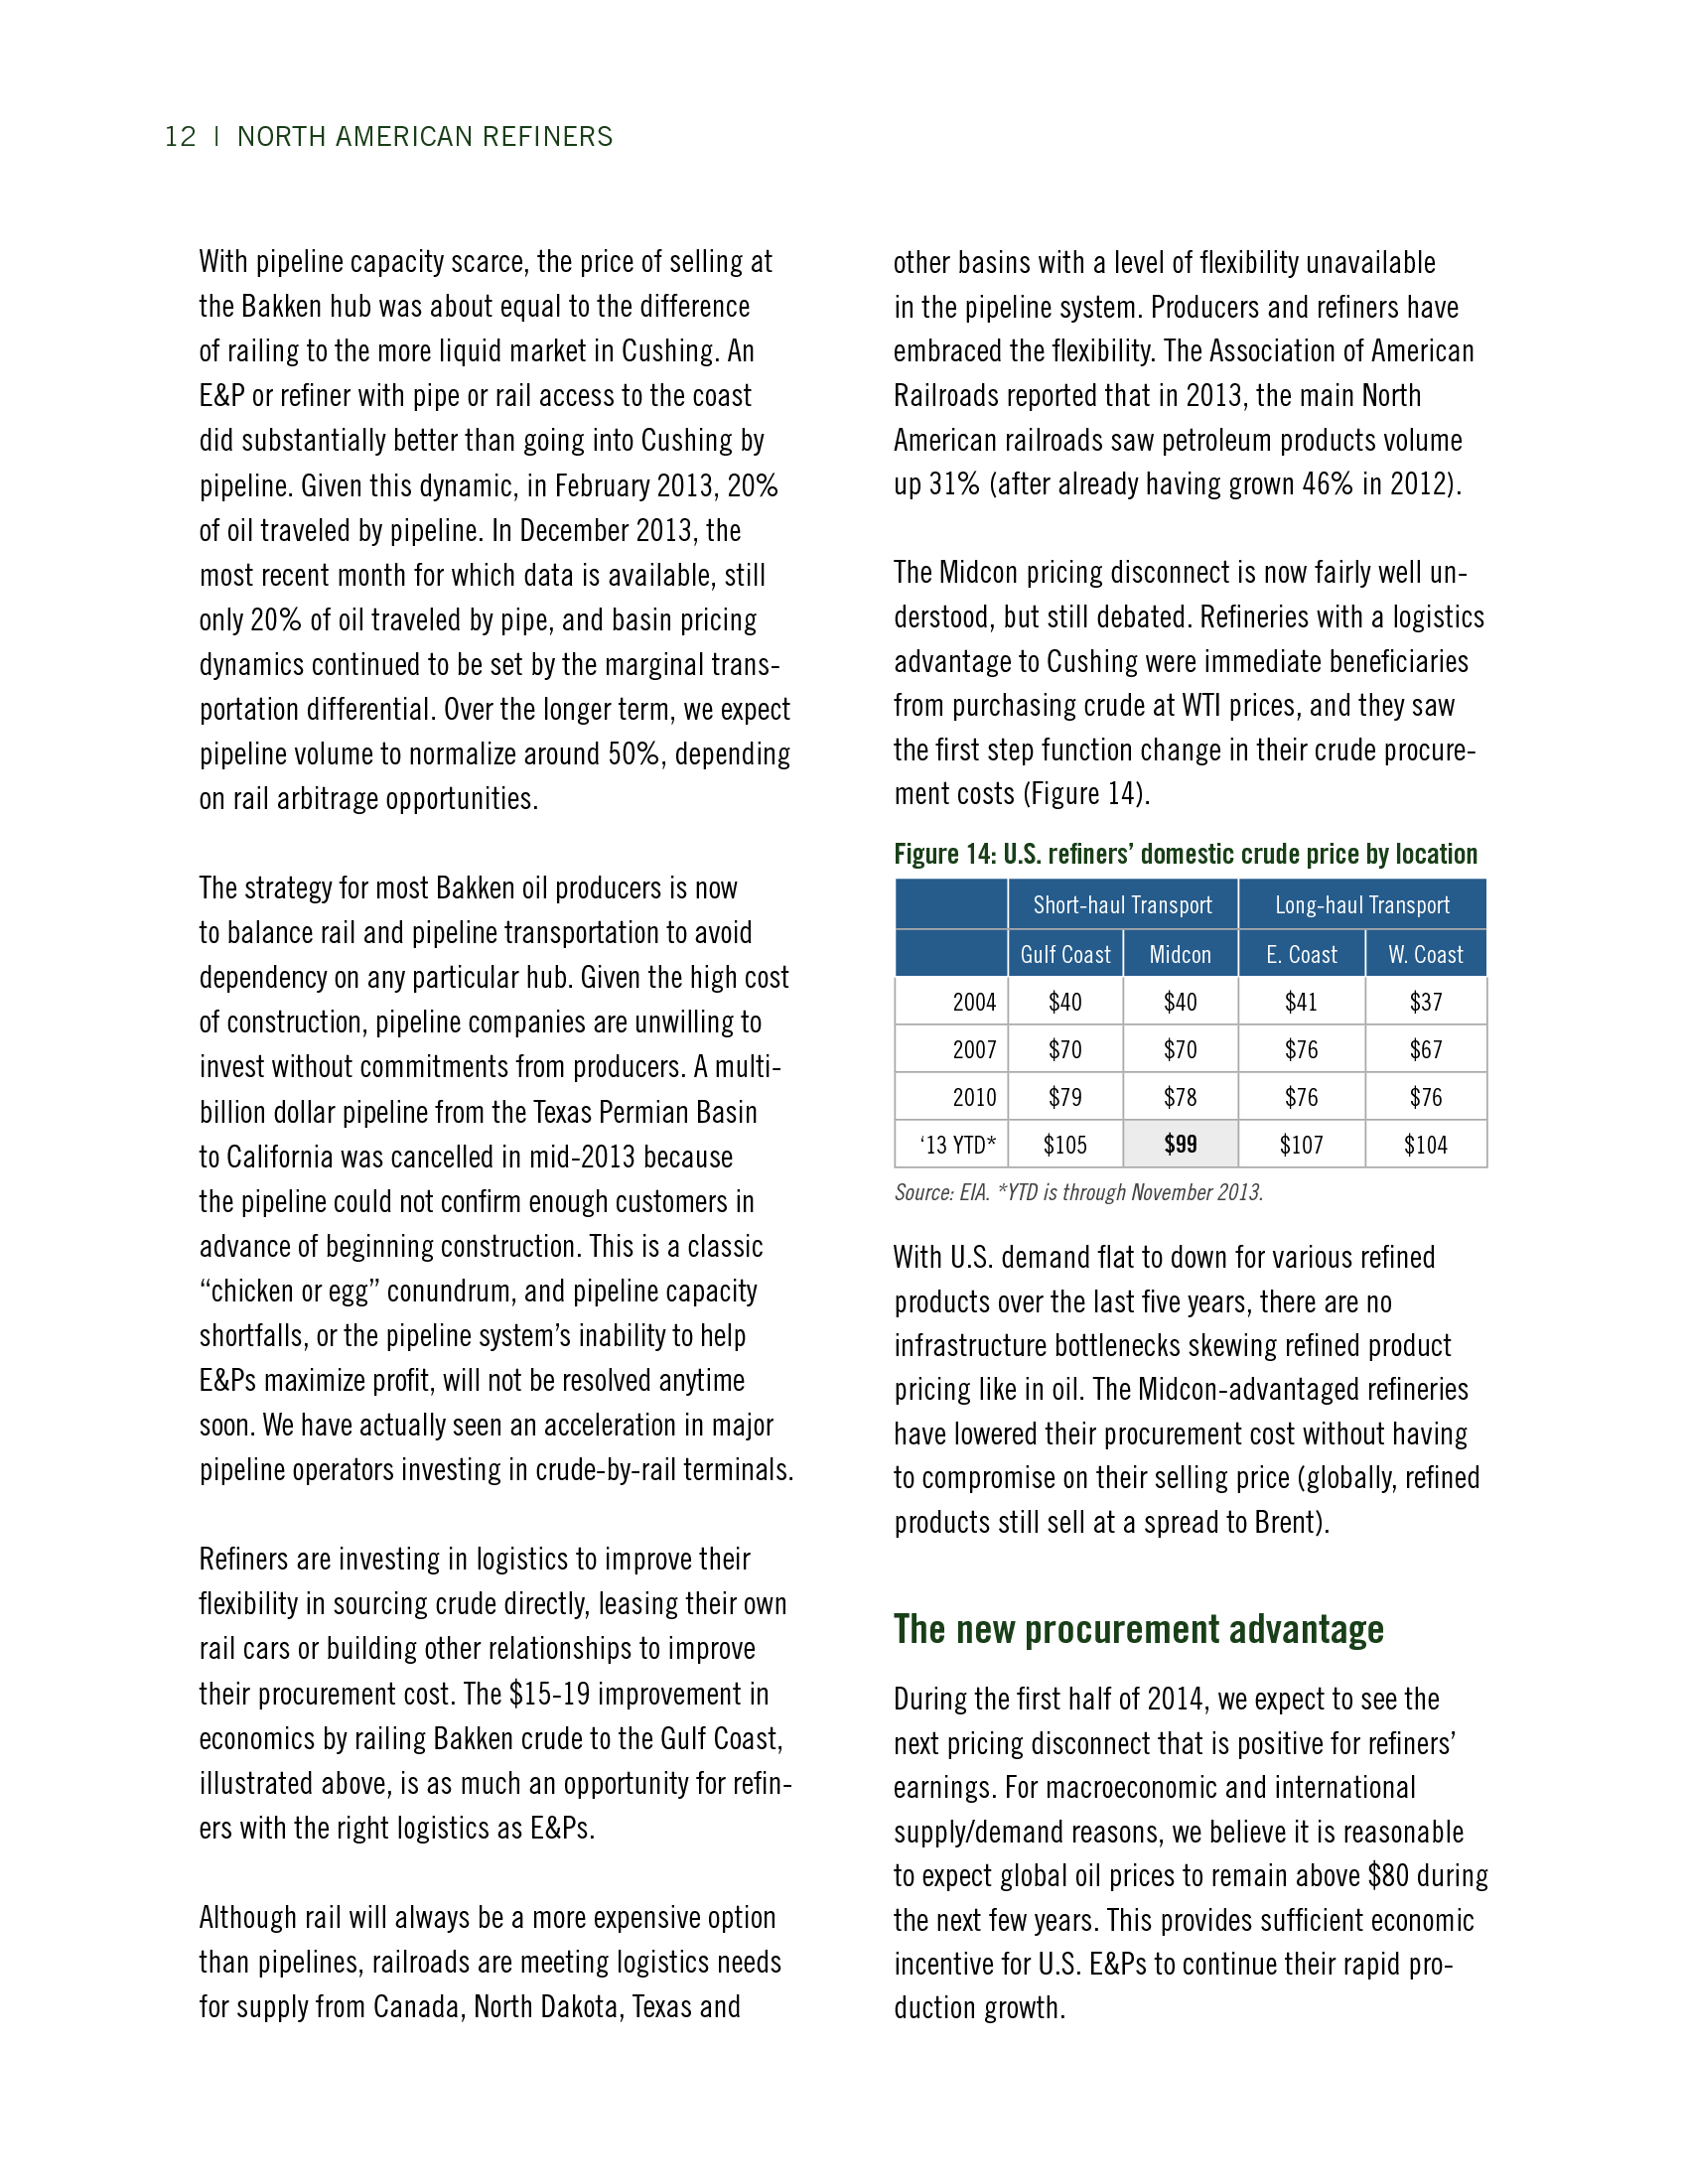
 International equities started the year strong with emerging
12.03%
markets leading developed markets.
25.41%
20.07%
 Recent emerging market strength pushed trailing year returns
17.56%
above many U.S. indices and widened the relative performance
14.70%
gap with EAFE.
49.63%
Rates, Currency, and Commodities
12/31/2016
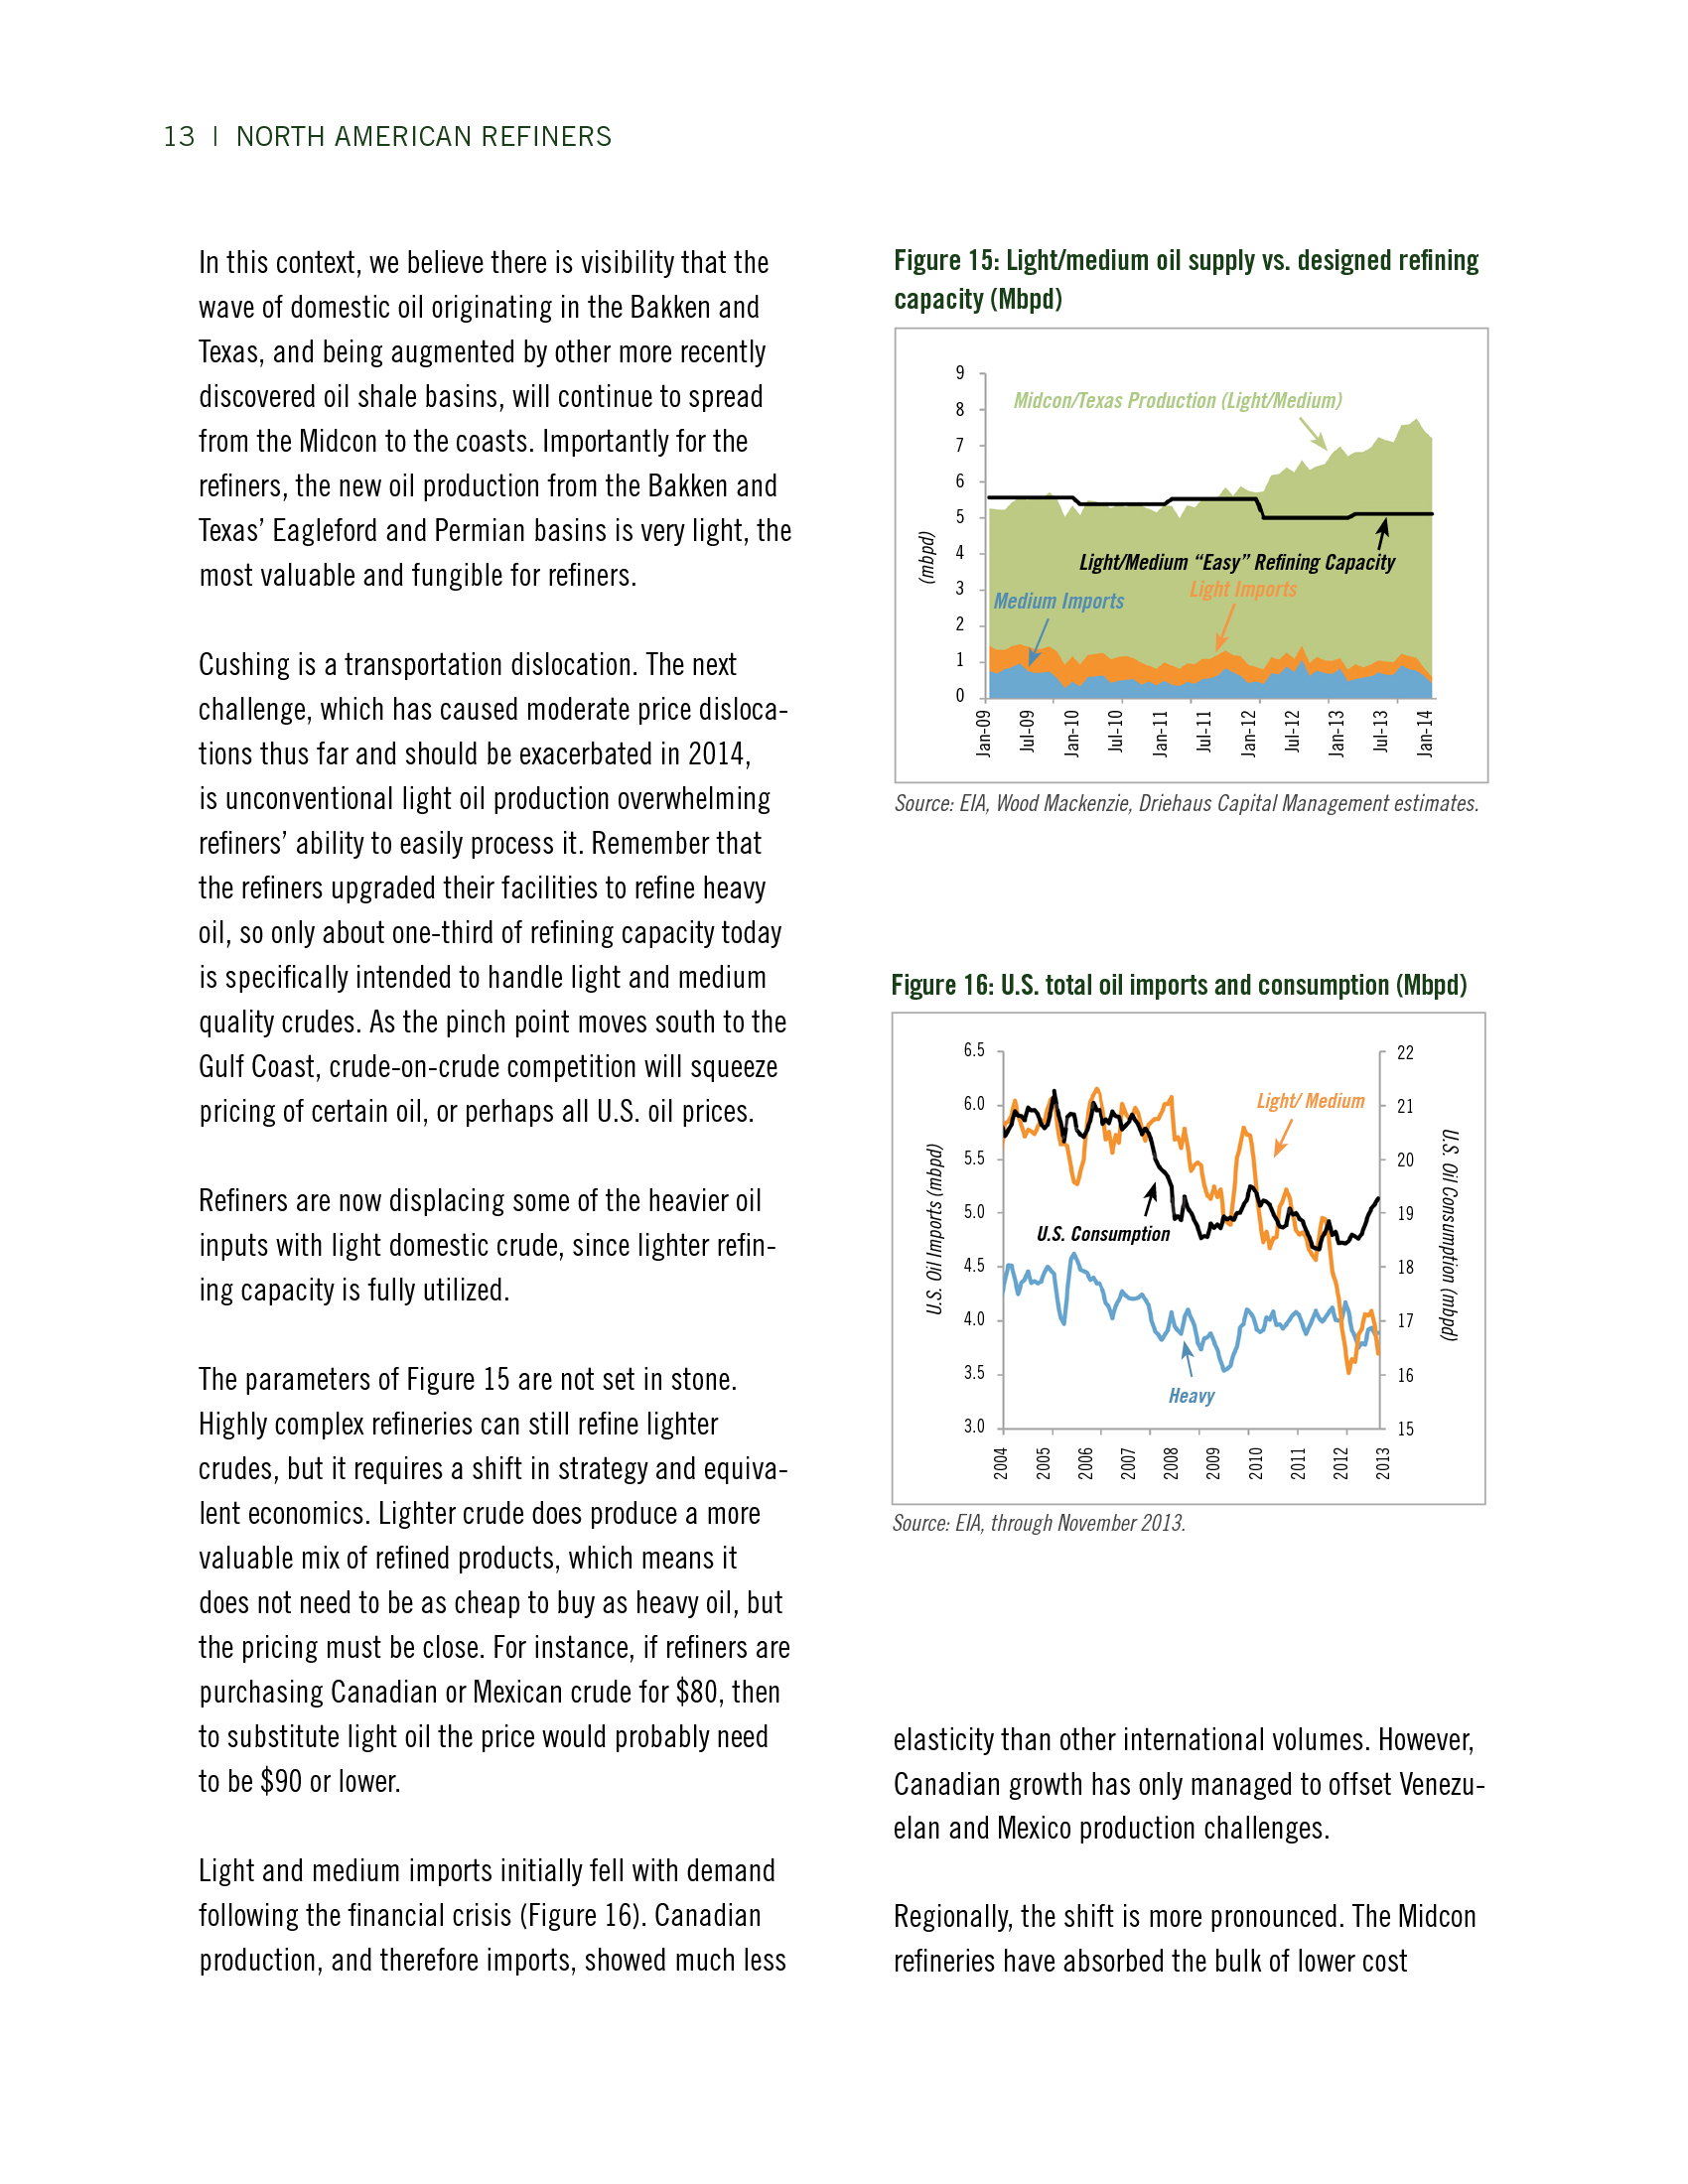
 Interest rates remained unchanged in January as yield spreads
1.22%
tightened slightly between Treasuries and corporate bonds.
2.49%
3.72%
123
$1,152
$53.70
 Despite little change in bond yields in the first month of the year,
the Fed is expected to raise interest rates 2-3 times in 2017.
U.S Economy
Unemployment Rate (Nov.)
Employment Participation
Core CPI (2)
Leading Economic Indicators
12/31/2015 12/31/2016
4.8%
4.7%
62.9%
62.7%
2.11%
2.29%
125.2
125.1
(1) Y ie ld s p re a d is B B B c o rp o ra te yie ld min u s 10 -ye a r US Tre a s u ry yie ld .
Chart Sources: Russell, S&P, FactSet, Barclays, CRB, MSCI. BEA
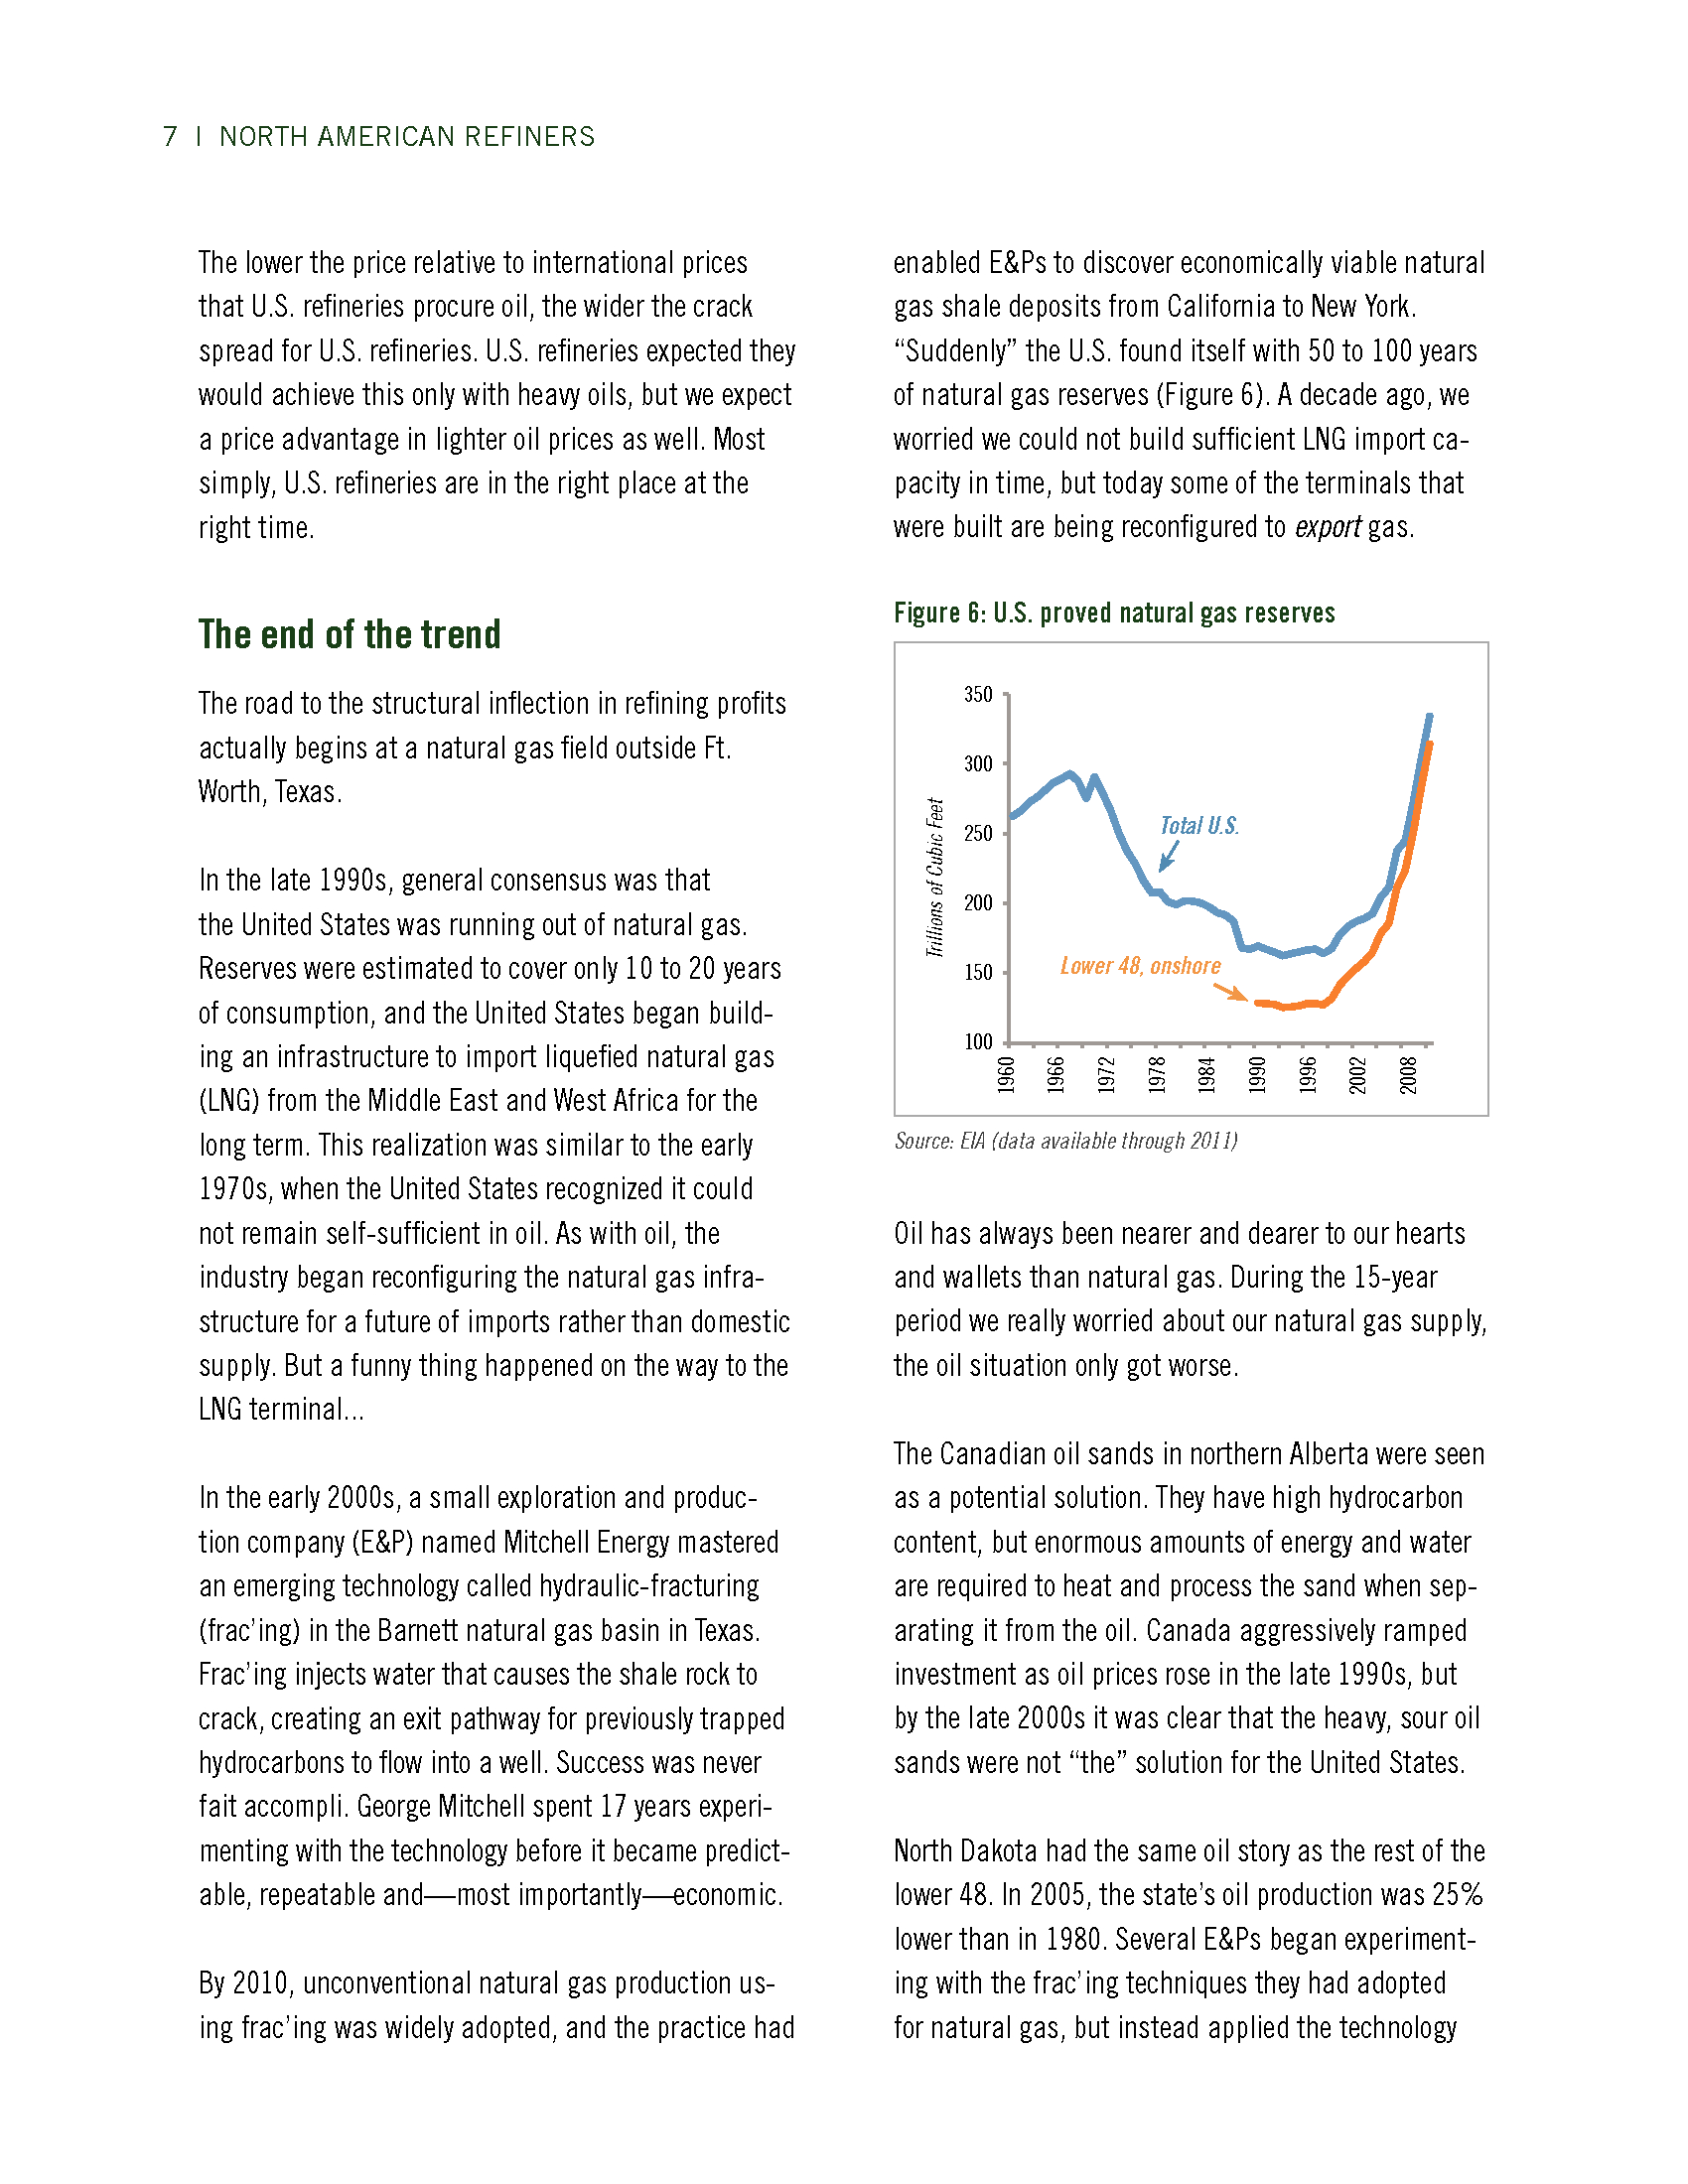
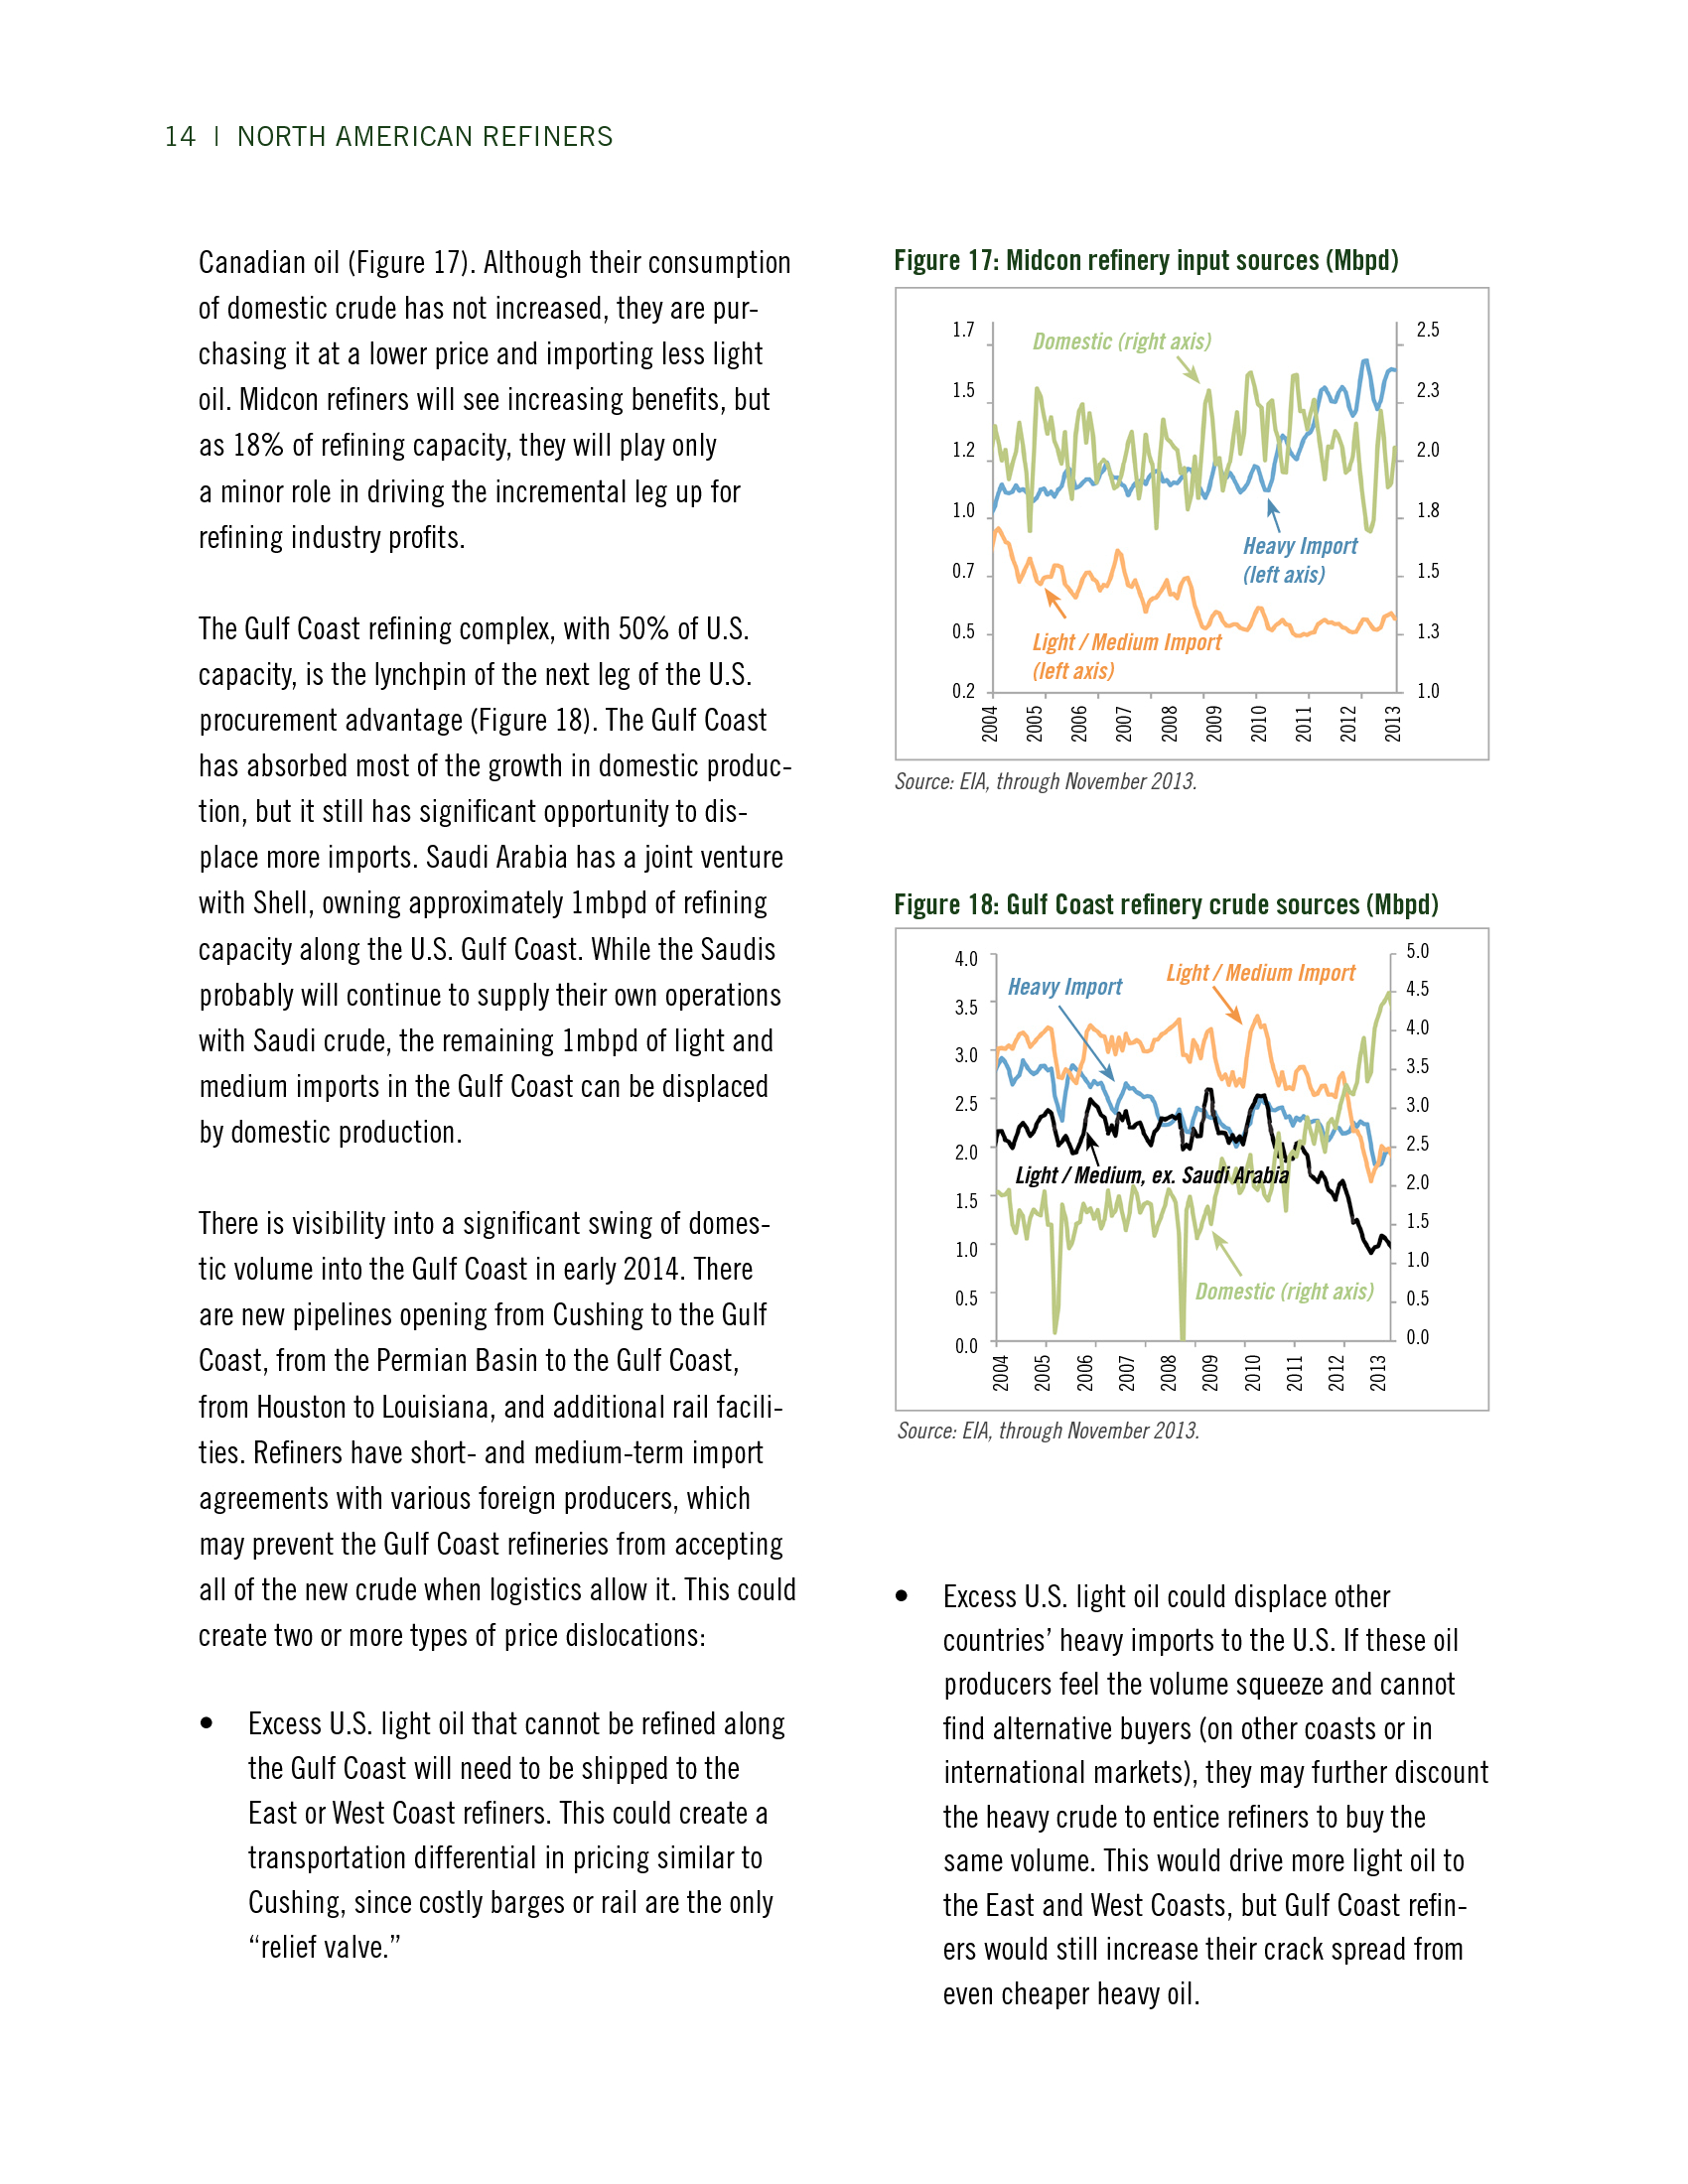
 Economic data continues to show gradual improve. Although
the unemployment rate ticked higher in January, an increase in
the labor participation rate indicates that confidence is rising that
future job growth is expected in 2017.
(2) Core CPI re fle c ts most re c e nt trailing 12 months.
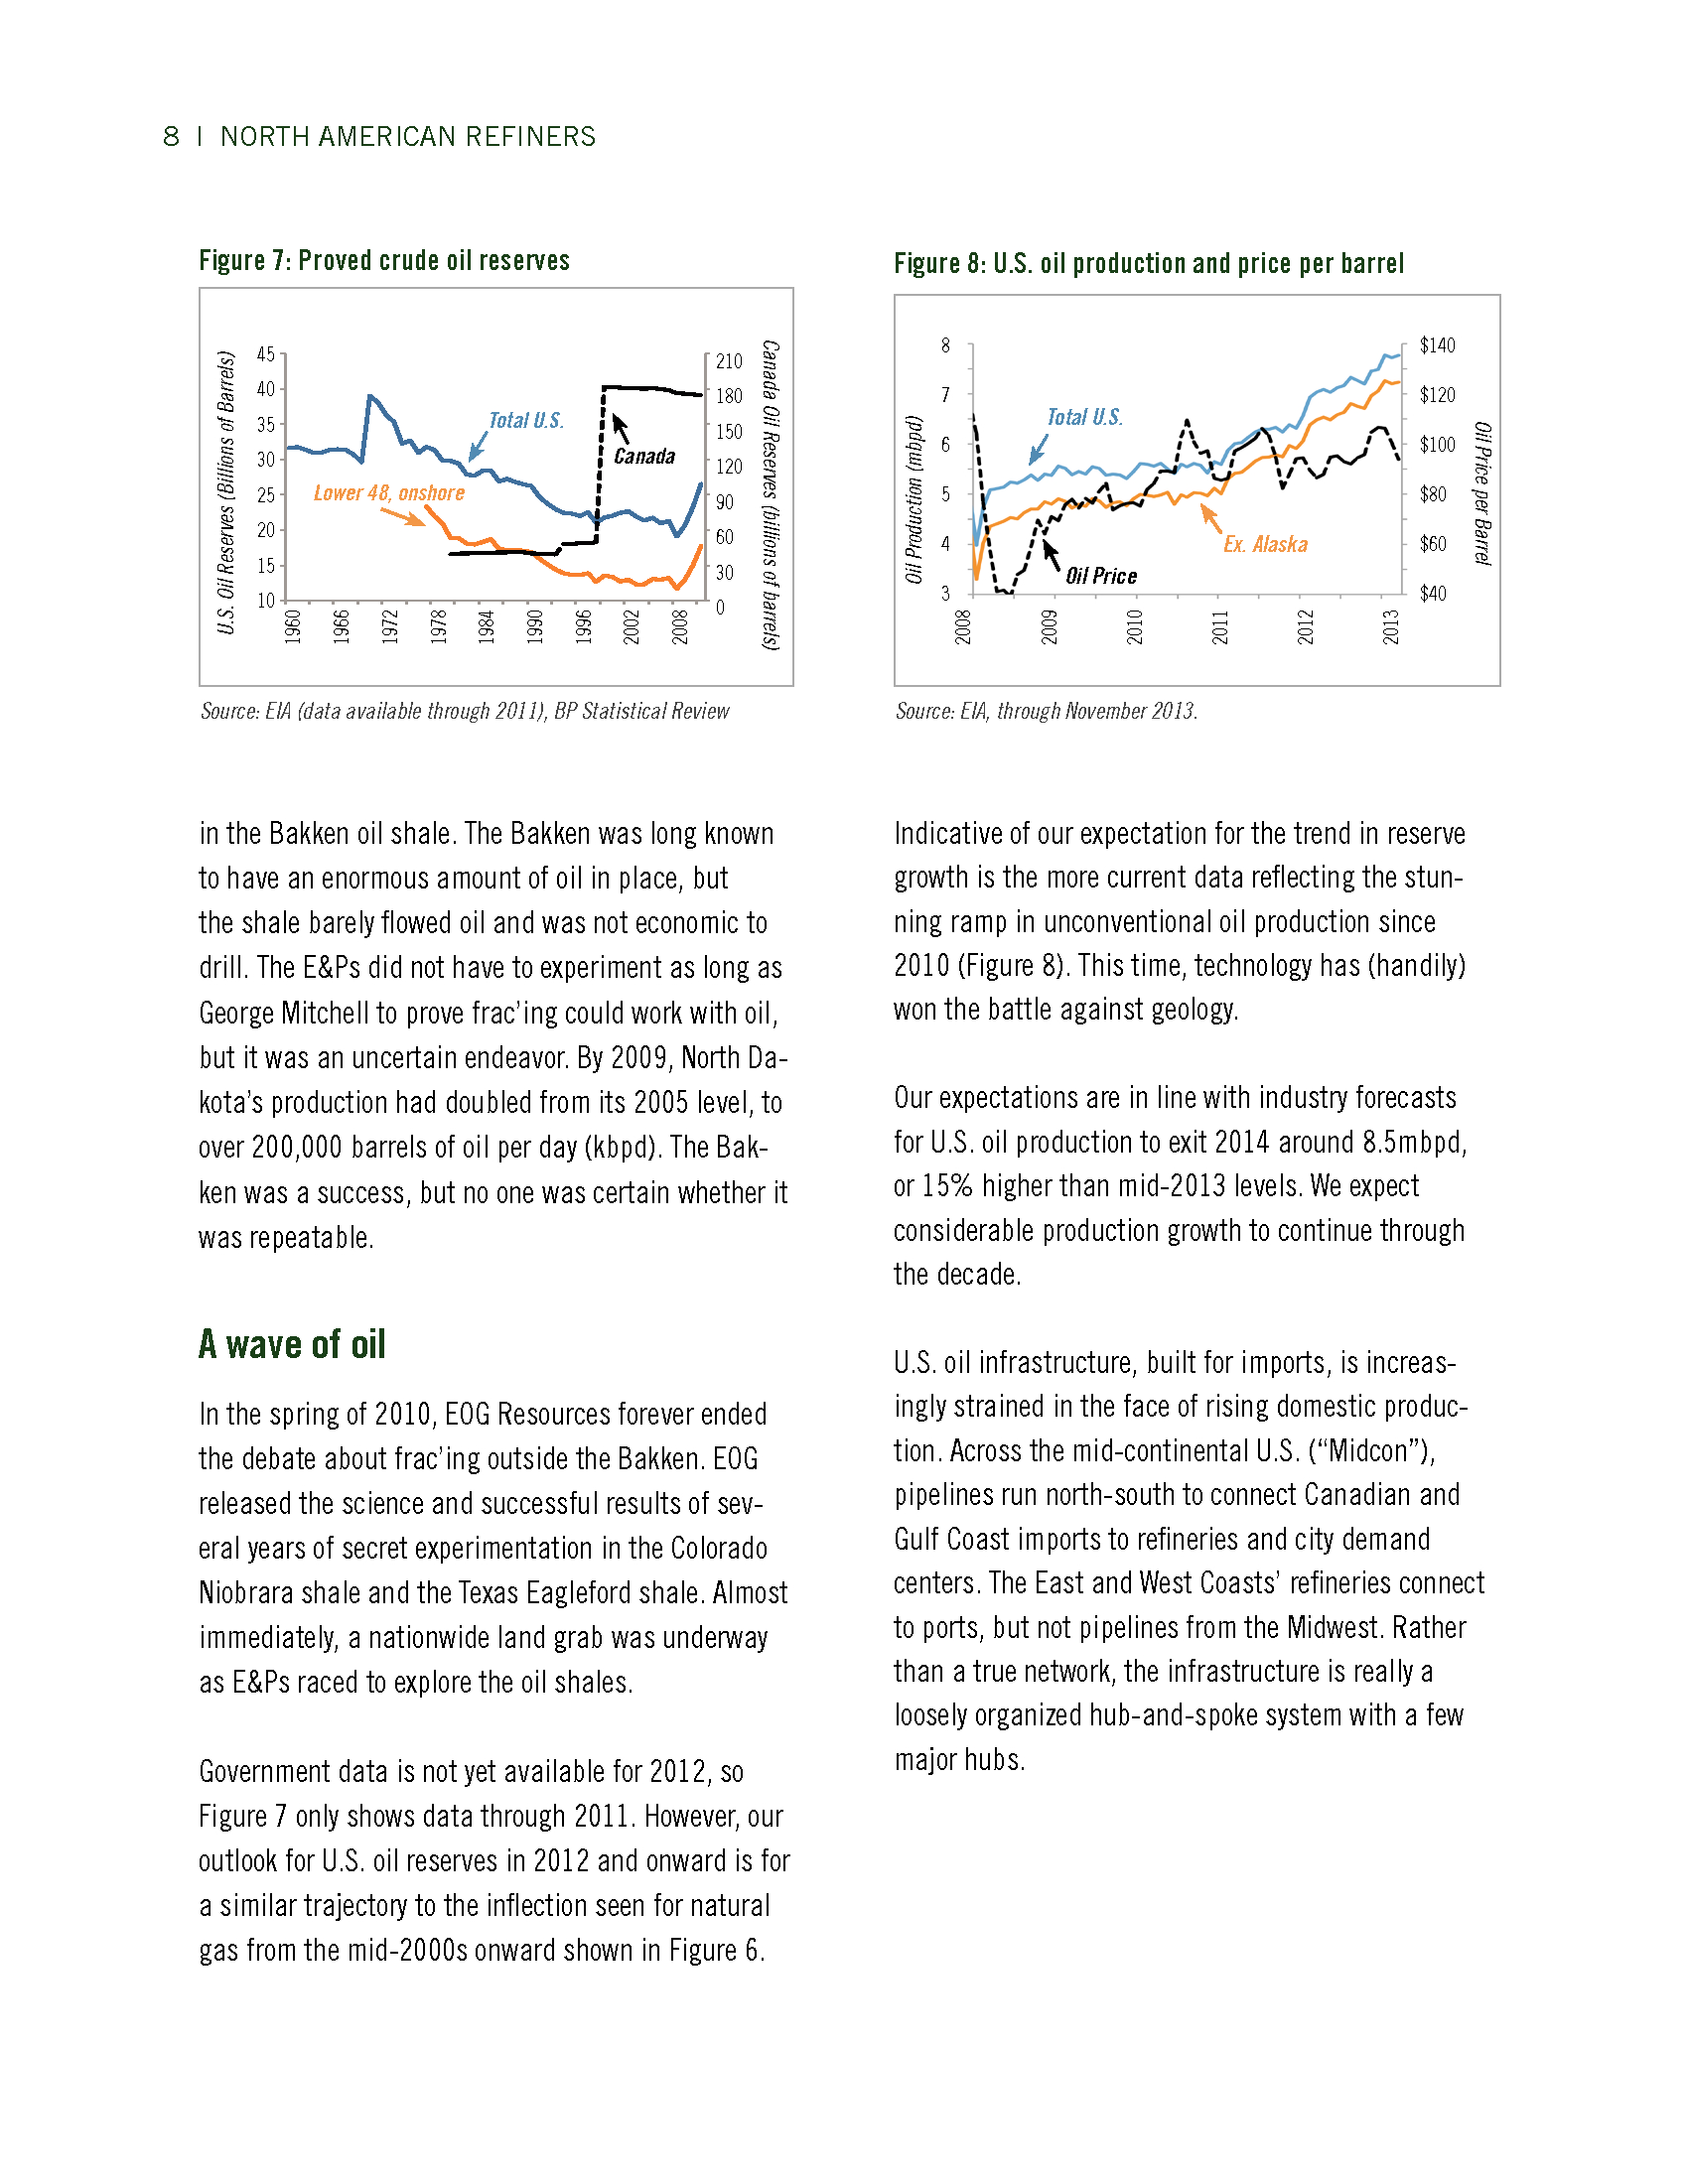
Core CPI e xc lude s food and e ne rgy pric e s. 2 . Major Market Returns One Year Ending January 31, 2017 -10% 0% 10% 20% Russell Mega 50 30% 40% 50% Russell 2000 CRB Index 15.8% 44.6% Gold 8.5% 10.3% 9.5% 7.9% 0.7% Oil Gold 1.4% -10.3% -11.2% -1.0% Barclays 1-10 Municipal -0.4% 15% 10.9% MSCI EM 25.4% Oil 10% 11.0% EAFE 12.0% CRB Index 5% Russell 2000 33.5% MSCI EM 0% Russell MidCap 24.7% EAFE -5% Russell 3000 21.7% Russell MidCap -10% S&P 500 20.0% Russell 3000 -15% Russell Mega 50 16.9% S&P 500 Barclays 1-10 Municipal Three Years Ending January 31, 2017 2.2% 1.9% Barclays GCI 1.1% Barclays GCI Barclays Aggregate 1.5% Barclays Aggregate 2.6% Barclays Interm. Credit 2.7% MBS Index 2.5% Barclays Interm. Credit MBS Index 3.4% 0.3%  U.S. equity markets rose significantly over the past year with small caps outpacing large caps.
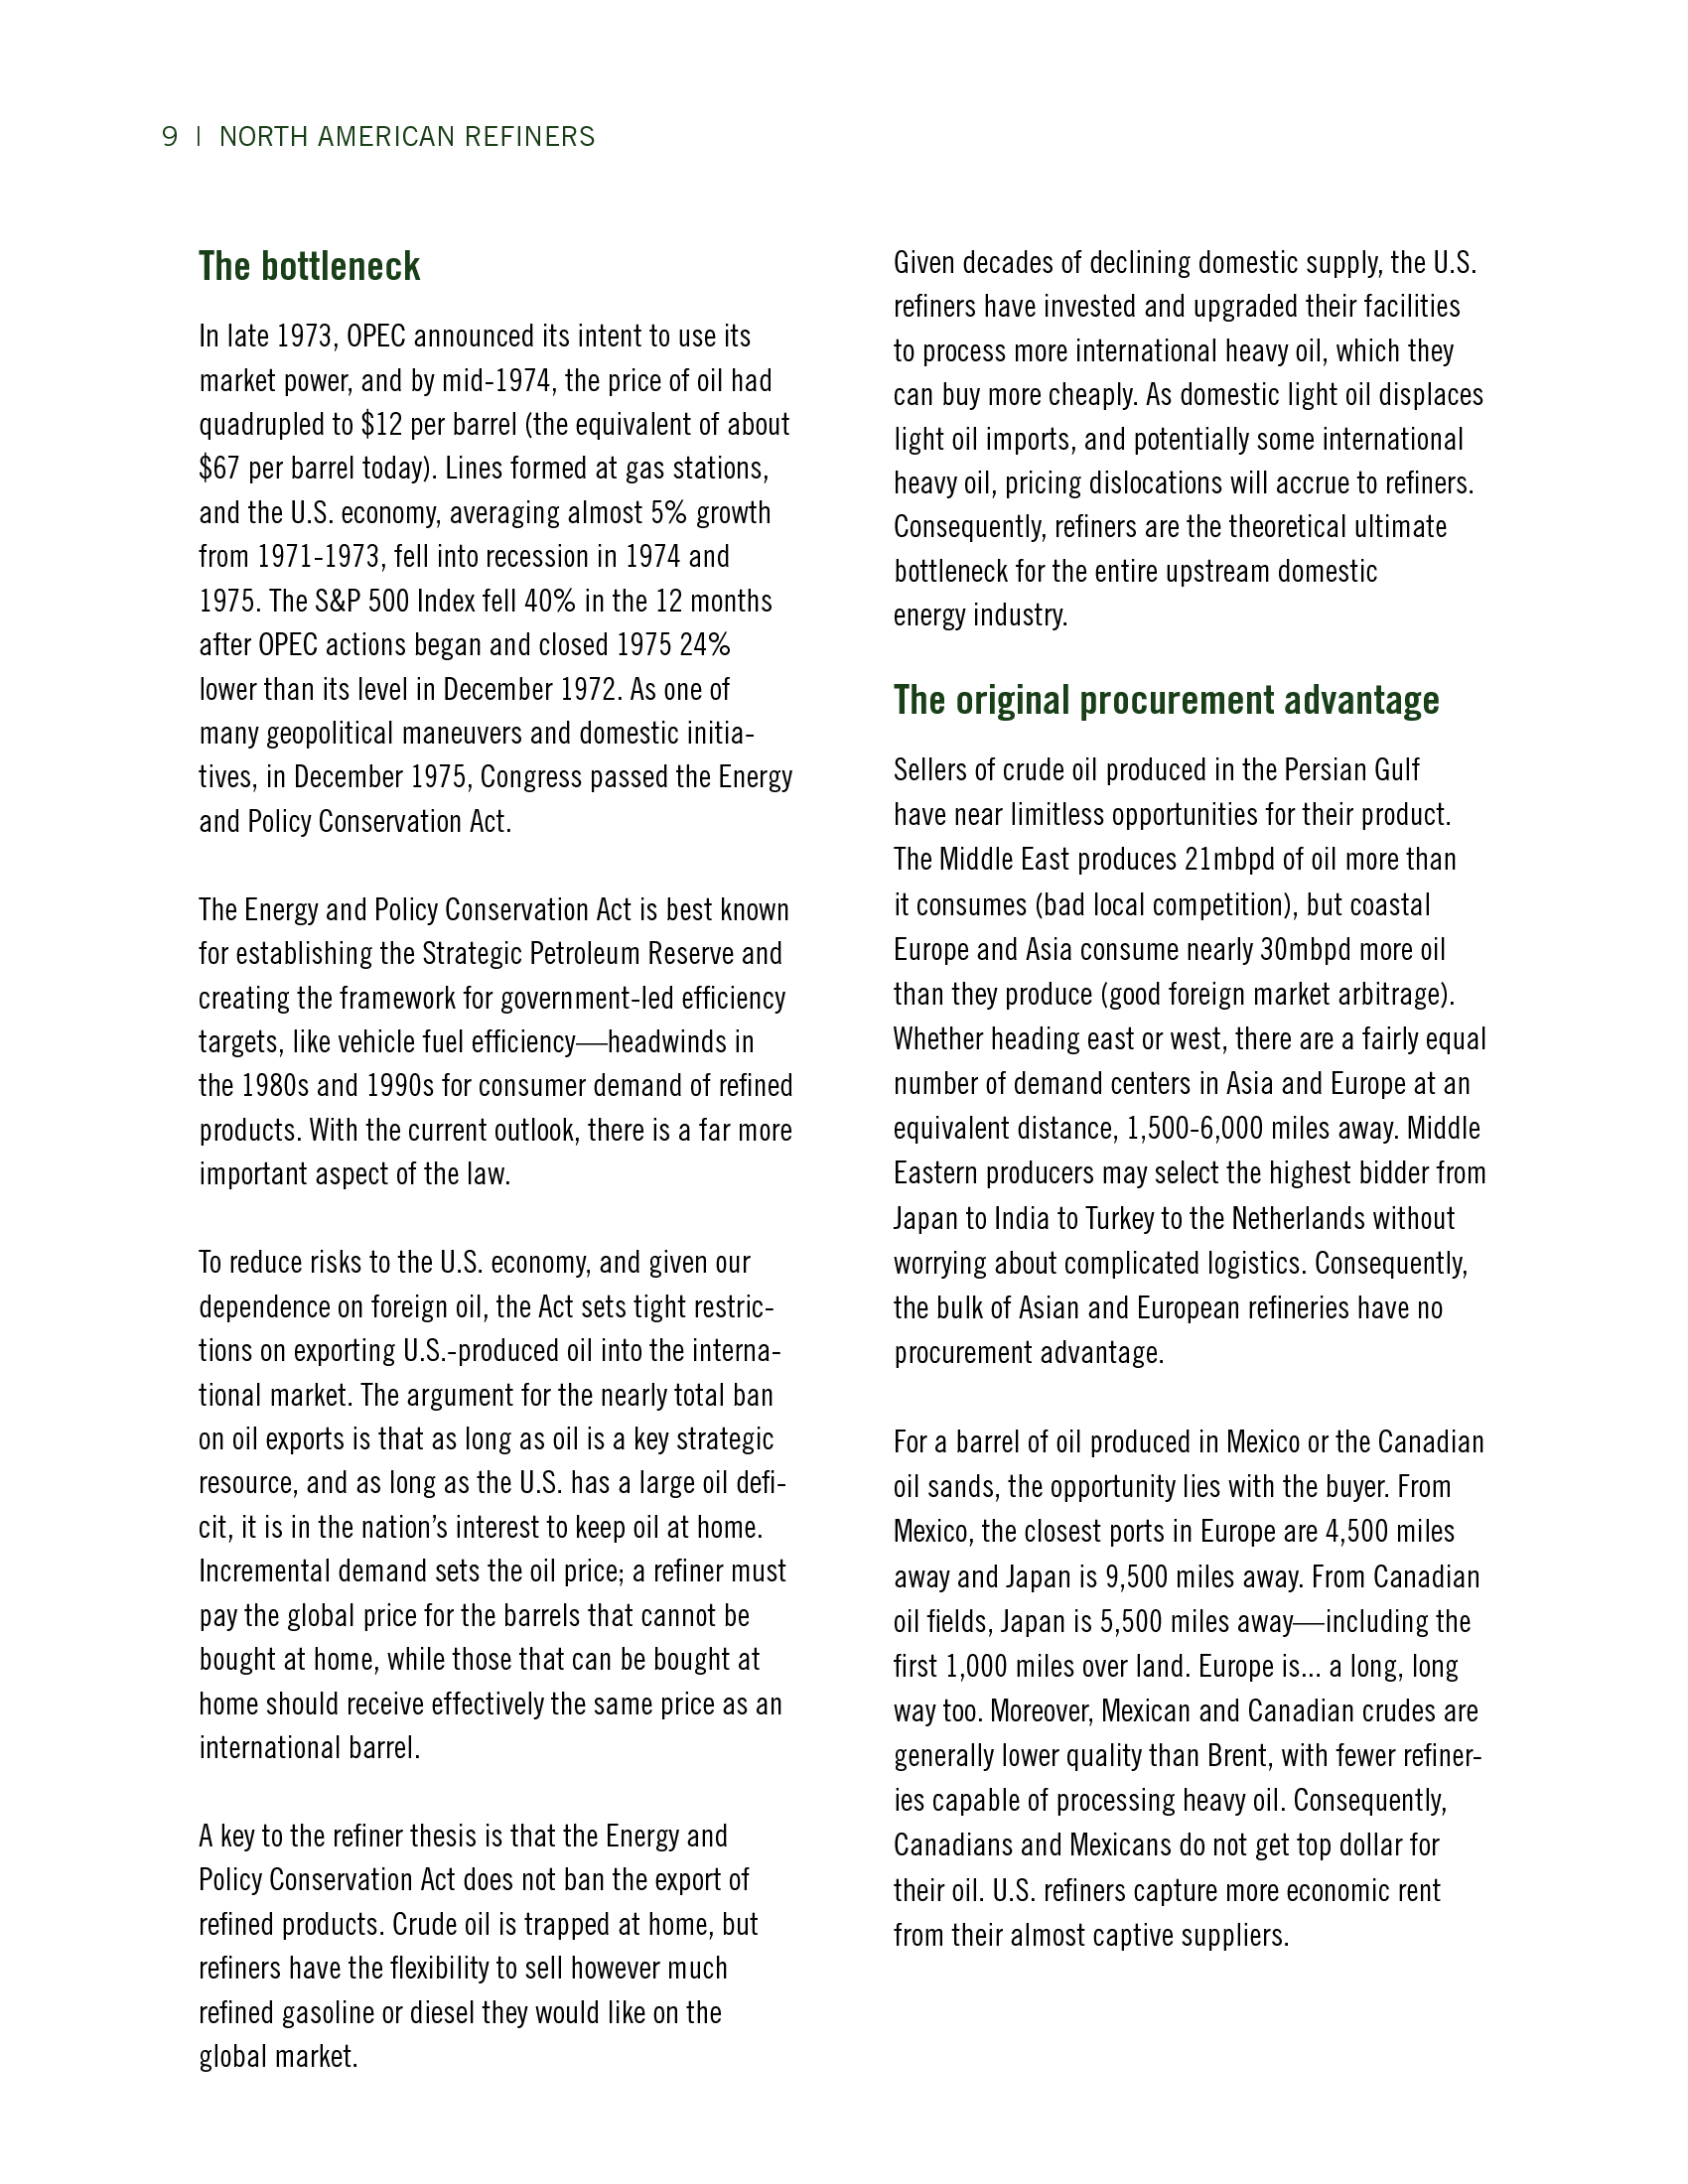
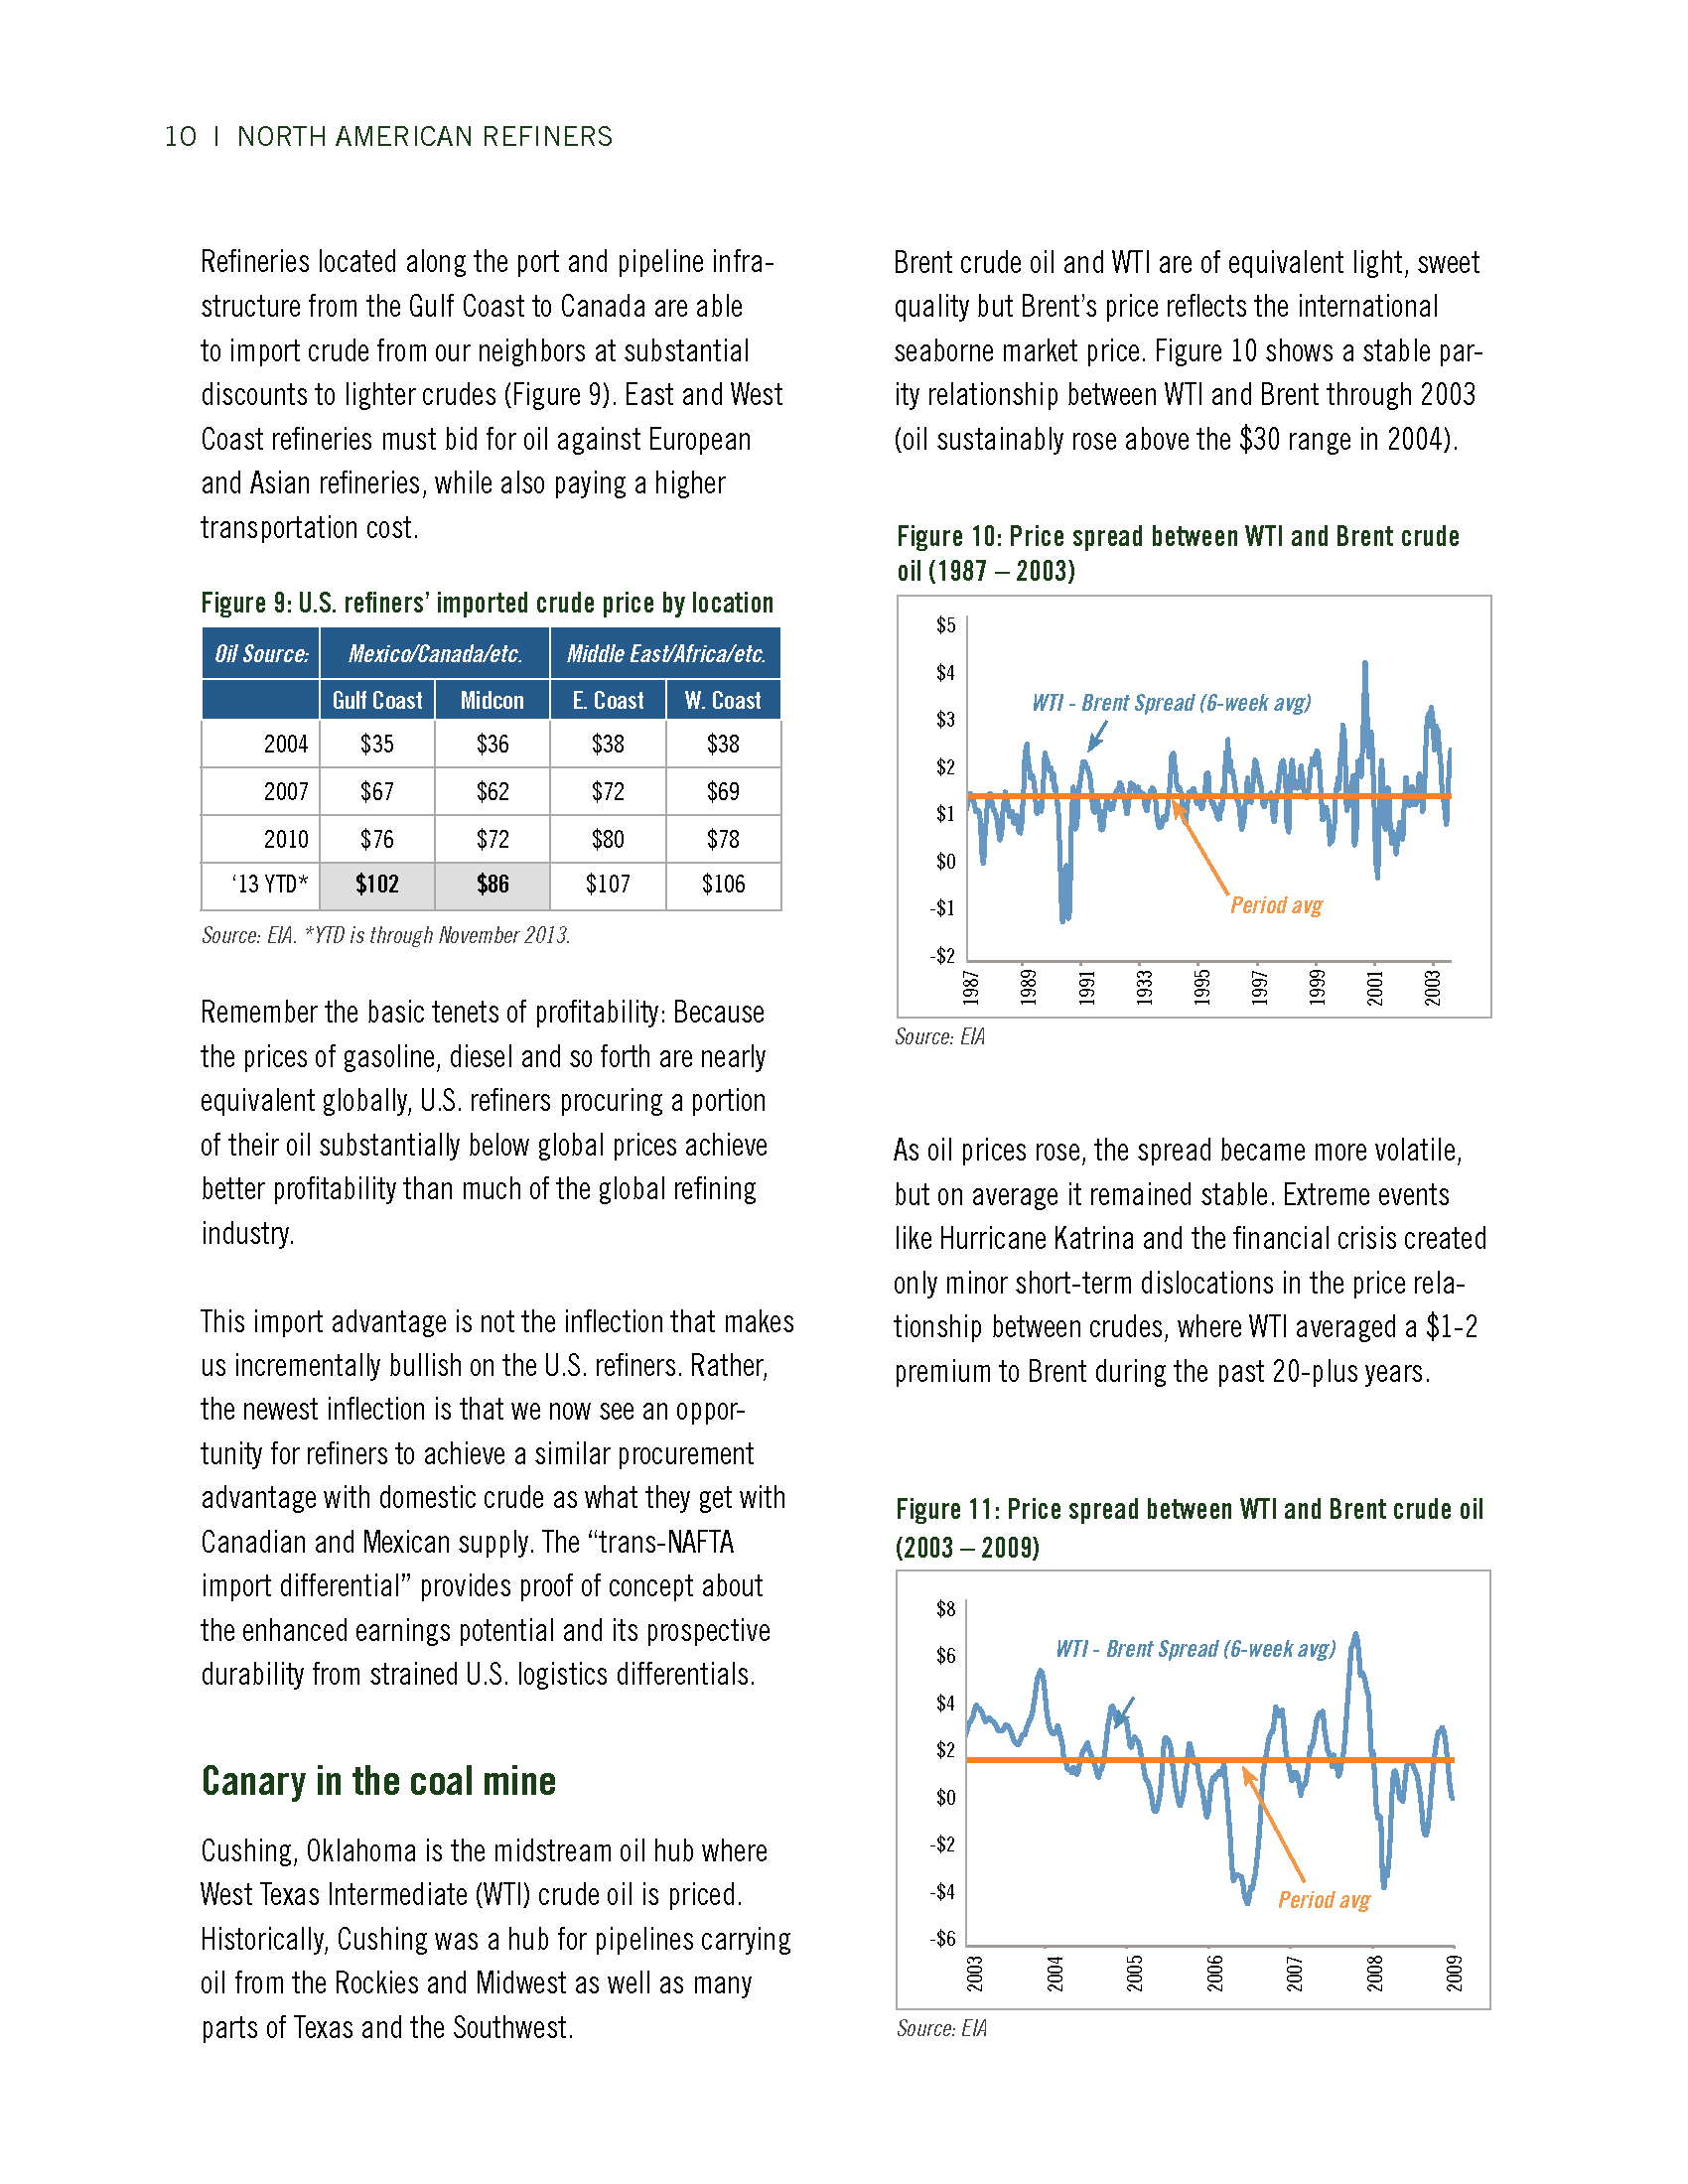
Despite the market’s recent small cap bias, large caps have outperformed over the past three years.  International stocks have significantly underperformed domestic equities over the past three years; however, emerging markets have rallied over the past year to keep pace with U.S. stocks.  The recent upward move in interest rates has caused bonds to weaken – however, returns remain in positive territory for the three year period. 3 Sources: Russell, S&P, Barclays, FactSet, MSCI . The “Trump Effect” Russell 3000 Sector Returns November 8, 2016 - January 31, 2017 Major Market Returns November 8, 2016 - January 31, 2017 S&P 500 Financials 6.5% 16.6% Materials Russell Mid Cap 12.0% 8.2% Industrials Russell 2000 10.9% 14.0% Telecom Services EAFE Consumer Discr. 5.1% Emerging Markets 1.2% Barclays 1-10 Muni 10.2% Technology 4.9% Energy -1.3% Barclays GCI 10.3% -1.4% 7.5% Russell 3000 7.2% Healthcare Barclays Aggregate 5.0% -2.0% Real Estate Oil Gold 16.4% -4.7% Utilities Consumer Staples 3.6% 1.7% 1.4%  The unexpected election of Donald Trump as president sent the equity markets soaring with small caps and economically-sensitive stocks performing the best.  Fixed income markets declined as interest rates jumped on rising confidence that economic growth will improve and the Fed will resume interest rate hikes in 2017. 4 . 2017: The Year of Transition Year of Transition Major Shifts in 2017 From: To: Economic Growth Stimulus driven by monetary policy Stimulus driven by fiscal spending Fears of stagnation and deflation Improving growth and rising inflation Rising regulation Declining regulations "Macro" themes (broad-based growth) "Micro" themes (rising competition) Global Forces Progressing towards globalization Rising nationalism and protectionism Entrenched political class Rise of populism Tolerance of currency manipulation Retribution for currency manipulation Investment Trends Focus on safety "Rising tide lifts all boats" "Winner takes all" Generational decline in interest rates  Higher appetite for risk Secular rise in interest rates In 2016, significant economic and political shifts occurred across Europe, the Middle East, Asia, and the U.S. These global events will result in 2017 being a year of major transition. 5 . Market Leadership: Year-Over-Year Returns +50 Stocks vs. Bonds Year-Over-Year Change S&P 500 vs. Barclays Aggregate +40 +30 +20 (%) +10 + +10 +20 +30 Barclays Aggregate Outperforms +40 S&P 500 Outperforms +50 +40 1987 1989 1990 1991 1992 1994 1995 1996 1997 1999 2000 2001 2002 2004 2005 2006 2007 2009 2010 2011 2012 2014 2015 2016 Large Cap vs. Small Cap Year-Over-Year Change in S&P 500 vs.
Russell 2000 Russell 2000 Outperforms +30 S&P 500 Outperforms +20 (%) +10 + +10 +20 +30 +40  Stock returns relative to bonds diverge dramatically over market cycles. The equity rally over the past three months created significant return dispersion in stocks versus bonds on a year-over-year basis. This further supports the benefits of asset class diversification.  There can be significant dispersion of returns within U.S. equity markets which is why we believe in equity asset class diversification. After a prolonged period small cap stocks have significantly outperformed large caps over the past three months– pushing year-over-year results in favor of small caps. 1987 1989 1990 1991 1992 1994 1995 1996 1997 1999 2000 2001 2002 2004 2005 2006 2007 2009 2010 2011 2012 2014 2015 2016 Source for both charts: eVestment Analytics. 6 .
Long Term Market Returns Long Term Asset Class Returns Ending January 31, 2017 20% 5 Year Return 10 Year Return 15% 10% 5% 0% -5% -10% -15% Russell Mega 50 S&P 500 Russell 3000 U.S Equity Russell MidCap Russell 2000 EAFE - Developed MSCI EM CRB Index Developed Small Cap International Oil Commodities Gold Barclays 110 Muni Barclays GCI Barclays Aggregate Barclays Interm. Credit MBS Index Fixed Income  Despite volatility, long term rates of return for financial assets have been positive – however, commodity prices have declined.  Annual compounded returns for equities over the trailing ten years are solidly in positive territory, despite the more than 50% market drop during the financial crisis of 2008-2009 – further supporting a focus on the long term. Source: FactSet 7 . Equity Market Volatility Over the Past Decade S&P 500 12/31/06 - 1/31/17 2500 Standard Deviation of Daily Returns 2300 0.89% 1.00% 0.49% 0.50% 2100 “Taper Tantrum” S&P Downgrades US Debt” Dec. 1990 - Apr. 2009 Mar. 2009 Dec.
2016 “Flash Crash” Unemployment rate tops 10% -19.3% 1500 -11.4% “Brexit” -11.4% Oil Hits $25/barrel -15.7% 1300 1100 +241% Russia Annexes Crimea - 57% Sep-16 Dec-16 Jun-16 Dec-15 Mar-16 Jun-15 Dec-14 Mar-15 Jun-14 Sep-14 Mar-14 Sep-13 Dec-13 Jun-13 Mar-13 Sep-12 Dec-12 Jun-12 Mar-12 Sep-11 Jun-11 Jun-10 Sep-10 Dec-09 Mar-10 Jun-09 Sep-09 Dec-08 Mar-09 Sep-08 Jun-08 Mar-08 Sep-07 Dec-07 Jun-07 Mar-07 Dec-10 Japanese Earthquake European Debt Crisis Dec-06 Greek Debt Crisis Intensifies Dec-11 700 Mar-11 900 China Drops Growth Rate Targets to Single Digits Sep-15 1700 500 -15.2% -12.7% -10.1% Benghazi 0.00% 1900 U.S. Elections E.U. Falls into Recession  The past decade has been filled with economic and political challenges – however, stock prices have more than tripled from their low point in the first quarter of 2009.  These market gains have been accompanied by extreme volatility with seven corrections greater than 10% in the past seven years, and daily volatility that far exceeds historic norms. Source: FactSet 8 .
Global Equity Market Returns Trailing 12 Months Ending January 31, 2017 Euro-Zone* Russia 10.2% Canada 55.8% *Eurozone comprised of 17 countries that use the Euro as its currency. Largest constituents include Germany, France and Italy. 32.5% China 23.5% U.K. U.S. Japan 7.7% 15.7% 20.0% Hong Kong Mexico 21.5% -3.9% Brazil India Australia 98.6% 10.5% 27.0% Source: S&P; MSCI  International equity markets over the past year experienced dramatic dispersion relative to U.S. stocks – many emerging markets have bounced back from their “bear market” levels over the last 12-18 months.  Global markets continue to confront political and economic uncertainty – this should push volatility higher. Source: Bloomberg 9 . Global Perspective Global Market Capitalization Breakdown (U.S. vs. Non-U.S.) 1970 U.S. Global GDP and Corporate Location (U.S. vs.
Non-U.S.) 2016* U.S. Non-U.S. Percentage of Global GDP Non-U.S. U.S. 69% 78% 42% Source: International Monetary Fund (IMF), Russell Investments * Preliminary 26% 74%  International economies represent two-thirds of global GDP with the majority of publicly traded companies based outside of the U.S. Year-Over-Year Relative Performance EAFE vs. Emerging Markets Year-Over-Year Relative Performance EAFE vs. S&P 500 12/31/88 – 1/31/17 12/31/88 – 1/31/17 +60 +30 +40 +20 +20 (%) +10 (%) Non-U.S. Source: International Monetary Fund (IMF), MSCI for most recent period ending 12/31/15  International markets continue to grow with over half of the world’s market capitalization traded outside of the U.S. +40 U.S. Non-U.S. 22% 58% 31% Publicly Traded Companies by Location + + +20 +40 +30 +60 +40 +80 EAFE Outperforms S&P 500 Outperforms Source: eVestment  International markets move in cycles with periods of underperformance  versus U.S.
markets followed by periods of outperformance. 1988 1989 1990 1991 1992 1993 1993 1994 1995 1996 1997 1998 1998 1999 2000 2001 2002 2003 2003 2004 2005 2006 2007 2008 2008 2009 2010 2011 2012 2013 2013 2014 2015 2016 +20 1988 1989 1990 1991 1992 1993 1993 1994 1995 1996 1997 1998 1998 1999 2000 2001 2002 2003 2003 2004 2005 2006 2007 2008 2008 2009 2010 2011 2012 2013 2013 2014 2015 2016 +10 Emerging Markets Outperform EAFE Outperforms Source: eVestment Emerging Markets have a performance advantage over developed economies due to higher growth rates – however, there are prolonged periods where developed markets generate higher returns. 10 . Fixed Income Markets: Trailing 12 Months 10 Year Treasury Spread vs. BBB As of 1/31/17 7.0%  The BBB-rated corporate yield versus Treasuries continues to narrow with the spread dropping from 200 basis points last summer to 123 at the end of January. 6.0% 5.0% 4.0% 3.0% 2.0% 1.0% 0.0% Source: Bloomberg; Barclays Capital Treasury Yield Curve  The yield curve has flattened over the past year as short term rates have drifted marginally higher while long term rates have declined. As of 1/31/17 3.50 1/31/17 Yield (%) 3.00 One Month Ago 2.50 One Year Ago 2.00  The 10 year Treasury bond yield closed January at 2.49% - up dramatically from last summer’s record low of 1.40% 1.50 1.00 0.50 0.00 3 Month Source: FactSet 6 Month 1 Year 2 Year 5 Year 7 Year 10 Year 30 Year 11 . Our Current Market View and Strategy U.S. Equity Markets International Equity Markets Fixed Income Markets Strengths Strengths Strengths  Economic growth is expected to be positive with possible upside to expectations with the new administration's policies.  Valuations are historically high – but not at historic extremes.  Corporate balance sheets are very strong – high cash and low debt levels – leading to aggressive share buybacks, dividend increases, and rising M&A activity.  U.S. markets continue to be viewed globally as a safe haven with strong fundamentals.  Long term rolling returns are below historic norms.  Unique investment opportunities in various regions exist as non-U.S. markets now represent over 50% of global capitalization – our emphasis is currently on developed markets vs.
emerging markets.  Changes to monetary policy through the Fed’s interest rate policies is expected to be gradual over the next year. Concerns  Global growth concerns are expected to persist – especially in international markets.  Uncertainty over the impact of new trade and tax policies anticipated by the new administration.  Uncertainty over the timing and pace of the Fed’s shift in monetary policy in 2017.  Geopolitical risk - especially with recent developments in Iraq and Syria, and continuation of uncertainty in Russian Mid East policy. We are positive on the long-term outlook for U.S. equities. We expect positive earnings growth, low inflation, and strong corporate balance sheets will help stocks move higher over the next several years. In addition, the U.S.’s position as a global economic leader should continue to attract capital.
Capital markets will also benefit from rising M&A activity and additional share buyback programs. The pro-business shift in Washington following the election adds opportunity for a boost in growth – however, uncertainty will persist. We expect significant volatility as issues are resolved around fiscal and monetary policy – and global growth expectations.  Expect higher than U.S. growth in many non-U.S. economies – primarily emerging markets - over the next three to five years.  Recent underperformance versus the U.S.
has improved relative valuations in many international markets. Concerns  Dislocation in markets is a risk with recent political events such as “Brexit” and the Trump victory leading to concerns over protectionist sentiments and possible policy initiatives.  Emerging market growth expectations (especially in China) have slowed in recent quarters causing investor concerns and increased volatility in their equity markets.  Political, economic, social, and military unrest and uncertainty in Syria and throughout the Middle East. We want to have an active exposure to the international markets. We believe global economic and financial markets continue to be a cornerstone of a diversified portfolio. Our current bias is towards developed markets versus emerging markets. We are watching closely the impact on global markets of recent political shifts towards more protectionist policies.
Although this shift will create additional volatility, new opportunities may be presented to investors.  Corporate credit fundamentals are strong and improving.  Growing pressure to reduce government debt and spending.  Continued low inflationary pressures. Concerns  Persistently large budget deficits.  The Fed’s successful launch and execution of rate hikes over the next year.  Rising concerns over a possible uptick in inflation driven by improving economic conditions.  Risk associated with emerging market debt, China and India economic slowdown, and pervasive geopolitical unrest. We are positioning our portfolios more defensively by maintaining short to neutral maturity positions relative to benchmarks and focusing on higher coupon bonds. We believe the improving economy is expected to eventually put upward pressure on long term rates. We favor overweighting high quality corporate bonds relative to Treasury and Agency securities.
Our high quality bias is expected to provide enhanced liquidity during this transition period. Municipal bonds have been attractively priced relative to taxable securities for the past several years – however, recently that relationship has become more normalized. 12 . Historical U.S. GDP U.S. GDP Annual Growth Rate 8% 7% 6% 5% Median Annual GDP Growth 1980-2000 = 3.6% 4% Median Annual GDP Growth 2001-2015 = 1.9% 3% 2% 1% 0% -1% -2% -3% -4% 1981 1983 1985 1987 1989 1991 1993 1995 1997 1999 2001 2003 2005 2007 2009 2011 2013 2015  U.S. economic growth has been positive for the past six years; however the pace of growth has been below its long-term historic average since 2000.  GDP expansion in 2016 is expected to have generated full year growth of around 2.5% - primarily due to a stronger second half of the year.
If economic momentum continues and growth policies are implemented, 2017 growth is expected to be in the 2.75% - 3.00% range. Data as of 12.31.2015. Source: Bureau of Economic Analysis, Sterling Capital Management Analytics 13 . Annual Change In Nonfarm Payroll Change in Employment 4,000 12-Month Net Change 3,000 2,000 Thousands 1,000 0 -1,000 -2,000 -3,000 -4,000 -5,000 -6,000 2003  2004 2005 2006 2007 2008 2009 2010 2011 2012 2013 2014 2015 2016 Job growth has increased for seven consecutive years. It’s anticipated that improved economic growth in 2017 will create more jobs than experienced in 2016. Data as of 12.31.2016. Source: Bureau of Labor Statistics. 14 . Yellen’s Dashboard Of Labor Market Indicators Unemployment and Underemployment (U-6) Percent of Unemployed Considered Long-Term 20% 50% 18% 45% 16% 40% 14% 35% 12% 30% 10% 25% 8% 20% 6% 15% 4% Total Unemployment Rate 10% U-6 Rate 2% 0% Jan-08 5% Jan-09 Jan-10 Jan-11 Jan-12 Dec-12 Dec-13 Dec-14 Dec-15 Dec-16 NonFarm Payrolls MoM Change Thousands 0% Jan-08 Jan-09 Jan-10 Jan-12 Dec-12 Dec-13 Dec-14 Dec-15 Dec-16 Initial Jobless Claims Thousands 600 Jan-11 700 400 600 200 0 500 -200 400 -400 -600 300 -800 -1000 Jan-08  Dec-08 Dec-09 Dec-10 Dec-11 Dec-12 Dec-13 Dec-14 Dec-15 Dec-16 200 Jan-08 Dec-08 Dec-09 Dec-10 Dec-11 Dec-12 Dec-13 Dec-14 Dec-15 Dec-16 January’s employment report showed continued job growth with 227,000 non-farm payroll jobs created in the month and the unemployment rose slightly to 4.8% Sources: Bureau of Labor Statistics, Department of Labor. 15 . State Unemployment Rate – December 2016 New Hampshire Vermont 2.7% Washington 5.3% 3.2% Montana 4.0% North Dakota 2.9% Oregon 5.0% Massachusetts 2.9% Minnesot a 3.8% New York 5.1% Wisconsin 4.1% South Dakota 2.7% Idaho 3.8% Nevada 5.2% Maine 4.0% Wyoming 4.9% Iowa 3.8% Nebraska 3.4% Utah 3.1% California 5.3% Arizona 5.0% Colorado 3.2% Kansas 4.3% Oklahom a 5.1% New Mexico 6.7% Texas 4.6% Alaska 6.8% Illinois 5.6% Indiana 4.2% Ohio 4.9% Tennessee 4.8% Mississip Alabama 5.9% pi 5.7% Louisiana 6.2% Connecticut 4.7% Pennsylvania 5.7% New Jersey 5.0% Delaware 4.3% West Virginia Virginia 6.0% 4.2% Kentucky 4.8% Missouri 4.7% Arkansas 4.0% Rhode Island 5.3% Michigan 4.9% North Carolina 5.0% South Carolina 4.4% Georgia 5.3% Florida 4.9% Maryland 4.2% Washington DC 6.0% Unemployment Rate Changes De c e mb e r, 2 0 16 North Ca rolina S outh Ca rolina Ge orgia Te xa s Florida Virginia Ne w York Ma ssa c huse tts Illinois Ca lifornia De c e mb e r, 2 0 10 5.0% 4.4% 5.3% 4.6% 1.9% 4.2% 5.1% 2.9% 5.6% 5.3% 10.2% 9.4% 9.6% 7.1% 9.3% 6.9% 9.6% 6.9% 10.6% 10.8% Hawaii 3.0% <3.9%  4.0 – 4.9% 5.0 – 5.9% 6.0+% The employment picture has improved significantly in every state since unemployment peaked nationally at 10.2% in the first quarter of 2010. Source: Bureau of Labor Statistics. 16 . Inflation Outlook Consumer Price Index PCE Price Deflator 6% 6% Headline CPI Core CPI Headline PCE 5% 4% 4% 3% 3% 2% 2% 1% 1% 0% 0% -1% -1% -2% Core PCE 5% -2% -3% May-06 Mar-08 Dec-09 Sep-11 Jun-13 Mar-15 Dec-16 -3% May-06 Feb-08 Nov-09 Aug-11 May-13 Feb-15 Nov-16  Inflation measures are beginning to increase, though are not at levels that threaten to undermine U.S. growth.  The trend towards higher inflation rates should continue in 2017 as the economy expands. Consumer Price Index data as of 12.31.2016. PCE Price Deflator data as of 11.30.2016. Sources: Bureau of Economic Analysis, The Federal Reserve. 17 .
U.S. Exports and China U.S. GDP U.S. Exports U.S.
GDP 1% 7% 13.5% 86.5% 93% Exports Other Components China 99% Rest of the World Exports to China Other Components  The U.S. and Chinese trade relationship will attract significant economic attention in 2017 as global trade agreements come under scrutiny. In anticipation of potential changes it is important to understand our current economic dependencies.     U.S.
exports are just 13.5% of U.S. GDP. U.S. exports to China are just 7% of total exports. U.S.
exports to China are just 1% of U.S. GDP. Even accounting for indirect effects on other areas of the world, the export channel is unlikely to cause a major disruption for the U.S. economy. Data as of 11/30/2016 Source: Cornerstone Macro. 18 .
Leading Economic Indicators Composite Index of 10 Leading Indicators (2004=100) 3/31/94 - 12/31/16 Indicators 110  Week by Hours (Manufacturing)  Jobless Claims  Manufacturing New Orders for Consumers 105 100  Manufacturing New Orders for Non-Defense  Vendors Performance  Building Permits  S&P 500 Performance  Money Supply (M2) 95 90 85  Interest Rate Spread (10 yr Treasury vs. Fed Funds)  Consumer Confidence 80 75 Dec-95 Dec-96 Dec-97 Dec-98 Dec-99 Dec-00 Dec-01 Dec-02 Dec-03 Dec-04 Dec-05 Dec-06 Dec-07 Dec-08 Dec-09 Dec-10 Dec-11 Dec-12 Dec-13 Dec-14 Dec-15 Source: U.S. Conference Board  The Leading Economic Indicators (LEI) Index is released monthly and is comprised of 10 indicators that have shown to forecast the future direction of the business cycle.  The current LEI remains marginally below pre-recession highs – however, 7 of 10 indicators are in positive territory and the trend remains positive. The driver of lower LEI data has primarily been the pull back in equity prices and a flattening of manufacturing activity. 19 .
Economic Outlook Strengths Concerns  Signs of economic improvement continue – new “pro business” administration in Washington likely to support stronger growth.  Trump victory giving rise to future uncertainty due to lack of clarity in new administration’s policies.  Inflation is low and not expected to rise in the near term.  “Brexit” vote in the U.K. and the Trump administration’s potential protectionist trade policies will add uncertainty to the global economic environment.  Consumer confidence and spending is strengthening.  Strong corporate balance sheets continue as a positive.  M&A activity, dividend increases, and share buybacks positive.  Personal incomes growing and employment picture improving.  Positive trend in leading economic indicators.  Employment data positive, but continues to be relatively weak.  Housing improving, but at a modest pace.  Global security concerns are rising with several terrorist incidences occurring this year. Outlook The combination of a modest improvement in housing, employment, and business spending should keep economic growth in positive territory over the next several quarters. However, the pace of growth is expected to be relatively subdued. Geopolitical concerns and Washington’s uncertainty will overhang the economy but should not derail the recovery.
Improving corporate earnings, stable consumer confidence, an uptick in capital spending, and a rise in the Leading Economic Indicators foretell future growth. Election uncertainty has now been removed – which should add additional clarity to corporate management and policymakers. There will also be gains realized from a rising trend in M&A activity and share repurchases which should further help the recovery.
We see a final 2016 growth rate finishing at around 2.5% - helped by a boost in second half growth. For 2017, we are more optimistic with economic growth pushing higher to the 2.75%-3.00% range. 20 . Sterling Capital Disclosure The opinions contained in the preceding commentary reflect those of Sterling Capital Management LLC, and not those of BB&T Corporation or its executives. The stated opinions are for general information only and are not meant to be predictions or an offer of individual or personalized investment advice. They are not intended as an offer or solicitation with respect to the purchase or sale of any security. This information and these opinions are subject to change without notice.
Any type of investing involves risk and there are no guarantees. Sterling Capital Management LLC does not assume liability for any loss which may result from the reliance by any person upon such information or opinions. Investment advisory services are available through Sterling Capital Management LLC, a separate subsidiary of BB&T Corporation. Sterling Capital Management LLC manages customized investment portfolios, provides asset allocation analysis and offers other investment-related services to affluent individuals and businesses.
Securities and other investments held in investment management or investment advisory accounts at Sterling Capital Management LLC are not deposits or other obligations of BB&T Corporation, Branch Banking and Trust Company or any affiliate, are not guaranteed by Branch Banking and Trust Company or any other bank, are not insured by the FDIC or any other federal government agency, and are subject to investment risk, including possible loss of principal invested. 21 .
Core CPI e xc lude s food and e ne rgy pric e s. 2 . Major Market Returns One Year Ending January 31, 2017 -10% 0% 10% 20% Russell Mega 50 30% 40% 50% Russell 2000 CRB Index 15.8% 44.6% Gold 8.5% 10.3% 9.5% 7.9% 0.7% Oil Gold 1.4% -10.3% -11.2% -1.0% Barclays 1-10 Municipal -0.4% 15% 10.9% MSCI EM 25.4% Oil 10% 11.0% EAFE 12.0% CRB Index 5% Russell 2000 33.5% MSCI EM 0% Russell MidCap 24.7% EAFE -5% Russell 3000 21.7% Russell MidCap -10% S&P 500 20.0% Russell 3000 -15% Russell Mega 50 16.9% S&P 500 Barclays 1-10 Municipal Three Years Ending January 31, 2017 2.2% 1.9% Barclays GCI 1.1% Barclays GCI Barclays Aggregate 1.5% Barclays Aggregate 2.6% Barclays Interm. Credit 2.7% MBS Index 2.5% Barclays Interm. Credit MBS Index 3.4% 0.3%  U.S. equity markets rose significantly over the past year with small caps outpacing large caps.
Despite the market’s recent small cap bias, large caps have outperformed over the past three years.  International stocks have significantly underperformed domestic equities over the past three years; however, emerging markets have rallied over the past year to keep pace with U.S. stocks.  The recent upward move in interest rates has caused bonds to weaken – however, returns remain in positive territory for the three year period. 3 Sources: Russell, S&P, Barclays, FactSet, MSCI . The “Trump Effect” Russell 3000 Sector Returns November 8, 2016 - January 31, 2017 Major Market Returns November 8, 2016 - January 31, 2017 S&P 500 Financials 6.5% 16.6% Materials Russell Mid Cap 12.0% 8.2% Industrials Russell 2000 10.9% 14.0% Telecom Services EAFE Consumer Discr. 5.1% Emerging Markets 1.2% Barclays 1-10 Muni 10.2% Technology 4.9% Energy -1.3% Barclays GCI 10.3% -1.4% 7.5% Russell 3000 7.2% Healthcare Barclays Aggregate 5.0% -2.0% Real Estate Oil Gold 16.4% -4.7% Utilities Consumer Staples 3.6% 1.7% 1.4%  The unexpected election of Donald Trump as president sent the equity markets soaring with small caps and economically-sensitive stocks performing the best.  Fixed income markets declined as interest rates jumped on rising confidence that economic growth will improve and the Fed will resume interest rate hikes in 2017. 4 . 2017: The Year of Transition Year of Transition Major Shifts in 2017 From: To: Economic Growth Stimulus driven by monetary policy Stimulus driven by fiscal spending Fears of stagnation and deflation Improving growth and rising inflation Rising regulation Declining regulations "Macro" themes (broad-based growth) "Micro" themes (rising competition) Global Forces Progressing towards globalization Rising nationalism and protectionism Entrenched political class Rise of populism Tolerance of currency manipulation Retribution for currency manipulation Investment Trends Focus on safety "Rising tide lifts all boats" "Winner takes all" Generational decline in interest rates  Higher appetite for risk Secular rise in interest rates In 2016, significant economic and political shifts occurred across Europe, the Middle East, Asia, and the U.S. These global events will result in 2017 being a year of major transition. 5 . Market Leadership: Year-Over-Year Returns +50 Stocks vs. Bonds Year-Over-Year Change S&P 500 vs. Barclays Aggregate +40 +30 +20 (%) +10 + +10 +20 +30 Barclays Aggregate Outperforms +40 S&P 500 Outperforms +50 +40 1987 1989 1990 1991 1992 1994 1995 1996 1997 1999 2000 2001 2002 2004 2005 2006 2007 2009 2010 2011 2012 2014 2015 2016 Large Cap vs. Small Cap Year-Over-Year Change in S&P 500 vs.
Russell 2000 Russell 2000 Outperforms +30 S&P 500 Outperforms +20 (%) +10 + +10 +20 +30 +40  Stock returns relative to bonds diverge dramatically over market cycles. The equity rally over the past three months created significant return dispersion in stocks versus bonds on a year-over-year basis. This further supports the benefits of asset class diversification.  There can be significant dispersion of returns within U.S. equity markets which is why we believe in equity asset class diversification. After a prolonged period small cap stocks have significantly outperformed large caps over the past three months– pushing year-over-year results in favor of small caps. 1987 1989 1990 1991 1992 1994 1995 1996 1997 1999 2000 2001 2002 2004 2005 2006 2007 2009 2010 2011 2012 2014 2015 2016 Source for both charts: eVestment Analytics. 6 .
Long Term Market Returns Long Term Asset Class Returns Ending January 31, 2017 20% 5 Year Return 10 Year Return 15% 10% 5% 0% -5% -10% -15% Russell Mega 50 S&P 500 Russell 3000 U.S Equity Russell MidCap Russell 2000 EAFE - Developed MSCI EM CRB Index Developed Small Cap International Oil Commodities Gold Barclays 110 Muni Barclays GCI Barclays Aggregate Barclays Interm. Credit MBS Index Fixed Income  Despite volatility, long term rates of return for financial assets have been positive – however, commodity prices have declined.  Annual compounded returns for equities over the trailing ten years are solidly in positive territory, despite the more than 50% market drop during the financial crisis of 2008-2009 – further supporting a focus on the long term. Source: FactSet 7 . Equity Market Volatility Over the Past Decade S&P 500 12/31/06 - 1/31/17 2500 Standard Deviation of Daily Returns 2300 0.89% 1.00% 0.49% 0.50% 2100 “Taper Tantrum” S&P Downgrades US Debt” Dec. 1990 - Apr. 2009 Mar. 2009 Dec.
2016 “Flash Crash” Unemployment rate tops 10% -19.3% 1500 -11.4% “Brexit” -11.4% Oil Hits $25/barrel -15.7% 1300 1100 +241% Russia Annexes Crimea - 57% Sep-16 Dec-16 Jun-16 Dec-15 Mar-16 Jun-15 Dec-14 Mar-15 Jun-14 Sep-14 Mar-14 Sep-13 Dec-13 Jun-13 Mar-13 Sep-12 Dec-12 Jun-12 Mar-12 Sep-11 Jun-11 Jun-10 Sep-10 Dec-09 Mar-10 Jun-09 Sep-09 Dec-08 Mar-09 Sep-08 Jun-08 Mar-08 Sep-07 Dec-07 Jun-07 Mar-07 Dec-10 Japanese Earthquake European Debt Crisis Dec-06 Greek Debt Crisis Intensifies Dec-11 700 Mar-11 900 China Drops Growth Rate Targets to Single Digits Sep-15 1700 500 -15.2% -12.7% -10.1% Benghazi 0.00% 1900 U.S. Elections E.U. Falls into Recession  The past decade has been filled with economic and political challenges – however, stock prices have more than tripled from their low point in the first quarter of 2009.  These market gains have been accompanied by extreme volatility with seven corrections greater than 10% in the past seven years, and daily volatility that far exceeds historic norms. Source: FactSet 8 .
Global Equity Market Returns Trailing 12 Months Ending January 31, 2017 Euro-Zone* Russia 10.2% Canada 55.8% *Eurozone comprised of 17 countries that use the Euro as its currency. Largest constituents include Germany, France and Italy. 32.5% China 23.5% U.K. U.S. Japan 7.7% 15.7% 20.0% Hong Kong Mexico 21.5% -3.9% Brazil India Australia 98.6% 10.5% 27.0% Source: S&P; MSCI  International equity markets over the past year experienced dramatic dispersion relative to U.S. stocks – many emerging markets have bounced back from their “bear market” levels over the last 12-18 months.  Global markets continue to confront political and economic uncertainty – this should push volatility higher. Source: Bloomberg 9 . Global Perspective Global Market Capitalization Breakdown (U.S. vs. Non-U.S.) 1970 U.S. Global GDP and Corporate Location (U.S. vs.
Non-U.S.) 2016* U.S. Non-U.S. Percentage of Global GDP Non-U.S. U.S. 69% 78% 42% Source: International Monetary Fund (IMF), Russell Investments * Preliminary 26% 74%  International economies represent two-thirds of global GDP with the majority of publicly traded companies based outside of the U.S. Year-Over-Year Relative Performance EAFE vs. Emerging Markets Year-Over-Year Relative Performance EAFE vs. S&P 500 12/31/88 – 1/31/17 12/31/88 – 1/31/17 +60 +30 +40 +20 +20 (%) +10 (%) Non-U.S. Source: International Monetary Fund (IMF), MSCI for most recent period ending 12/31/15  International markets continue to grow with over half of the world’s market capitalization traded outside of the U.S. +40 U.S. Non-U.S. 22% 58% 31% Publicly Traded Companies by Location + + +20 +40 +30 +60 +40 +80 EAFE Outperforms S&P 500 Outperforms Source: eVestment  International markets move in cycles with periods of underperformance  versus U.S.
markets followed by periods of outperformance. 1988 1989 1990 1991 1992 1993 1993 1994 1995 1996 1997 1998 1998 1999 2000 2001 2002 2003 2003 2004 2005 2006 2007 2008 2008 2009 2010 2011 2012 2013 2013 2014 2015 2016 +20 1988 1989 1990 1991 1992 1993 1993 1994 1995 1996 1997 1998 1998 1999 2000 2001 2002 2003 2003 2004 2005 2006 2007 2008 2008 2009 2010 2011 2012 2013 2013 2014 2015 2016 +10 Emerging Markets Outperform EAFE Outperforms Source: eVestment Emerging Markets have a performance advantage over developed economies due to higher growth rates – however, there are prolonged periods where developed markets generate higher returns. 10 . Fixed Income Markets: Trailing 12 Months 10 Year Treasury Spread vs. BBB As of 1/31/17 7.0%  The BBB-rated corporate yield versus Treasuries continues to narrow with the spread dropping from 200 basis points last summer to 123 at the end of January. 6.0% 5.0% 4.0% 3.0% 2.0% 1.0% 0.0% Source: Bloomberg; Barclays Capital Treasury Yield Curve  The yield curve has flattened over the past year as short term rates have drifted marginally higher while long term rates have declined. As of 1/31/17 3.50 1/31/17 Yield (%) 3.00 One Month Ago 2.50 One Year Ago 2.00  The 10 year Treasury bond yield closed January at 2.49% - up dramatically from last summer’s record low of 1.40% 1.50 1.00 0.50 0.00 3 Month Source: FactSet 6 Month 1 Year 2 Year 5 Year 7 Year 10 Year 30 Year 11 . Our Current Market View and Strategy U.S. Equity Markets International Equity Markets Fixed Income Markets Strengths Strengths Strengths  Economic growth is expected to be positive with possible upside to expectations with the new administration's policies.  Valuations are historically high – but not at historic extremes.  Corporate balance sheets are very strong – high cash and low debt levels – leading to aggressive share buybacks, dividend increases, and rising M&A activity.  U.S. markets continue to be viewed globally as a safe haven with strong fundamentals.  Long term rolling returns are below historic norms.  Unique investment opportunities in various regions exist as non-U.S. markets now represent over 50% of global capitalization – our emphasis is currently on developed markets vs.
emerging markets.  Changes to monetary policy through the Fed’s interest rate policies is expected to be gradual over the next year. Concerns  Global growth concerns are expected to persist – especially in international markets.  Uncertainty over the impact of new trade and tax policies anticipated by the new administration.  Uncertainty over the timing and pace of the Fed’s shift in monetary policy in 2017.  Geopolitical risk - especially with recent developments in Iraq and Syria, and continuation of uncertainty in Russian Mid East policy. We are positive on the long-term outlook for U.S. equities. We expect positive earnings growth, low inflation, and strong corporate balance sheets will help stocks move higher over the next several years. In addition, the U.S.’s position as a global economic leader should continue to attract capital.
Capital markets will also benefit from rising M&A activity and additional share buyback programs. The pro-business shift in Washington following the election adds opportunity for a boost in growth – however, uncertainty will persist. We expect significant volatility as issues are resolved around fiscal and monetary policy – and global growth expectations.  Expect higher than U.S. growth in many non-U.S. economies – primarily emerging markets - over the next three to five years.  Recent underperformance versus the U.S.
has improved relative valuations in many international markets. Concerns  Dislocation in markets is a risk with recent political events such as “Brexit” and the Trump victory leading to concerns over protectionist sentiments and possible policy initiatives.  Emerging market growth expectations (especially in China) have slowed in recent quarters causing investor concerns and increased volatility in their equity markets.  Political, economic, social, and military unrest and uncertainty in Syria and throughout the Middle East. We want to have an active exposure to the international markets. We believe global economic and financial markets continue to be a cornerstone of a diversified portfolio. Our current bias is towards developed markets versus emerging markets. We are watching closely the impact on global markets of recent political shifts towards more protectionist policies.
Although this shift will create additional volatility, new opportunities may be presented to investors.  Corporate credit fundamentals are strong and improving.  Growing pressure to reduce government debt and spending.  Continued low inflationary pressures. Concerns  Persistently large budget deficits.  The Fed’s successful launch and execution of rate hikes over the next year.  Rising concerns over a possible uptick in inflation driven by improving economic conditions.  Risk associated with emerging market debt, China and India economic slowdown, and pervasive geopolitical unrest. We are positioning our portfolios more defensively by maintaining short to neutral maturity positions relative to benchmarks and focusing on higher coupon bonds. We believe the improving economy is expected to eventually put upward pressure on long term rates. We favor overweighting high quality corporate bonds relative to Treasury and Agency securities.
Our high quality bias is expected to provide enhanced liquidity during this transition period. Municipal bonds have been attractively priced relative to taxable securities for the past several years – however, recently that relationship has become more normalized. 12 . Historical U.S. GDP U.S. GDP Annual Growth Rate 8% 7% 6% 5% Median Annual GDP Growth 1980-2000 = 3.6% 4% Median Annual GDP Growth 2001-2015 = 1.9% 3% 2% 1% 0% -1% -2% -3% -4% 1981 1983 1985 1987 1989 1991 1993 1995 1997 1999 2001 2003 2005 2007 2009 2011 2013 2015  U.S. economic growth has been positive for the past six years; however the pace of growth has been below its long-term historic average since 2000.  GDP expansion in 2016 is expected to have generated full year growth of around 2.5% - primarily due to a stronger second half of the year.
If economic momentum continues and growth policies are implemented, 2017 growth is expected to be in the 2.75% - 3.00% range. Data as of 12.31.2015. Source: Bureau of Economic Analysis, Sterling Capital Management Analytics 13 . Annual Change In Nonfarm Payroll Change in Employment 4,000 12-Month Net Change 3,000 2,000 Thousands 1,000 0 -1,000 -2,000 -3,000 -4,000 -5,000 -6,000 2003  2004 2005 2006 2007 2008 2009 2010 2011 2012 2013 2014 2015 2016 Job growth has increased for seven consecutive years. It’s anticipated that improved economic growth in 2017 will create more jobs than experienced in 2016. Data as of 12.31.2016. Source: Bureau of Labor Statistics. 14 . Yellen’s Dashboard Of Labor Market Indicators Unemployment and Underemployment (U-6) Percent of Unemployed Considered Long-Term 20% 50% 18% 45% 16% 40% 14% 35% 12% 30% 10% 25% 8% 20% 6% 15% 4% Total Unemployment Rate 10% U-6 Rate 2% 0% Jan-08 5% Jan-09 Jan-10 Jan-11 Jan-12 Dec-12 Dec-13 Dec-14 Dec-15 Dec-16 NonFarm Payrolls MoM Change Thousands 0% Jan-08 Jan-09 Jan-10 Jan-12 Dec-12 Dec-13 Dec-14 Dec-15 Dec-16 Initial Jobless Claims Thousands 600 Jan-11 700 400 600 200 0 500 -200 400 -400 -600 300 -800 -1000 Jan-08  Dec-08 Dec-09 Dec-10 Dec-11 Dec-12 Dec-13 Dec-14 Dec-15 Dec-16 200 Jan-08 Dec-08 Dec-09 Dec-10 Dec-11 Dec-12 Dec-13 Dec-14 Dec-15 Dec-16 January’s employment report showed continued job growth with 227,000 non-farm payroll jobs created in the month and the unemployment rose slightly to 4.8% Sources: Bureau of Labor Statistics, Department of Labor. 15 . State Unemployment Rate – December 2016 New Hampshire Vermont 2.7% Washington 5.3% 3.2% Montana 4.0% North Dakota 2.9% Oregon 5.0% Massachusetts 2.9% Minnesot a 3.8% New York 5.1% Wisconsin 4.1% South Dakota 2.7% Idaho 3.8% Nevada 5.2% Maine 4.0% Wyoming 4.9% Iowa 3.8% Nebraska 3.4% Utah 3.1% California 5.3% Arizona 5.0% Colorado 3.2% Kansas 4.3% Oklahom a 5.1% New Mexico 6.7% Texas 4.6% Alaska 6.8% Illinois 5.6% Indiana 4.2% Ohio 4.9% Tennessee 4.8% Mississip Alabama 5.9% pi 5.7% Louisiana 6.2% Connecticut 4.7% Pennsylvania 5.7% New Jersey 5.0% Delaware 4.3% West Virginia Virginia 6.0% 4.2% Kentucky 4.8% Missouri 4.7% Arkansas 4.0% Rhode Island 5.3% Michigan 4.9% North Carolina 5.0% South Carolina 4.4% Georgia 5.3% Florida 4.9% Maryland 4.2% Washington DC 6.0% Unemployment Rate Changes De c e mb e r, 2 0 16 North Ca rolina S outh Ca rolina Ge orgia Te xa s Florida Virginia Ne w York Ma ssa c huse tts Illinois Ca lifornia De c e mb e r, 2 0 10 5.0% 4.4% 5.3% 4.6% 1.9% 4.2% 5.1% 2.9% 5.6% 5.3% 10.2% 9.4% 9.6% 7.1% 9.3% 6.9% 9.6% 6.9% 10.6% 10.8% Hawaii 3.0% <3.9%  4.0 – 4.9% 5.0 – 5.9% 6.0+% The employment picture has improved significantly in every state since unemployment peaked nationally at 10.2% in the first quarter of 2010. Source: Bureau of Labor Statistics. 16 . Inflation Outlook Consumer Price Index PCE Price Deflator 6% 6% Headline CPI Core CPI Headline PCE 5% 4% 4% 3% 3% 2% 2% 1% 1% 0% 0% -1% -1% -2% Core PCE 5% -2% -3% May-06 Mar-08 Dec-09 Sep-11 Jun-13 Mar-15 Dec-16 -3% May-06 Feb-08 Nov-09 Aug-11 May-13 Feb-15 Nov-16  Inflation measures are beginning to increase, though are not at levels that threaten to undermine U.S. growth.  The trend towards higher inflation rates should continue in 2017 as the economy expands. Consumer Price Index data as of 12.31.2016. PCE Price Deflator data as of 11.30.2016. Sources: Bureau of Economic Analysis, The Federal Reserve. 17 .
U.S. Exports and China U.S. GDP U.S. Exports U.S.
GDP 1% 7% 13.5% 86.5% 93% Exports Other Components China 99% Rest of the World Exports to China Other Components  The U.S. and Chinese trade relationship will attract significant economic attention in 2017 as global trade agreements come under scrutiny. In anticipation of potential changes it is important to understand our current economic dependencies.     U.S.
exports are just 13.5% of U.S. GDP. U.S. exports to China are just 7% of total exports. U.S.
exports to China are just 1% of U.S. GDP. Even accounting for indirect effects on other areas of the world, the export channel is unlikely to cause a major disruption for the U.S. economy. Data as of 11/30/2016 Source: Cornerstone Macro. 18 .
Leading Economic Indicators Composite Index of 10 Leading Indicators (2004=100) 3/31/94 - 12/31/16 Indicators 110  Week by Hours (Manufacturing)  Jobless Claims  Manufacturing New Orders for Consumers 105 100  Manufacturing New Orders for Non-Defense  Vendors Performance  Building Permits  S&P 500 Performance  Money Supply (M2) 95 90 85  Interest Rate Spread (10 yr Treasury vs. Fed Funds)  Consumer Confidence 80 75 Dec-95 Dec-96 Dec-97 Dec-98 Dec-99 Dec-00 Dec-01 Dec-02 Dec-03 Dec-04 Dec-05 Dec-06 Dec-07 Dec-08 Dec-09 Dec-10 Dec-11 Dec-12 Dec-13 Dec-14 Dec-15 Source: U.S. Conference Board  The Leading Economic Indicators (LEI) Index is released monthly and is comprised of 10 indicators that have shown to forecast the future direction of the business cycle.  The current LEI remains marginally below pre-recession highs – however, 7 of 10 indicators are in positive territory and the trend remains positive. The driver of lower LEI data has primarily been the pull back in equity prices and a flattening of manufacturing activity. 19 .
Economic Outlook Strengths Concerns  Signs of economic improvement continue – new “pro business” administration in Washington likely to support stronger growth.  Trump victory giving rise to future uncertainty due to lack of clarity in new administration’s policies.  Inflation is low and not expected to rise in the near term.  “Brexit” vote in the U.K. and the Trump administration’s potential protectionist trade policies will add uncertainty to the global economic environment.  Consumer confidence and spending is strengthening.  Strong corporate balance sheets continue as a positive.  M&A activity, dividend increases, and share buybacks positive.  Personal incomes growing and employment picture improving.  Positive trend in leading economic indicators.  Employment data positive, but continues to be relatively weak.  Housing improving, but at a modest pace.  Global security concerns are rising with several terrorist incidences occurring this year. Outlook The combination of a modest improvement in housing, employment, and business spending should keep economic growth in positive territory over the next several quarters. However, the pace of growth is expected to be relatively subdued. Geopolitical concerns and Washington’s uncertainty will overhang the economy but should not derail the recovery.
Improving corporate earnings, stable consumer confidence, an uptick in capital spending, and a rise in the Leading Economic Indicators foretell future growth. Election uncertainty has now been removed – which should add additional clarity to corporate management and policymakers. There will also be gains realized from a rising trend in M&A activity and share repurchases which should further help the recovery.
We see a final 2016 growth rate finishing at around 2.5% - helped by a boost in second half growth. For 2017, we are more optimistic with economic growth pushing higher to the 2.75%-3.00% range. 20 . Sterling Capital Disclosure The opinions contained in the preceding commentary reflect those of Sterling Capital Management LLC, and not those of BB&T Corporation or its executives. The stated opinions are for general information only and are not meant to be predictions or an offer of individual or personalized investment advice. They are not intended as an offer or solicitation with respect to the purchase or sale of any security. This information and these opinions are subject to change without notice.
Any type of investing involves risk and there are no guarantees. Sterling Capital Management LLC does not assume liability for any loss which may result from the reliance by any person upon such information or opinions. Investment advisory services are available through Sterling Capital Management LLC, a separate subsidiary of BB&T Corporation. Sterling Capital Management LLC manages customized investment portfolios, provides asset allocation analysis and offers other investment-related services to affluent individuals and businesses.
Securities and other investments held in investment management or investment advisory accounts at Sterling Capital Management LLC are not deposits or other obligations of BB&T Corporation, Branch Banking and Trust Company or any affiliate, are not guaranteed by Branch Banking and Trust Company or any other bank, are not insured by the FDIC or any other federal government agency, and are subject to investment risk, including possible loss of principal invested. 21 .
Sterling Capital Management LLC