1) january 2015
THE INVESTOR
NAVIGATING THE CREDIT MARKETS
Loans or Bonds
In 2014, high yield bonds and bank loans produced their lowest annual returns since 2011. While both asset classes had positive returns, year-end volatility, growth concerns, a commodity selloff, and
outflows negatively impacted performance. Entering 2015, given
relative and absolute valuation measures, the outlook for bonds and
loans is more attractive today than at any point last year. The two
asset classes, however, possess unique risk profiles and could have
varying roles in an asset allocation.
Enhancing return or diversifying risk
Bank loan and high yield bonds have strong relative value entering 2015. However, each market provides a unique role in an
overall asset allocation.
High yield has historically been highly correlated with equity
performance. High Yield bonds may participate in upside surprises in 2015 while current income may cushion downside
risks relative to equities.
Table 1: Relative value favors credit risk given absolute and rela-
60
tive valuation measures
50
High Yield
Index
Bank Loans
Corporate
Agency MBS
Int Corporate
Aggregate
Treasury
4.17
Yield
4.34
2.21
Duration
0.25
7.35
3.15
5.28
5.68
6.46
5.94
2.78
2.28
1.92
1.09
99.40
OAS
40
106.56
136
20
111
Price
96.12
111.26
106.61
107.79
106.54
Source: Barclays, Credit Suisse, as of January 30, 2014
509
S&P 500
Barclays High Yield
Annual total returns
534
33
51
N/A
Current valuations make bank loans and high yield bonds attractive
against the absolute low yields of traditional fixed income (table 1).
Late 2014 volatility has brought yield levels to three year highs (chart
1). Average prices are now below par, with loan prices trading around
$96 and high yield bonds trading around $99. The Barclays U.S. High
Yield Index, which had a yield of 4.91% in June, is now yielding 6.46%
as of the end of January. Given the move in U.S. Treasuries, the Option
Adjusted Spread (OAS) is now at 509, the highest since June 2013. In
the following six months since the index last hit this OAS, high yield
bonds returned 5.95% while the Barclays U.S. Aggregate Index returned 0.43% as rates moved higher by 48bps on the 10-Year Treasury. The result was an excess return of 624bps.
30
10
0
-10
-20
-30
-40
2000
2002
2004
2006
2008
2010
2012
2014
Source: Barclays, S&P, as of December 31, 2014
In contrast to high yield, bank loans may serve as a low volatility
compliment to traditional fixed income
7
6
2014 total return (%)
Barclays U.S. High Yield
CS Leveraged Loan Index
5
4
3
2
Loans exhibited low volatility
relative to high yield in 2014
1
0
-1
Jan-14
Mar-14
May-14
Jul-14
Sep-14
Source: Barclays, Credit Suisse, as of December 31, 2014
Nov-14
2) loans or bonds
january 2015
Chart 1: 2014 volatility and poor year-end technicals have left
bank loan and bond yields at three year highs
10.0
than seven months ago, when loans had an average price of $99
and high yield bonds were yielding below 5%. But should investors
allocate to high yield or loans? To answer this, we will dig a little
CS Leveraged Loan Index Yield (%)
deeper.
Barclays High Yield Index YTW (%)
9.0
Given this backdrop, 2015 appears to be a much better entry point
8.0
Just how strange was 2014 for high yield? In the last 25 years, the
High yield bonds - an odd 2014 and compelling 2015
S&P 500 has been up more than 10% in 13 of those calendar years.
7.0
With the S&P 500 up 13% last year, the Barclays High Yield Index
returned 2.45%, the lowest total return for high yield in any of
6.0
5.0
4.0
Jan-12
Jun-12
Nov-12
Apr-13
Sep-13
Feb-14
Jul-14
Dec-14
Source: Barclays, Credit Suisse, as of January 30, 2014
The real question, however, is if spreads will continue to widen as
government bond yields plummet and investor’s risk sentiment remain finicky. At a high level, corporate health measures, improving
U.S. economic activity, and a lack of upcoming maturities all point
to a continuation of below average defaults. Globally, central bank-
ers are increasing aggressiveness toward accommodative policy.
The announcement of QE programs in Europe and Japan are likely
to eventually be a net positive for spread products given the lack
of yield opportunities elsewhere (Chart 2). Even as our Federal Re-
serve gets closer to increasing the overnight rate, they have shown
themselves to be cautious as to ensure the rate hike would only be
in the face of an expanding economy.
these periods. Historically, the two asset classes have shown a high
correlation (Chart 3). This correlation broke down in 2014 given
high yield’s exposure to energy and negative technicals.
In 2015, high yield bonds are likely to be pulled by opposing forces.
On the one hand, improving growth prospects in the U.S., stable
balance sheets, and recent monetary policy actions abroad point to
a positive credit environment and the ability for spreads to move
tighter. On the other hand, high yield remains subject to higher
levels of volatility, negative flows, and greater exposure to energy.
With yields above 6%, low correlation with Treasuries (in particular for B and CCC rated bonds), and relatively stable balance sheets,
high yield has the room to participate in upside economic or macro
surprises along with equities. In addition to the reward potential,
high coupon levels should help insulate downside risk, thus presenting a compelling case for high yield vs. equities entering 2015.
Chart 3: High yield has historically been highly correlated with
Chart 2: Global quantitative easing should benefit U.S. fixed in-
equity performance
come given higher yields and better fundamentals
60
7
Yields of various indices (%)
Europe
U.S
6
S&P 500
Barclays High Yield
Average (2000-2014)
S&P 500: 6.02
High Yield: 8.83
50
40
30
20
5
10
4
0
-10
3
-20
2
-30
1
-40
2000
0
Bank Loan
Corporate
Government
High Yield
Securitized
2002
2004
2006
2008
2010
2012
2014
Source: Barclays, S&P, as of December 31, 2014
Source: Barclays, Credit Suisse, as of January 26, 2015
2
3) loans or bonds
january 2015
Chart 4: High yield has historically provided a lower volatility
return profile through a business cycle versus equities
35
30
Five year rolling returns (%)
Barclays US Corporate High Yield
S&P 500
high yield bonds, bank loan returns were underwhelming given
the year-end volatility, energy selloff, and negative fund flows. De-
fixed income, bank loans showed low volatility in 2014. Bank loans
20
only material weakness came in December, when poor technicals
and year-end liquidity impacted the asset class. Over the past two
15
years, during two distinct bear and bull markets for Treasuries, we
10
5
0
-10
Suisse Leveraged Loan Index returning 2.06%. In sympathy with
spite the relative underperformance when compared to traditional
25
-5
Bank loan returns were below coupon in 2014, with the Credit
Bank Loans – a risk diversifier
Federal Reserve
2002 2003 2004 2005 2006 2007 2008 2009 2010 2011 2012 2013 2014
Source: Barclays, S&P, as of December 31, 2014
The largest specific risk to the outlook for high yield bonds in 2015
The wild card
is energy and the continued stress from the collapse in commodity
prices. The high yield energy sector has grown by 133% since 2007,
moving from a 6% to 14% index weighting, as U.S. debt markets
have been the primary funding source for the shale gas and oil in-
frastructure boom. Given the higher cost and leveraged operators
within high yield, $45 dollar per barrel oil may lead to a substantial default rate for some of these energy related companies. While
many of these issuers have hedged oil prices in the short term, a
majority of hedges roll off in 2015, exposing companies to collaps-
ing EBITDA, free cash flow, and refinancing risk in 2016. JP Morgan
estimates that at an average oil price of $65 through 2017, energy
sector default rates may approach 13% over the next three years
(table 2).
Table 2: Energy default rate could be significant, potentially
leading to further risk aversion by market participants
have seen bank loans prove to be a low volatility complement, essentially a risk diversifier.
Supporting the low volatility outlook for bank loans in 2015 is also
the limited exposure to energy. The energy sector accounts for 4%
of the Credit Suisse Leveraged Loan Index versus 14% for the Barclays High Yield Index, limiting the downside risk from a continued energy related selloff and price volatility. Further, given the
secured status and seniority in the capital structure, many energy
loans now trade at potential recovery values, limiting downside
from these price levels (Chart 5).
Bank loans yields are at three year highs, stable balance sheets
are likely to suppress default rates, and limited duration risk gives
substantial relative value versus the absolute low yield level of traditional fixed income. In our view, bank loans are attractive and
a preferred complement to diversify traditional fixed income and
reduce interest rate risk.
Chart 5: Only 4% of the CS Leveraged Loan Index is energy related, limiting the downside risk for bank loans from further
energy related volatility
110
CS Leveraged Loan Index Price
Energy Sector Price
100
U.S. energy sector default rate
Scenario
2015
2016
2017
Average
$65 average oil price
3.9%
20.5%
15.5%
13.3%
96.13
90
80
U.S. High yield index default rate
Scenario
2015
$65 average oil price
3.0%
2016
2017
Average
5.6%
5.0%
4.5%
Source: JP Morgan, estimates as of December 31, 2014
81.46
70
60
50
Jan-11
Jul-11
Jan-12
Jul-12
Jan-13
Jul-13
Jan-14
Jul-14
Jan-15
Source: Credit Suisse, as of January 29, 2014
3
4) loans or bonds
january 2015
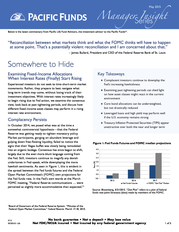
Chart 6: Bank loans had similar returns to high yield in 2014
while exhibiting low volatility - a pattern we believe will continue in 2015
7
6
2014 total return (%)
Barclays U.S. High Yield
CS Leveraged Loan Index
5
profile, provides the potential to participate in upside surprises via
spread compression, and thus, price appreciation, while current in-
come cushions downside risks relative to equities. For investors
that are rebalancing after another strong equity year, high yield
offers a compelling risk/reward profile.
Bank loans provide the ability diversify traditional fixed income
risk, reduce portfolio duration, and increase portfolio yields. Also,
4
given bank loans limited exposure to energy, we believe they will
3
2
1
0
-1
Jan-14
High yield bonds, given their current valuations and historic return
Mar-14
May-14
Jul-14
Federal Reserve
Sep-14
Nov-14
Source: Barclays, Credit Suisse, as of December 31, 2014
In 2014, credit risk was a clear loser to duration risk. As a result,
Loans or bonds: What’s the role in the portfolio?
high yield bonds and bank loans have a more compelling relative
continue to provide a low volatility return profile relative to other
spread based assets. For investors rebalancing fixed income portfolios after a strong year for duration based assets, bank loans may
be a perfect complement.
Pacific Asset Management
January 2015
value starting point than at any point in the past three years. So
which asset class is more compelling? In our opinion, that depends
on what an investor hopes to accomplish in the portfolio. Outside
of having a similar yield profile, each asset class may respond dif-
ferently to various markets, giving them multiple roles in portfolio
allocation.
ABOUT PACIFIC ASSET MANAGEMENT
Founded in 2007, Pacific Asset Management specializes in credit oriented fixed income strategies. Pacific Asset Management is a division of Pacific Life Fund Advisors
LLC, an SEC registered investment adviser and a wholly owned subsidiary of Pacific Life Insurance Company (Pacific Life). As of December 31, 2014 Pacific Asset Management managed approximately $4.8bn. Assets managed by Pacific Asset Management includes assets managed at Pacific Life by the investment professionals of Pacific
Asset Management.
IMPORTANT NOTES AND DISCLOSURES
Bank loan, corporate securities, and high yield bonds involve risk of default on interest and principal payments or price changes due to changes in credit quality of the
borrower, among other risks. Pacific Asset Management is an investment advisor; it provides investment advisory services to institutional clients and does not sell securities. Pacific Select Distributors, LLC. is the distributor for Pacific Life’s retail products. Pacific Asset Management and Pacific Select Distributors, LLC. are each a wholly
owned subsidiary of Pacific Life.
This information is presented for informational purposes only. This is not to be construed as an offer to buy or sell any financial instruments and should not be relied
upon as the sole investment making decision. All material is compiled from sources believed to be reliable, but accuracy cannot be guaranteed. The opinions expressed
herein are based on current market conditions, are subject to change without notice. Investors should consider the investment objectives, risks, charges and expenses
carefully before investing. Please read the applicable prospectus or other offering documents carefully before investing. For this and more complete information
about the available investment vehicles, investors should contact their financial advisor, consultant or visit www.pacificlife.com or www.pam.pacificlife.com.
FOR MORE INFORMATION
Pacific Asset Management • 700 Newport Center Drive • Newport Beach, CA 92660 • www.pam.pacificlife.com
4