Category
Index (2871)

Bullseye Highlights Panic P/Es T he markets are in the process of liquidation with lower lows interceded by strong rallies. Listening to the market takes constant effort, and sometimes we can learn from the distant past. Since July 1997 (Asian Crisis), default risk has been more of a concern to markets than inflation risk. Our awareness of prior Panics caused a swell of extreme discomfort in...
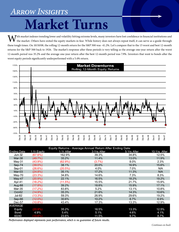
Arrow Insights Market Turns W ith market indexes trending lower and volatility hitting extreme levels, many investors have lost confidence in financial institutions and the market. Others have exited the equity markets in fear. While history does not always repeat itself, it can serve as a guide through these tough times. On 10/10/08, the rolling 12-month return for the S&P 500 was...
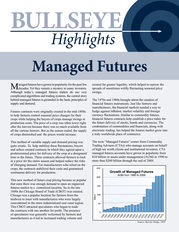
Bullseye Highlights Managed Futures M anaged futures have grown in popularity for the past few decades. Yet they remain a mystery to many investors. Although today’s managed futures traders do use very complicated algorithms and trading systems, the central story behind managed futures is grounded in the basic principles of supply and demand. Futures contracts were originally created...
Bullseye Highlights Investor Returns F or the past several years, Morningstar® has been tracking mutual fund asset flows to provide a statistic they call “Investor Returns” (or dollar-weighted returns) on an individual fund basis. The returns are based on purchase and sales data, giving more weight to periods when investors are pouring assets into a fund and...
BULLSEYE Highlights Investor Behavior D ALBAR’S Quantitative Analysis of Investor Behavior (QAIB) has been measuring the effects of investor decisions to buy, sell and switch into and out of mutual funds since 1984. The QAIB study revealed that over the long term, the average asset allocation investor earned significantly less than mutual funds with an asset allocation...
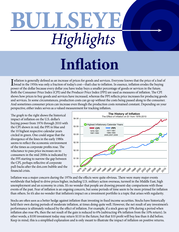
Bullseye Highlights The History of Inflation The Effect of Inflation on $1 from 1976-2010 $4.00 Highest Inflationary Calendar Years Inflation CPI $3.50 1976-1981 1987-1990 PPI 1977-1981 1989-1990 2005,2007,2009 $3.00 I $2.50 19 7 19 6 7 19 8 80 19 8 19 2 84 19 8 19 6 88 19 9 19 0 92 19 9 19 4 96 19 9 20 8 0 20 0 02 20 0 20 4 06 20 0 20 8 10 nflation is generally defined as an...
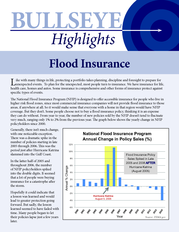
Bullseye Highlights Flood Insurance L ike with many things in life, protecting a portfolio takes planning, discipline and foresight to prepare for unexpected events. To plan for the unexpected, most people turn to insurance. We have insurance for life, health care, homes and autos. Some insurance is comprehensive and other forms of insurance protect against specific types of events. The...
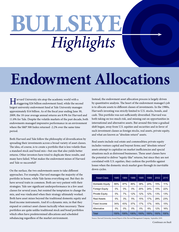
Bullseye Highlights Endowment Allocations H arvard University sits atop the academic world with a staggering $26 billion endowment fund, while the second largest university endowment fund at Yale University manages approximately $16 billion. As of the fiscal year ending June 30, 2009, the 10-year average annual returns are 8.9% for Harvard and 11.8% for Yale. Despite the volatile markets of the...
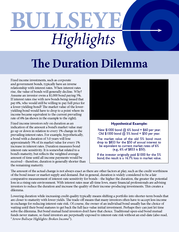
Bullseye Highlights The Duration Dilemma Fixed income investments, such as corporate and government bonds, typically have an inverse relationship with interest rates. When interest rates rise, the value of bonds will generally decline. Why? Assume an investor owns a $1,000 bond paying 5%. If interest rates rise with new bonds being issued that pay 6%, who would still be willing to pay full price...
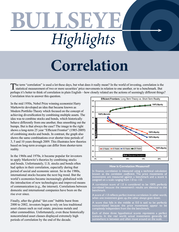
Bullseye Highlights Correlation T he term “correlation” is used a lot these days, but what does it really mean? In the world of investing, correlation is the statistical measurement of two or more securities’ price movements in relation to one another, or to a benchmark. But perhaps it’s better to think of correlation in plain English—how...
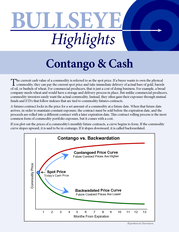
Bullseye Highlights Contango & Cash T he current cash value of a commodity is referred to as the spot price. If a buyer wants to own the physical commodity, they can pay the current spot price and take immediate delivery of actual bars of gold, barrels of oil, or bushels of wheat. For commercial producers, that is just a cost of doing business. For example, a bread company needs wheat...
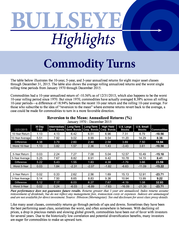
Bullseye Highlights Commodity Turns The table below illustrates the 10-year, 5-year, and 3-year annualized returns for eight major asset classes through December 31, 2015. The table also shows the average rolling annualized returns and the worst single rolling time periods from January 1970 through December 2015. Commodities had a 10-year annualized return of -10.56% as of 12/31/2015, which also...
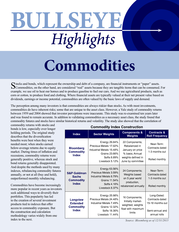
Bullseye Highlights Commodities S tocks and bonds, which represent the ownership and debt of a company, are financial instruments or “paper” assets. Commodities, on the other hand, are considered “real” assets because they are tangible items that can be consumed. For example, we use oil to heat our homes and to produce gasoline to fuel our cars. And we...
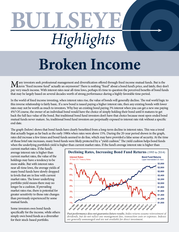
Bullseye Highlights Broken Income M any investors seek professional management and diversification offered through fixed income mutual funds. But is the term “fixed income fund” actually an oxymoron? There is nothing “fixed” about a bond fund’s price, and lately, they don’t pay very much income. With interest rates near all-time lows,...
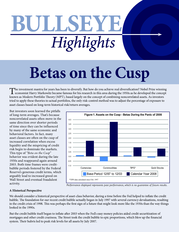
Bullseye Highlights Betas on the Cusp T he investment mantra for years has been to diversify. But how do you achieve real diversification? Nobel Prize winning economist Harry Markowitz became famous for his research in this area during the 1950s as he developed the concept known as Modern Portfolio Theory (MPT), based largely on the concept of combining noncorrelated assets. As investors tried...

Bullseye Highlights Asset Class Seasonality There is an old adage that says, “Sell in May and go away.” Is there any truth to it, or is it just a clever thing to say without any statistical validity? Historically, the phrase has been largely dismissed by academics as anecdotal at best. There are many catch-phrases that are popular in the financial services industry,...


